Interpreting and Exploring Metrics
Transform overwhelming data into actionable insights with interpretation techniques that reveal hidden patterns
We're all drowning in data these days: dashboards, reports, and endless updates. But let's face it, most of these presentations are overwhelming and hard to read. The good news? Learning to see beyond the charts reveals incredible insights that were always there. Think of it as developing a new lens that helps you spot meaningful patterns, recognize genuine trends, and identify those strange outliers that might signal something important.
Breaking data down by customer groups, time periods, or user behaviors uncovers stories that broad metrics often miss. And here's something we all struggle with: confirmation bias. It's that sneaky tendency to notice things that support what we already believe while conveniently missing evidence that doesn't. By building your analytical toolkit, you'll transform those initially intimidating dashboards into powerful allies for decision-making. These skills don't just make you better with numbers. They help you connect metrics to real business impact, turning raw data into the insights that actually drive smart decisions and meaningful improvements.
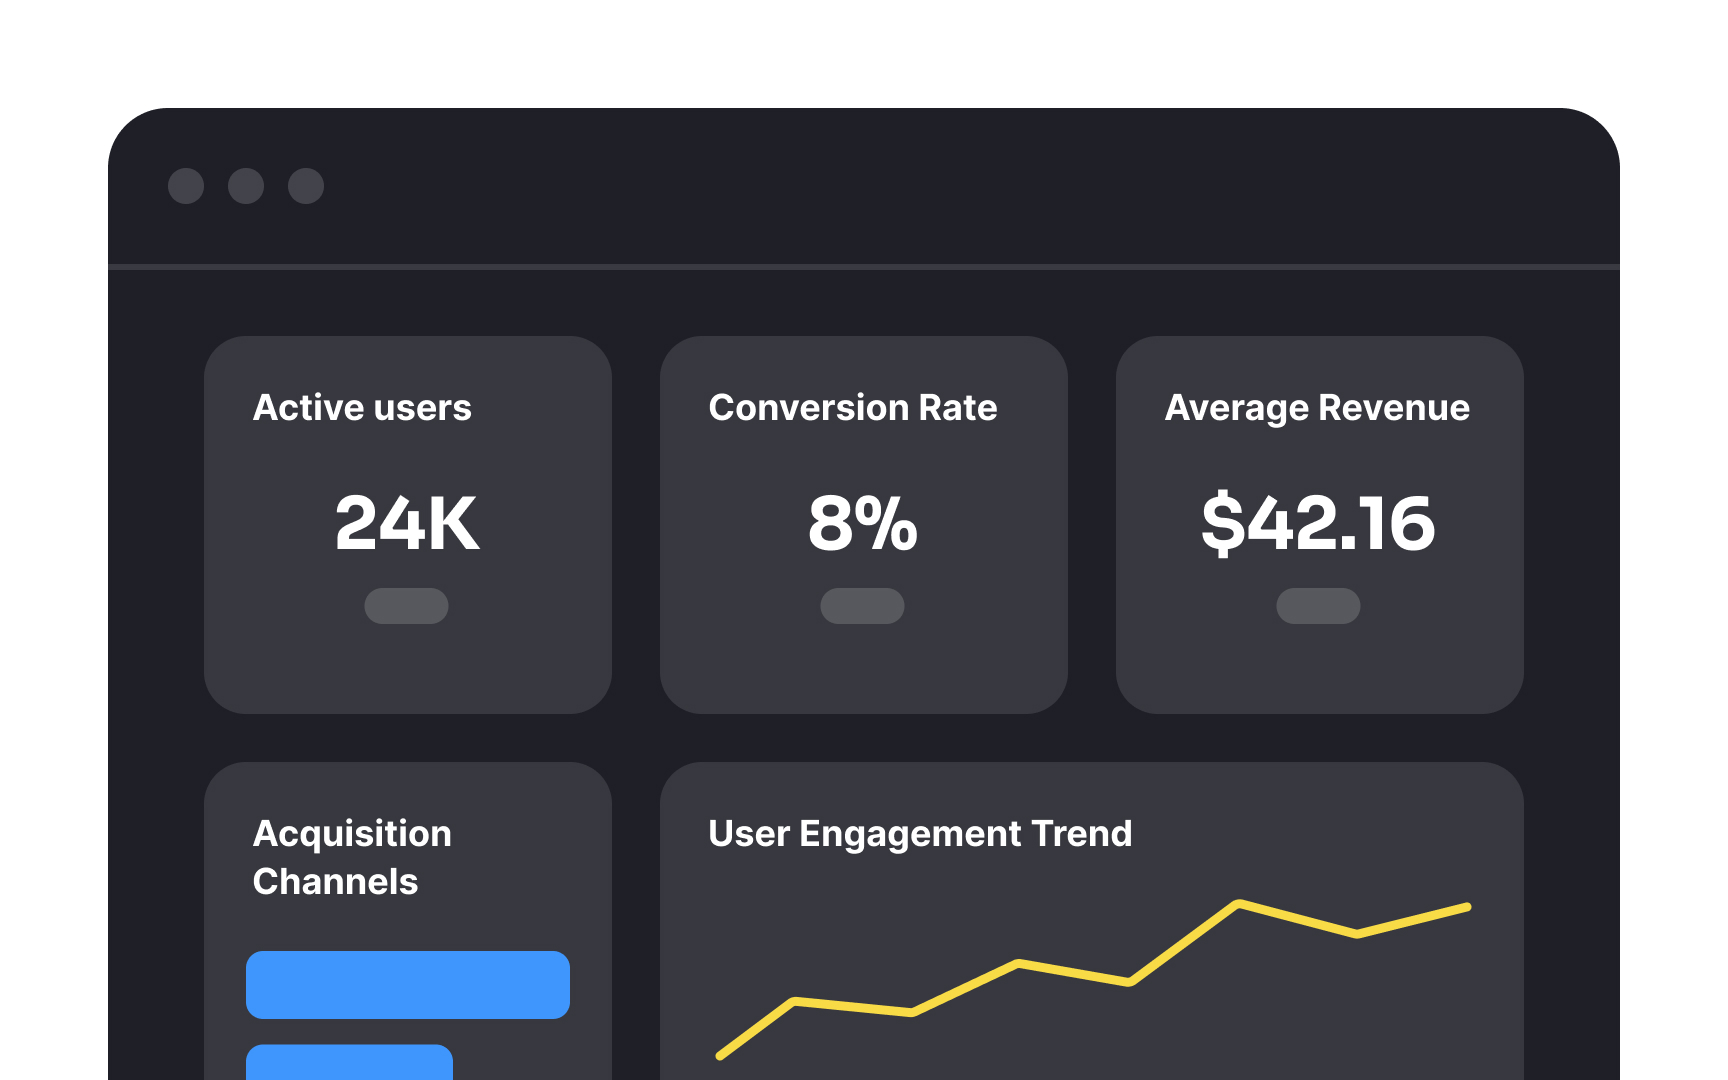
Dashboards compile key metrics into a visual interface that helps you monitor performance at a glance. Effective dashboards highlight the most important information first, typically in the upper left corner where the eye naturally begins scanning. They present data in context, showing trends over time rather than isolated numbers.
A well-designed
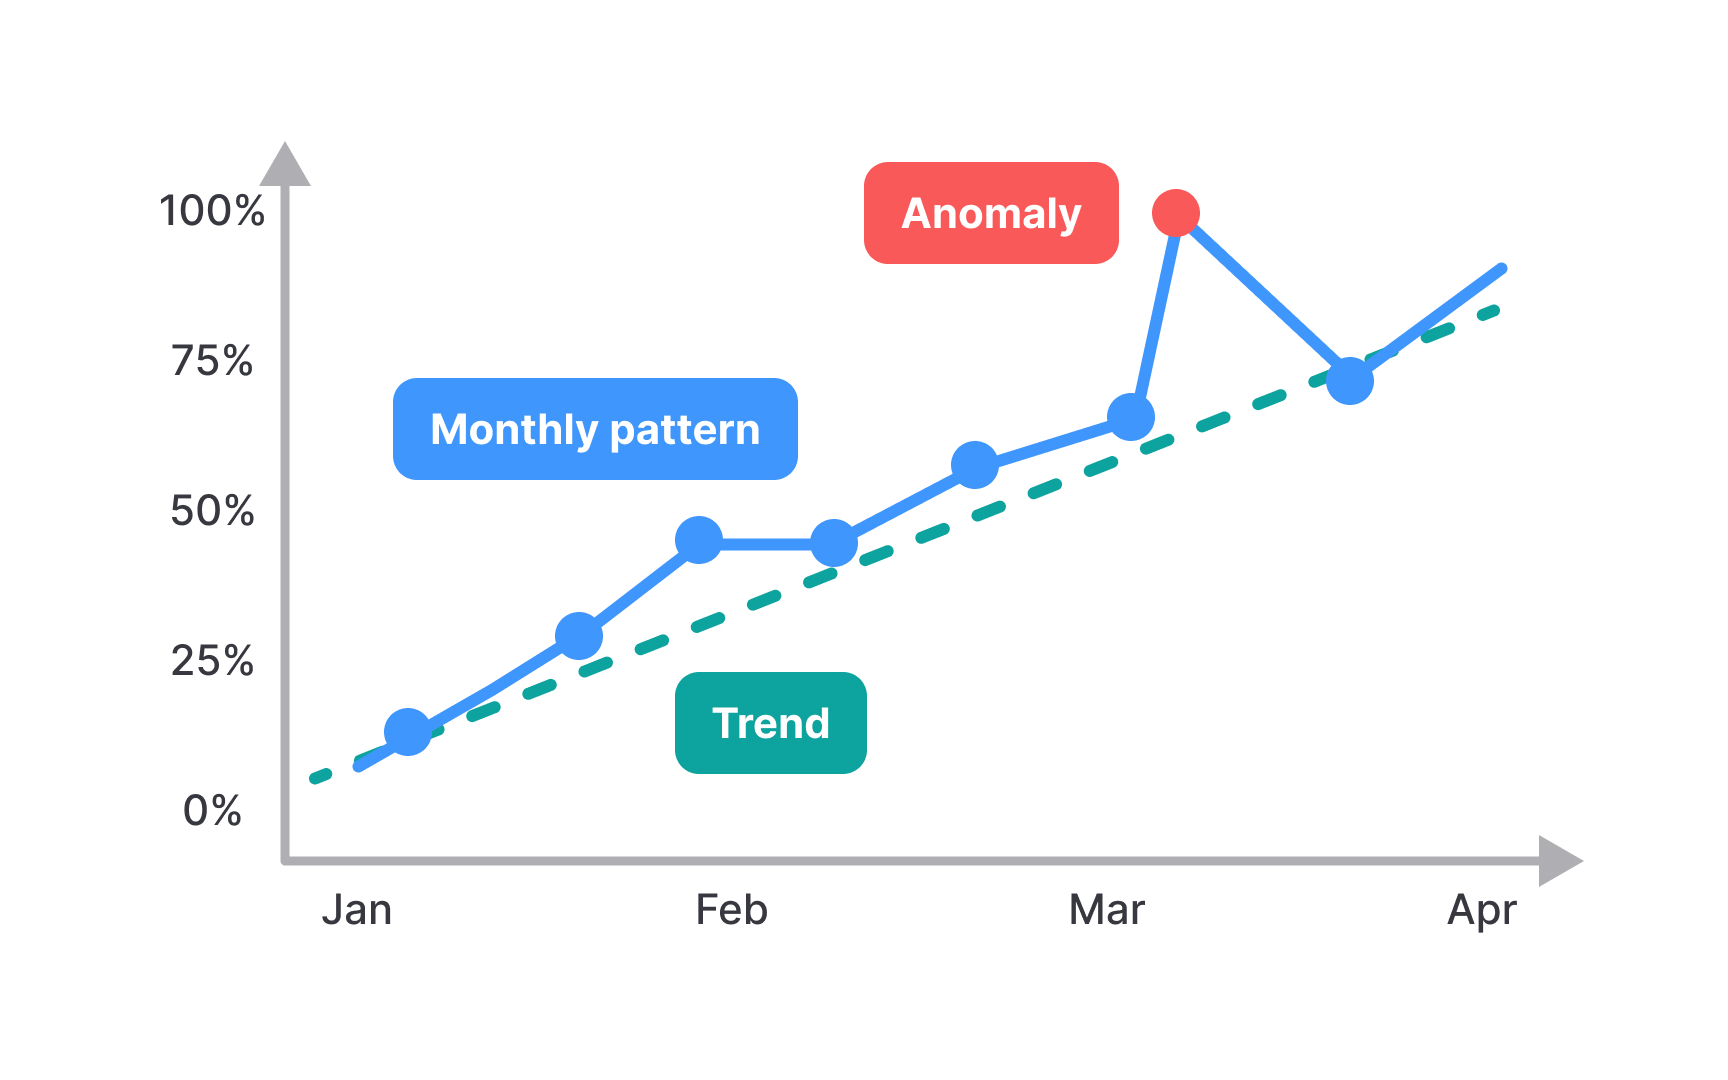
Trends, patterns, and anomalies are 3 critical insights you can extract from metrics data. Trends show directional movement over time: whether metrics are consistently increasing, decreasing, or remaining stable. Identifying a trend requires looking at data across multiple time periods rather than focusing on isolated data points. Patterns reveal recurring behaviors or cycles within your data, such as weekly usage spikes every Monday or quarterly purchasing surges. These patterns often correlate with external factors like work schedules, seasonal changes, or marketing campaigns. Recognizing these patterns helps you predict future behavior and plan accordingly.
Anomalies are data points that significantly deviate from established patterns, potentially signaling problems or opportunities. For example, a sudden drop in conversion rate might indicate a broken checkout flow, while an unexpected usage spike could reveal a viral mention of your product.
If you see an anomaly, check:
- How does this compare to last month, week or same time last year?
- How does this compare across devices?
- How does this compare across markets?
Segmentation breaks down aggregate metrics into meaningful subgroups, revealing insights that overall averages might hide. For example, your product's average usage time might seem stable, but segmenting by user type could show new users spending less time while power users compensate by spending more, a potential early warning of future problems.
Common segmentation approaches include:
- Demographic factors (age, location, industry)
- Behavioral characteristics (usage frequency, feature adoption)
- Acquisition channels (organic search, social media, referrals)
- Time-based cohorts (users who joined during specific periods)
When segmenting data, avoid creating groups too small for statistical significance. Similarly, too many segments can lead to analysis paralysis. Focus on segments that directly relate to your key business questions and provide actionable insights that can drive specific improvements to your product or strategy.
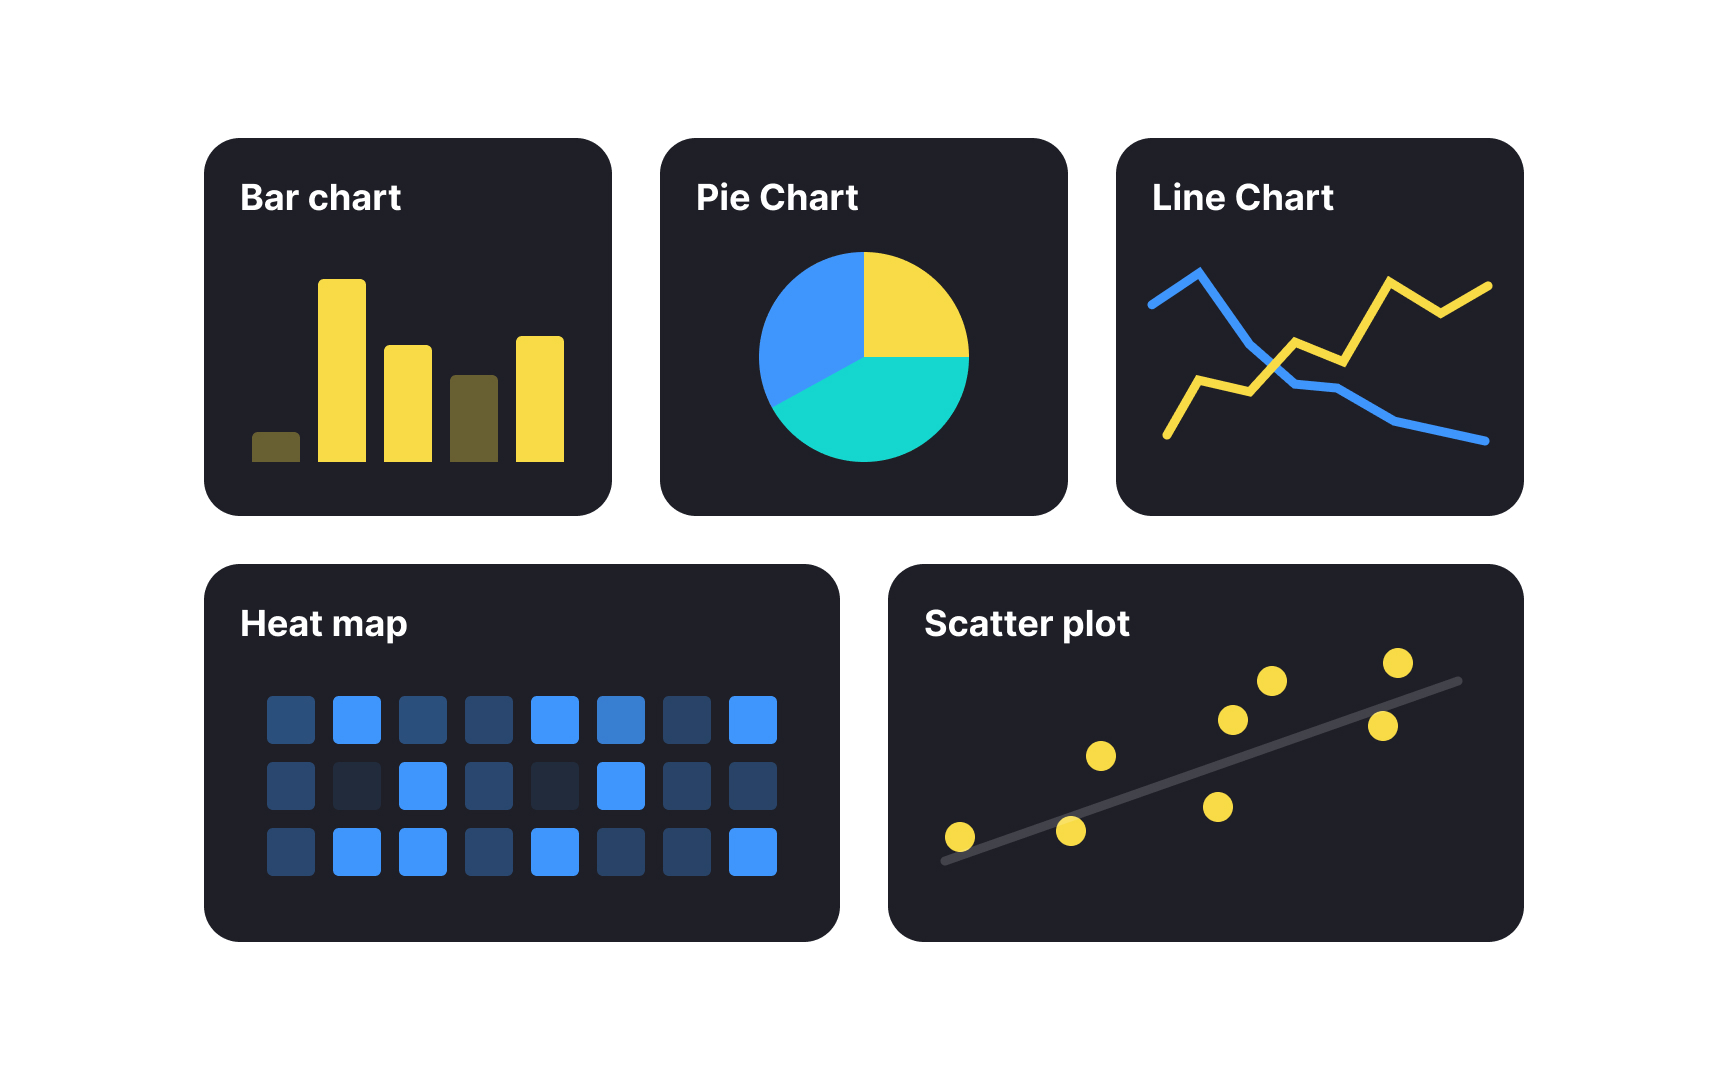
Different chart types serve specific purposes in communicating data effectively:
- Bar
charts compare values across categories and work best for discrete comparisons such as monthly revenue by product orconversion rates by channel. - Line charts reveal trends over time and excel at showing continuous data evolution like user growth or engagement metrics.
- Pie charts show how different parts make up a whole, like what percent of total sales came from in-store, online, and third-party channels.
- Heat maps use
color intensity to visualize data density like displaying user click patterns on a website or showing peak usage hours. - Scatter plots help identify relationships between two variables, making them ideal for correlation analysis like examining the connection between feature usage and retention.[2]
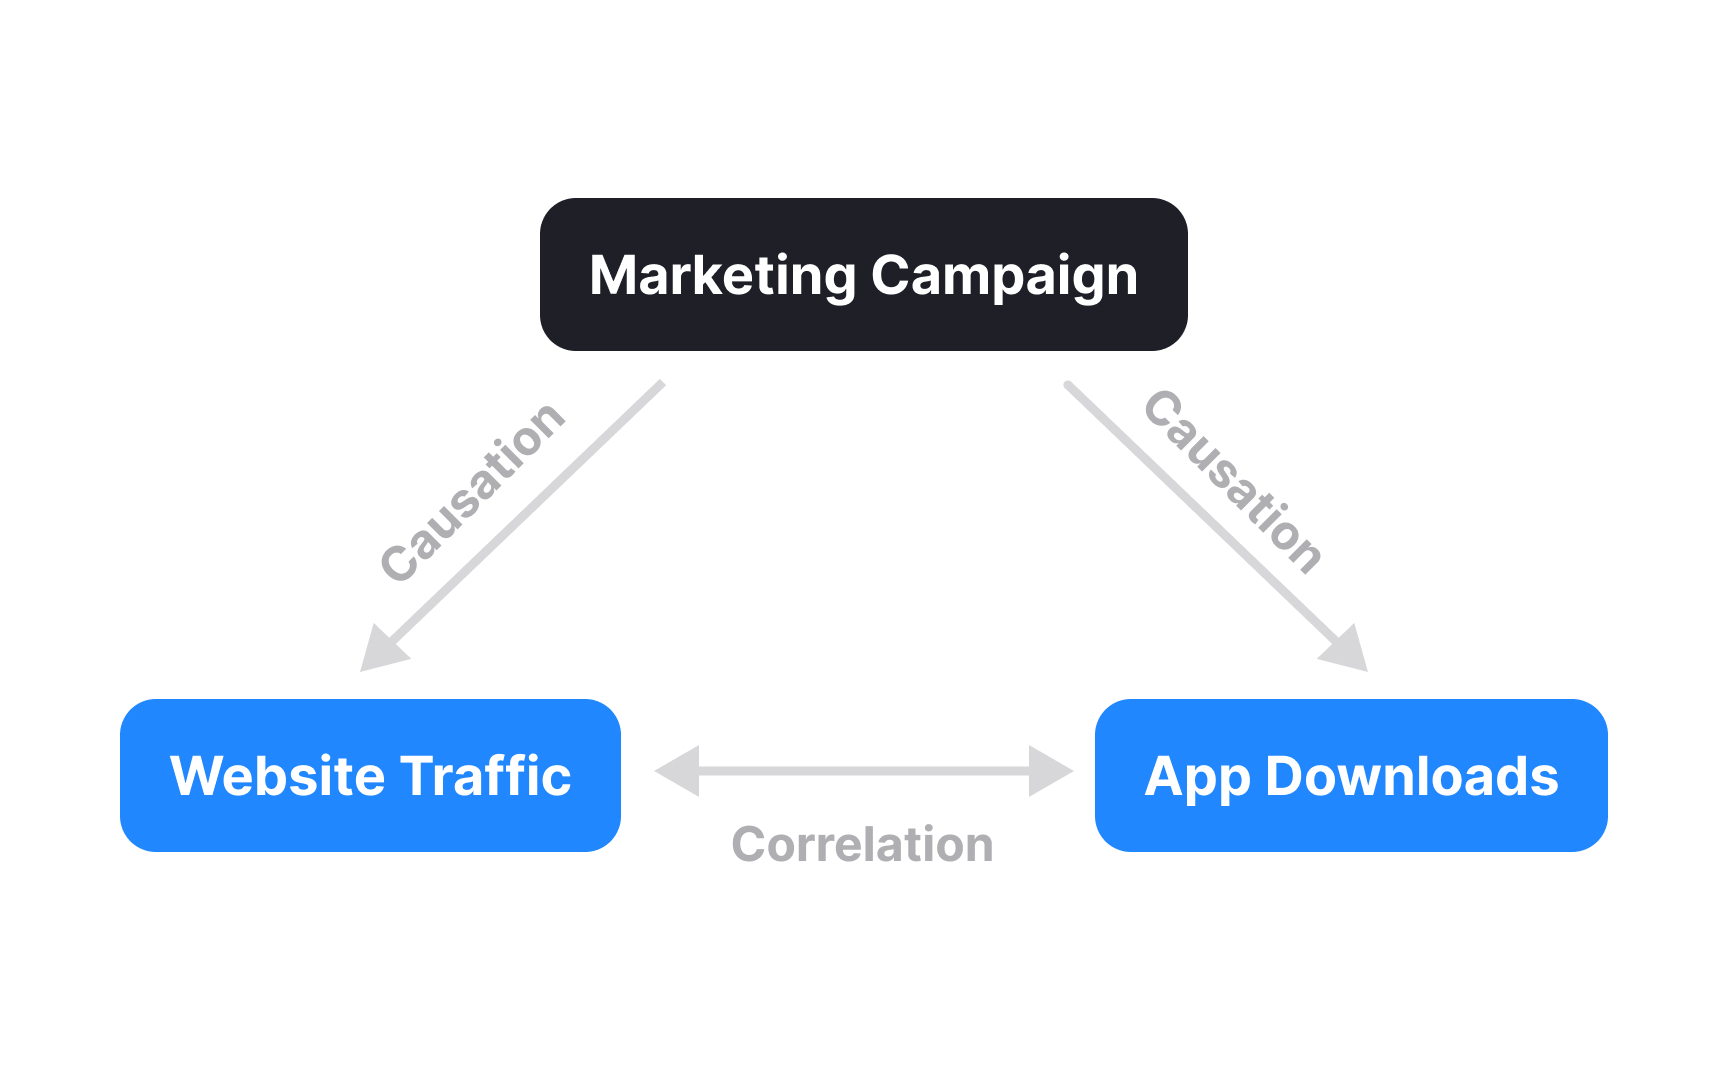
Correlation indicates that two metrics move together, while causation means one metric directly influences another. For example, you might notice that your app downloads increases on the same days that your website traffic spikes, showing correlation. However, this doesn't prove that higher website traffic causes more app usage; both might increase because of an external factor like a
Understanding this distinction prevents costly mistakes. Imagine seeing that users who enable dark mode have 20% higher
Testing for causation requires controlled experiments, typically A/B tests. If you randomly assign new users to either see dark mode by default (test group) or light mode (control group), and the test group shows significantly higher retention, you've demonstrated causation. Without such experiments, use caution when making decisions based on correlated metrics and consider alternative explanations for the relationships you observe.
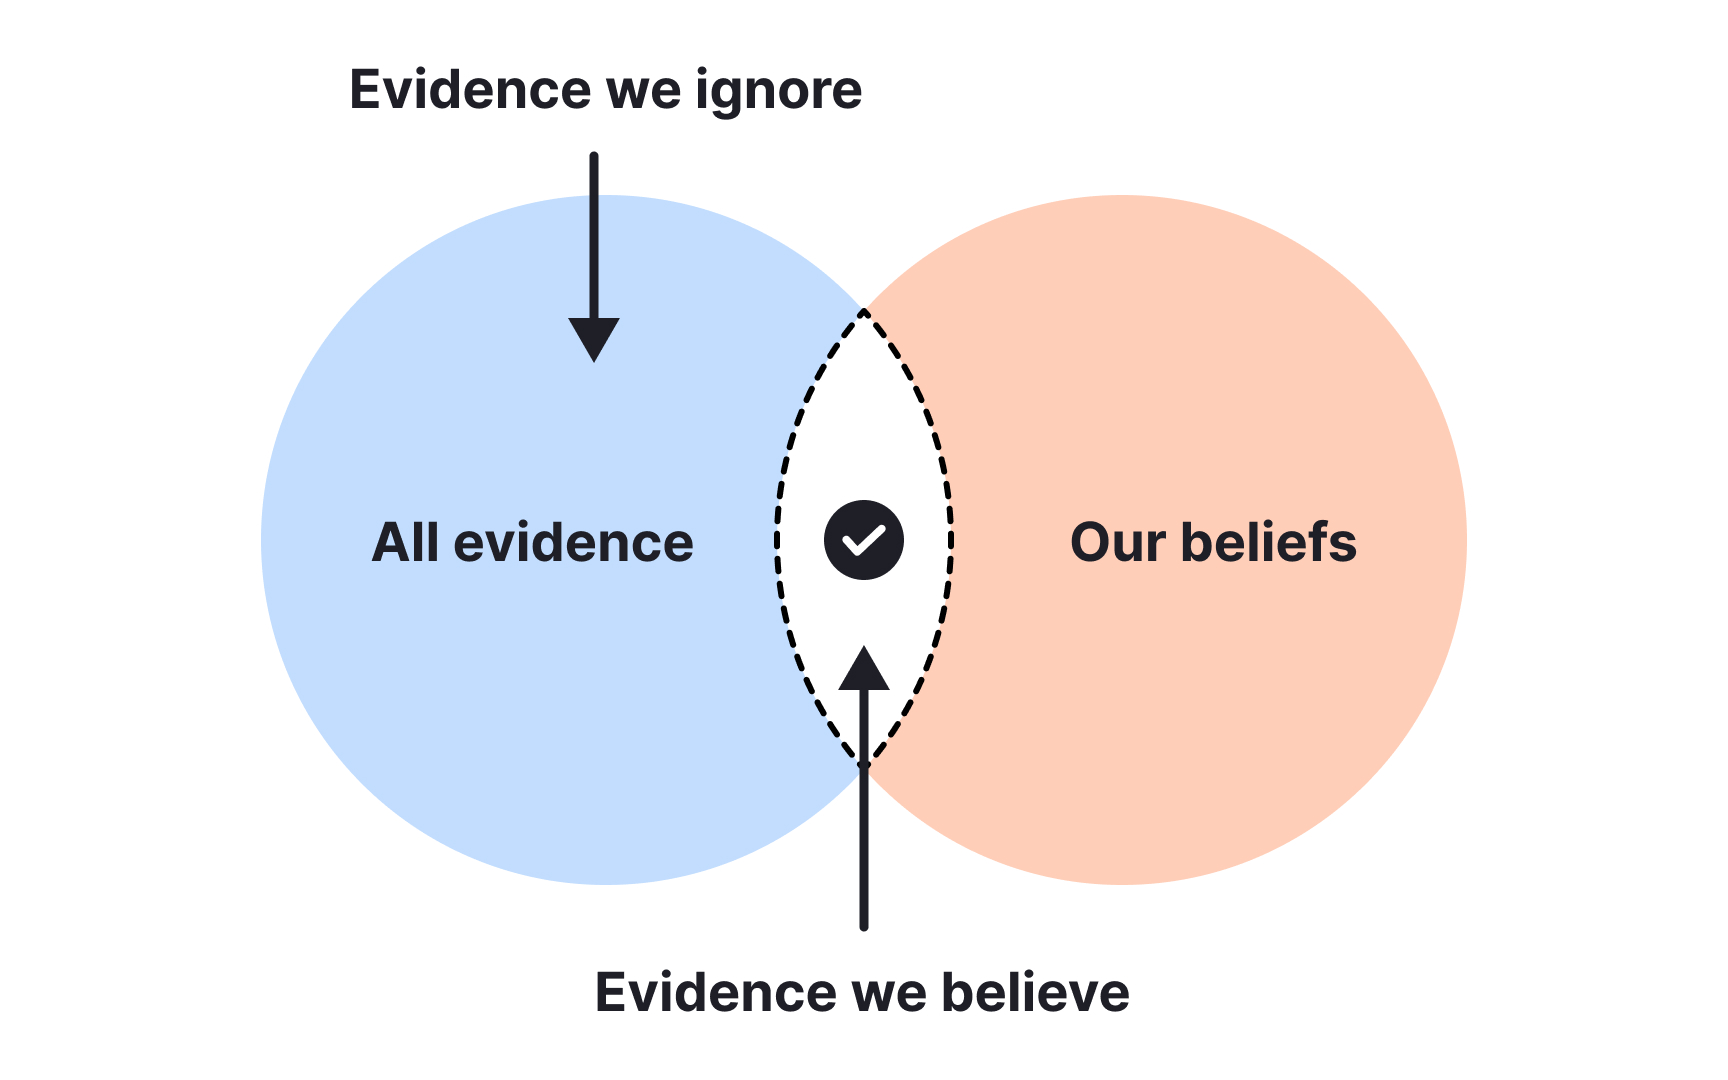
Confirmation bias is our tendency to focus on data that supports our existing beliefs while overlooking contradictory information.[3] In metrics analysis, this manifests when we eagerly embrace numbers that validate our hypotheses but dismiss or explain away metrics that challenge them. This bias can derail product decisions and lead to missed opportunities.
Countering confirmation bias requires deliberately seeking evidence that contradicts your assumptions. Start by formulating a null hypothesis (H₀) that states "there is no relationship" or "no effect" between variables, alongside an alternative hypothesis (H₁) representing what you're actually trying to prove. The goal then is to rigorously test whether there's sufficient evidence to reject the null hypothesis.
Structured analysis techniques also help minimize bias:
- Segment your data in different ways to see if patterns hold across various user groups.
- Set specific thresholds for metrics in advance to prevent moving goalposts later.
- Consider asking colleagues who weren't involved in the initial hypothesis to review your findings with fresh eyes.
Remember that failing to reject the null hypothesis isn't a failure. It provides valuable learning that prevents wasted resources on false assumptions.
Statistical outliers are data points that deviate significantly from the typical pattern in your metrics. While sometimes dismissed as anomalies to be ignored, outliers often contain valuable insights about edge cases or emerging issues. For instance, in a SaaS product where most users complete tasks in 2-5 minutes, a few sessions might last 45+ minutes. These are outliers that deserve attention rather than automatic exclusion.
Several approaches exist for identifying outliers. The simplest is visual inspection through scatter plots or box plots that make extreme values immediately apparent. More rigorous methods include statistical calculations like standard deviation (flagging values more than 3 standard deviations from the mean). These statistical approaches provide consistent identification regardless of dataset size.
When you discover outliers, investigate rather than automatically removing them. Consider questions like: Do these users share any characteristics? Could a bug or technical issue explain the extreme values? Is this an early indicator of a broader trend? A great example of this is Tinder, where they found a small percentage of users purchasing a disproportionate amount of one-off features. After researching this outlier cohort, they discovered these were primarily men who traveled frequently (military personnel, salespeople) who wanted to date efficiently while in new locations. Rather than dismissing these outliers, Tinder leveraged this insight to build premium subscription tiers specifically catering to these high-value users.[4]
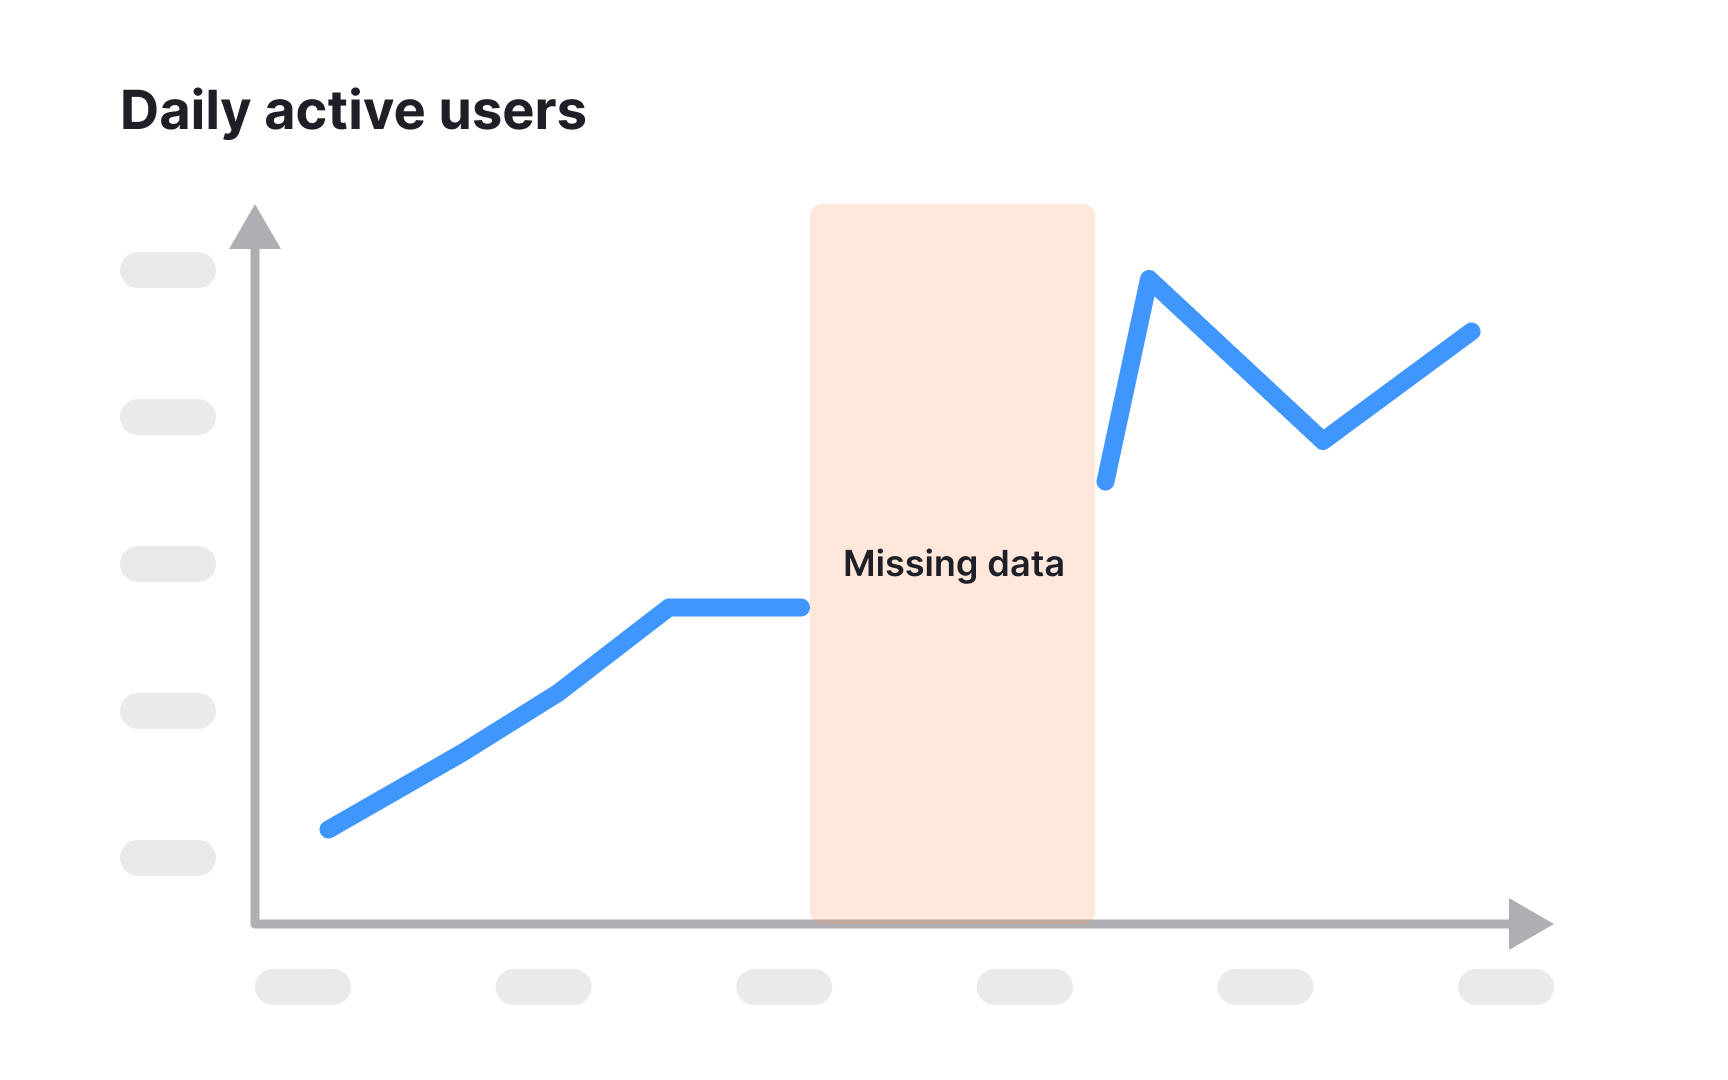
Working with incomplete data is inevitable in metrics analysis. A really common example of this is looking at
Next, apply appropriate techniques based on your specific scenario. For incomplete trial conversion data, you might use metrics like "conversion rate by trial-day" rather than calendar date, allowing you to meaningfully compare cohorts at similar points in their journey regardless of when they started. For retention analysis with insufficient history, you could analyze leading indicators that historically correlate with long-term retention, such as specific engagement actions during week one.
When presenting these estimates, clearly label them as derived values rather than direct measurements. Focus on drawing conclusions that remain valid even if your estimates are off by a reasonable margin. For example, if early engagement metrics for new users show significant improvement even with incomplete conversion data, you can be more confident in the feature's positive impact on the user journey.


Similar lessons

How to Design Dashboards for Better Analytics

When & How to Use Tables in UIs
