Charts
Charts are visual tools for displaying data, helping teams identify trends, compare values, and communicate across design, product, and business contexts.


Charts are one of the most widely used tools for visualizing information. They translate complex data sets into shapes, colors, and structures that people can understand at a glance. In digital product environments, charts are often integrated into dashboards, reports, or presentations to simplify analysis and decision-making. The goal is not just to make data more attractive but to make it more usable by highlighting relationships and patterns that raw numbers cannot easily convey.
In UX and UI design, charts support data-heavy products by making information accessible to end users. For example, a fitness tracking app might use line charts to show weekly exercise progress or bar charts to compare activity types. These visualizations not only provide clarity but also motivate users by showing progress over time. In finance or project management tools, charts help people quickly identify whether performance is improving, stable, or declining.
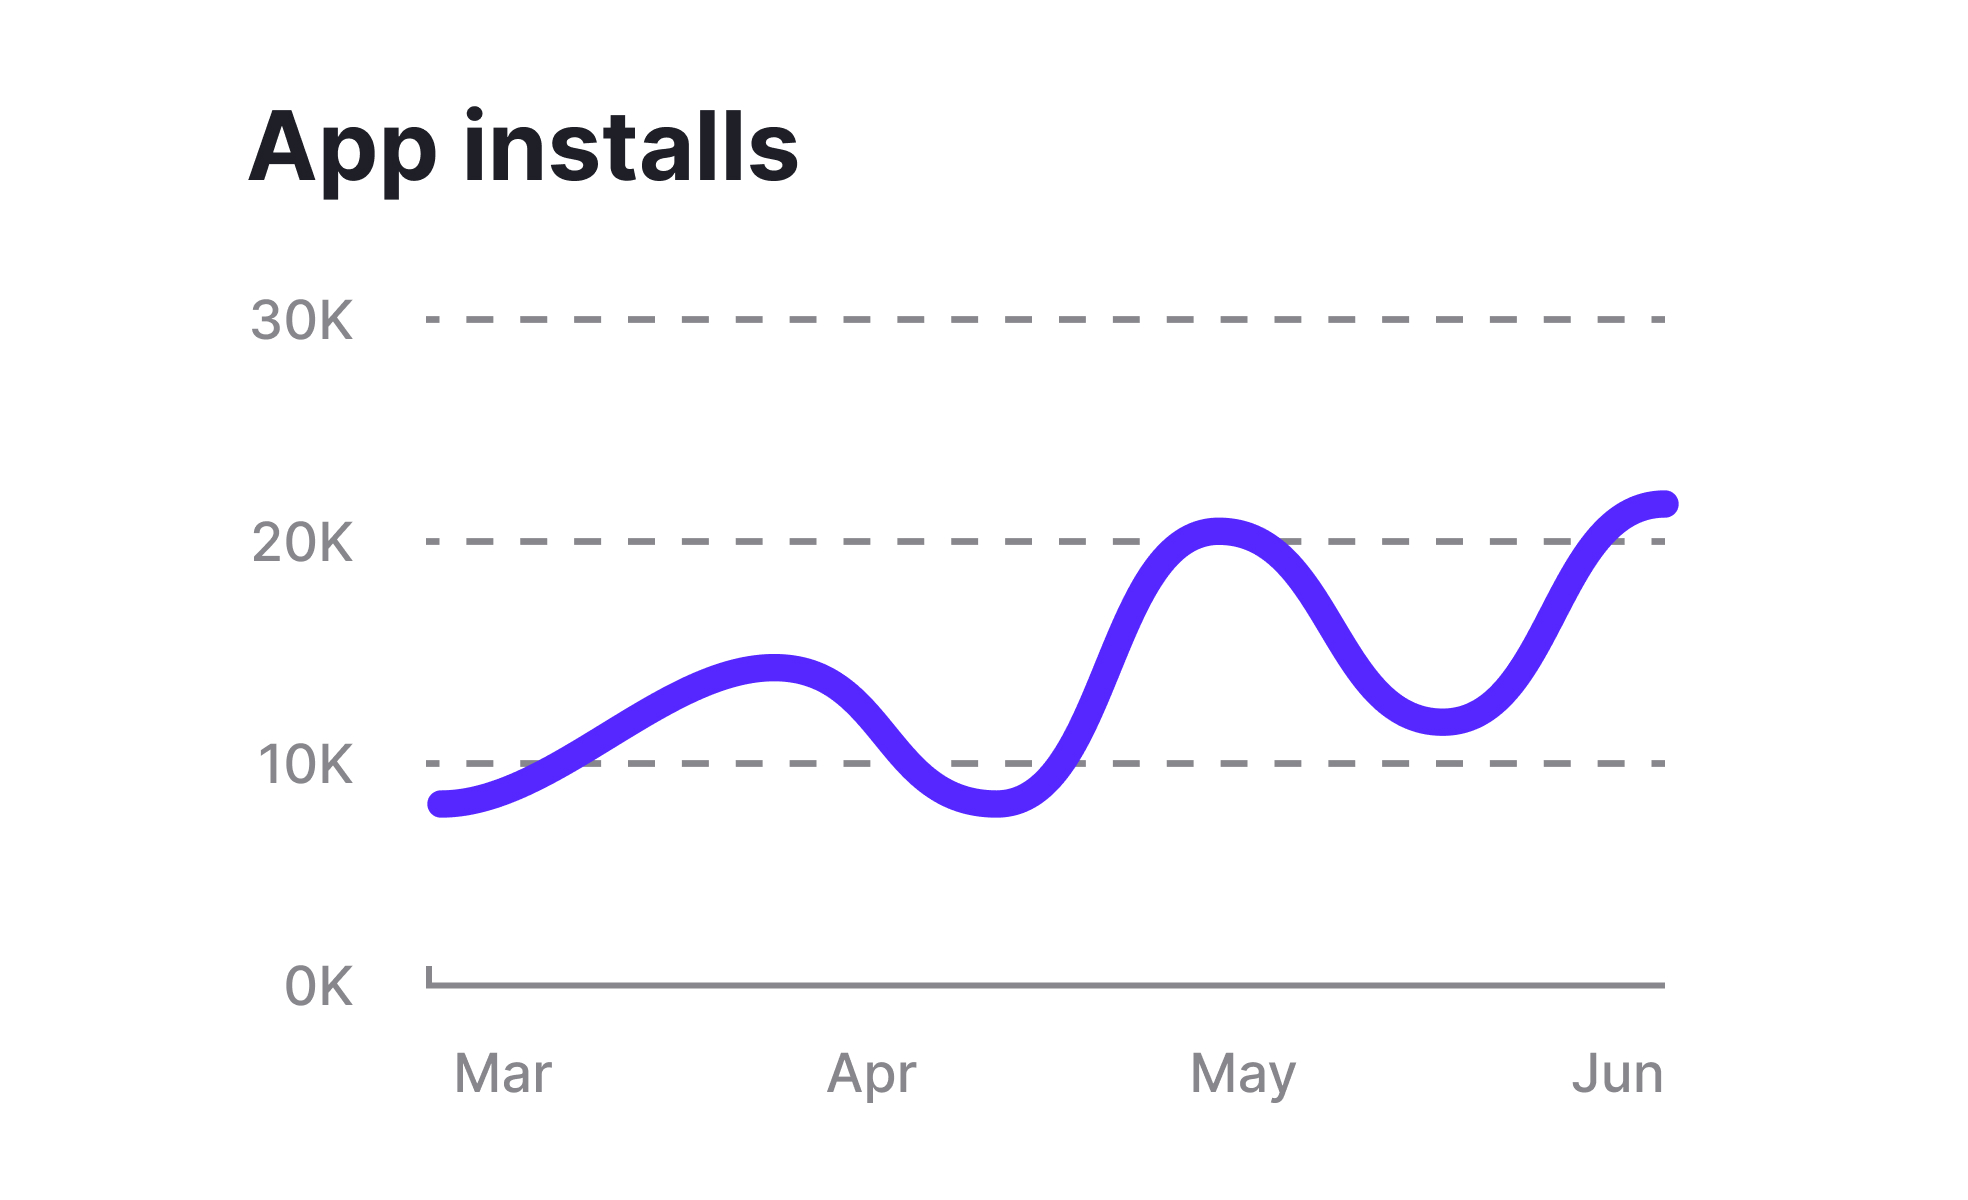
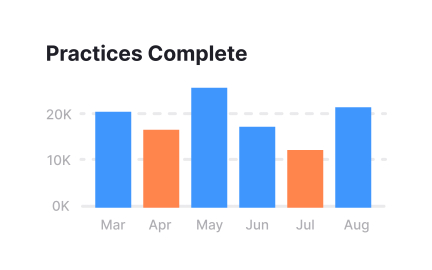
Different chart types suit different goals. Line charts are effective for tracking changes over time, while bar charts make comparisons between categories clearer. Pie charts work for showing proportions, though they are often criticized for being less precise. Heat maps highlight density and distribution, while scatter plots show relationships between variables. Choosing the right chart type is essential because a mismatched visualization can confuse users instead of clarifying insights.
Real-world examples show how charts influence product outcomes. Companies like Spotify use charts within their analytics dashboards to help artists understand listener behavior. Google Analytics relies heavily on line and bar charts to help marketers interpret traffic patterns. Even platforms like Trello or Jira integrate burndown and progress charts to give teams a sense of project momentum. Each case demonstrates how effective charting directly supports decision-making.
Interactivity enhances the power of charts. Modern digital tools allow users to hover over data points, filter ranges, or zoom in on sections for deeper insights. This level of control transforms charts from static visuals into dynamic exploration tools. Interactive charts are especially useful in SaaS dashboards, where stakeholders need tailored insights rather than one-size-fits-all presentations.
Learn more about this in the Best Practices for Designing Charts Lesson, a part of the UI Components II Course.
Key Takeaways
- Charts simplify complex data into visual patterns and relationships.
- Different chart types fit different purposes, such as trends, comparisons, or proportions.
- Widely used in UX, product management, and stakeholder communication.
- Interactive charts add depth and personalization to data exploration.
- Accessibility requires thoughtful color choices and labeling.
The choice depends on the story the data should tell. Line charts suit time-based changes, bar charts highlight category comparisons, and scatter plots show relationships between variables. Designers must ask whether the chart should emphasize trends, comparisons, or distributions.
Testing with users helps confirm if the chart conveys insights clearly. Poorly chosen visualizations risk misinterpretation and reduce trust in the data presented.
Charts allow product managers to communicate performance quickly and effectively. Retention curves, funnel charts, and revenue trend lines help frame discussions with executives and align product direction with evidence. They also identify pain points, such as where users abandon onboarding.
By using charts, product managers move conversations from intuition-driven debates to data-driven decisions, increasing credibility and clarity in their recommendations.
Accessibility requires going beyond colors by adding labels, patterns, and text equivalents. Designers should use high-contrast palettes, provide descriptive tooltips, and ensure screen readers can access explanations.
Accessible charts not only support users with disabilities but improve clarity for all. When charts are clear in multiple formats, they build trust and ensure insights are truly inclusive.
Recommended resources
Courses

UX Design Foundations


UI Components I


Design Terminology

Lessons

Intro to Charts in UI

Best Practices for Designing Charts

Tooling, Templates, and Tech Stacks
Projects

Pruvi - Cycling iOS App


Analytics Dashboard UI


Medical Management Dashboard-HealNow