Gridlines
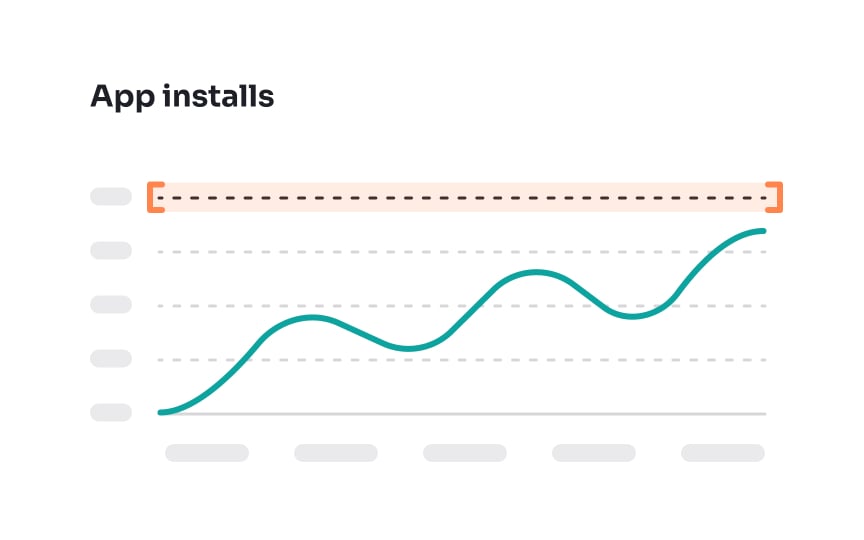
Gridlines in charts are light lines that run along the X and Y axes, crossing the chart to create a grid. They extend across the plot area to make it easier to read and interpret the data by providing a reference point for the viewer's eyes.
While not always necessary, gridlines can significantly enhance a chart's readability, especially when dealing with large sets of numbers or complex data.

