Medical Management Dashboard-HealNow


HealNow is a powerful and intuitive Medical Therapy Management Dashboard designed to simplify the administration of online therapy services. Tailored for administrators, it provides comprehensive tools to manage therapists, monitor user activities, and oversee the platform's overall performance.
Key Features:
- Patient & Therapist Management: Effortlessly manage patient data and therapist sessions, ensuring seamless coordination.
- Approval Workflow: Review and approve therapist KYC documents to maintain quality standards.
- Survey Management: Monitor surveys, create custom survey questions, and analyze responses for valuable insights.
- Activity Monitoring: Track user and therapist activities in real-time for better oversight.
- Income Overview: Get a clear snapshot of revenue and financial performance.
- Customizable Tools: Generate custom reports and tailor the dashboard to specific administrative needs.
Design Highlights:
- Clean and organized UI to enhance productivity.
- Interactive dashboards for data visualization.
- Responsive design for use across multiple devices.
- Prioritized usability for quick navigation and task execution.
HealNow's Management Dashboard ensures administrators can maintain efficiency, track performance, and foster a supportive environment for therapists and patients. It’s the ultimate solution for running a seamless therapy platform.

Reviews
6 reviews

Super robust work done.
Everything looks consistent and well put together, thanks to the use of a design system.
I will maybe work slightly on the shadows and the main green background lighted to white a bit so it gives an even cleaner look.
Also wondering what the hamburger menu does since there is a sidebar.
Overall, great work done!

Great job on the HealNow dashboard! It’s clean, easy to use, and does a good job organizing everything for admins. The interactive charts and responsive design are great, and the layout makes it easy to navigate.
A few things to work on: The flow between some sections could be smoother, especially between "Survey Management" and "Activity Monitoring." Also, adjusting the font sizes would help with readability. Some areas could use better text contrast, too. Adding some simple interactions, like hover effects or loading indicators, would make it feel more interactive.
Try getting feedback from real users to see if any part is confusing. Also, a quick summary of key stats at the top of the dashboard could be useful. Overall, it’s looking great, just a few tweaks to make it even better. Keep it up!

The design feels cohesive and well-structured, with clear attention to detail, thanks to the use of a design system
Overall, an excellent effort with impressive results!

Well done!
Your work looks fantastic and demonstrates great effort.
To further enhance your design, I’d like to suggest a quick win to improve accessibility:
Consider using an accessibility checker plugin in Figma, such as "Contrast Checker," to evaluate the color contrast in your design. Ensuring sufficient contrast not only makes your design more inclusive but also aligns with accessibility best practices. Alternatively, you can explore a variety of online tools by searching for "color contrast checker."
This small adjustment can make a significant difference in creating a more user-friendly and accessible experience.
Keep up the excellent work!

Hey, MD!
I just reviewed your dashboard design in Figma, and I must say, the user flow and your overall approach are really impressive. The screens look fantastic! I've added a few recommendations directly in your Figma file for your reference.

Great job ! Keep going
You might also like
SiteScope - Progress Tracking App

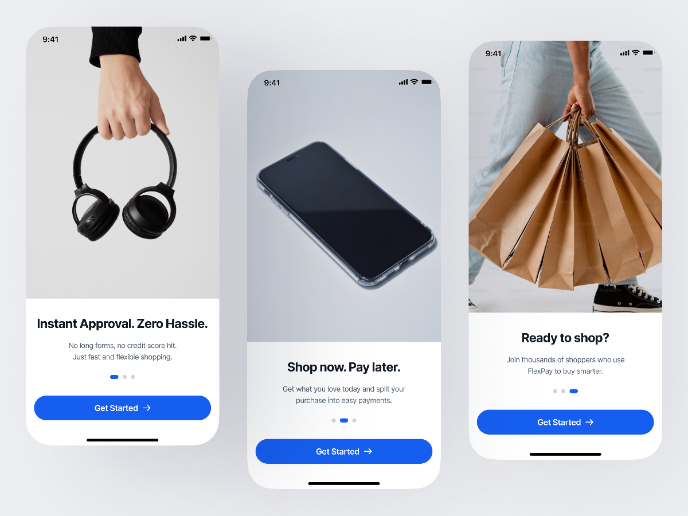
FlexPay

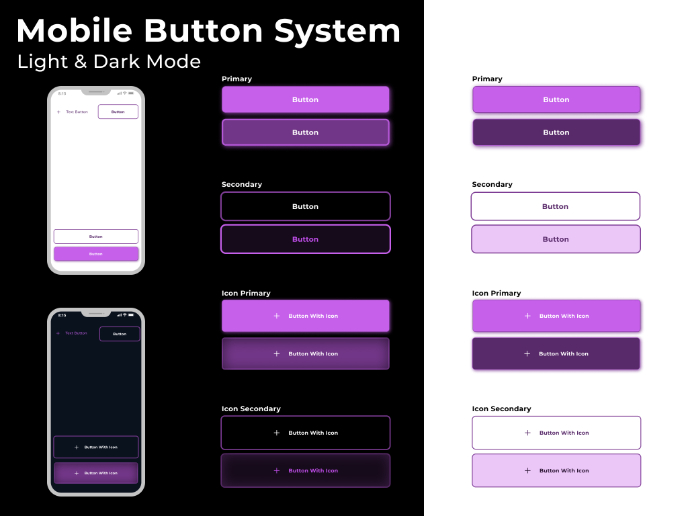
Mobile Button System


CJM for Co-Working Space - WeWork

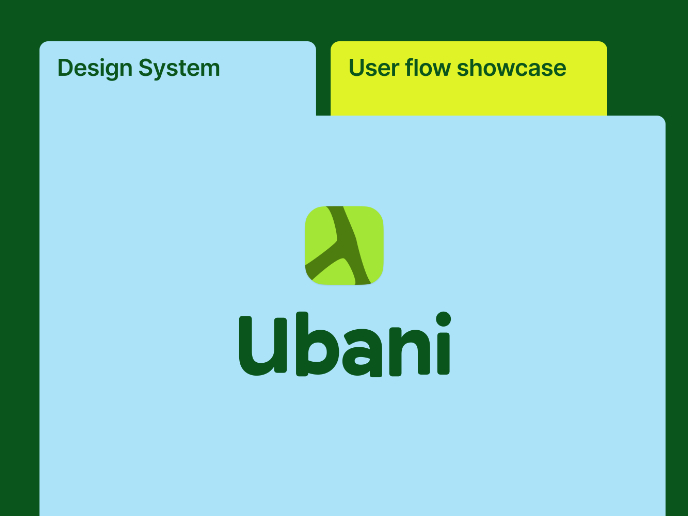
Ubani Design System

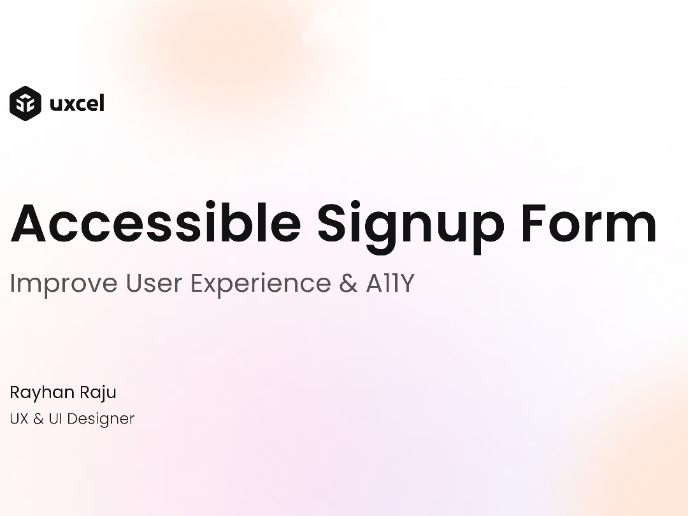
Accessible Signup Form for SaaS Platform
Visual Design Courses

UX Design Foundations


Introduction to Figma

Design Terminology
