Statistical Analysis
Statistical analysis helps teams interpret product or user data by identifying trends, testing significance, and guiding data-driven decisions.


What is Statistical Analysis?
Your business decisions rely on intuition and small data samples rather than rigorous statistical evidence that could reveal patterns and relationships that improve product strategy and user understanding with confidence.
Most teams collect data but lack statistical analysis skills to extract reliable insights, missing opportunities to validate assumptions scientifically and make evidence-based decisions that reduce risk and improve outcomes.
Statistical analysis is the systematic application of statistical methods to examine data patterns, test hypotheses, and draw reliable conclusions about user behavior, business performance, and product effectiveness through mathematical techniques that account for uncertainty and variability.
Teams using effective statistical analysis achieve 40% more accurate predictions, 55% better decision confidence, and significantly improved business outcomes because choices are based on statistical evidence rather than assumptions or incomplete data interpretation.
Think about how companies like Google use statistical analysis to evaluate search algorithm changes through controlled experiments that measure user satisfaction improvements, or how pharmaceutical companies use statistical methods to validate drug effectiveness through clinical trial analysis.
Why Statistical Analysis Matters for Evidence-Based Decisions
Your product and business decisions lack statistical foundation because you can't distinguish between meaningful patterns and random variation, leading to choices based on misleading data interpretations that don't reflect actual user behavior or business reality.
The cost of lacking statistical analysis capabilities compounds through every decision that could benefit from rigorous evidence evaluation. You make strategic choices based on incomplete data analysis, miss optimization opportunities that statistical testing could identify, and compete without understanding performance drivers scientifically.
What effective statistical analysis delivers:
More reliable business insights because statistical methods distinguish between meaningful patterns and random variation that might otherwise lead to incorrect conclusions about user behavior or business performance.
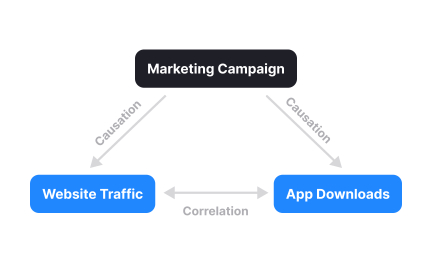
When you apply statistical rigor, data analysis reveals genuine relationships rather than misleading correlations that don't represent actual causation or predictive patterns.
Higher decision confidence through statistical significance testing that provides mathematical confidence levels about whether observed differences and relationships are likely to persist or represent temporary fluctuations.
Better experiment design and interpretation because statistical knowledge enables proper A/B testing, sample size calculation, and result interpretation that generates actionable insights rather than ambiguous findings.
Enhanced competitive advantage through statistical modeling and prediction that anticipates market changes and user behavior patterns more accurately than intuition-based decision making.
Improved risk assessment and uncertainty management as statistical analysis quantifies confidence intervals and prediction accuracy that inform strategic choices about resource allocation and market positioning.
Advanced Statistical Analysis Strategies
Once you've established basic statistical analysis capabilities, implement sophisticated statistical modeling and business application approaches.
Multivariate Analysis and Advanced Modeling: Use regression analysis, factor analysis, and machine learning techniques that analyze complex relationships between multiple variables simultaneously.
Bayesian Statistics and Uncertainty Quantification: Apply Bayesian methods that incorporate prior knowledge and provide more nuanced uncertainty assessment than traditional statistical approaches.
Time Series Analysis and Forecasting: Develop capabilities in analyzing temporal data patterns and creating statistical forecasts that inform strategic planning and resource allocation.
Experimental Design and Causal Inference: Master advanced experiment design principles that enable causal conclusion rather than just correlation identification through statistical analysis.
Statistics is a branch of mathematics that involves collecting, analyzing, interpreting, presenting, and organizing numerical data. It provides methods and techniques for summarizing and understanding complex data sets to extract meaningful insights and draw conclusions.
Statistics play a significant role in design by providing insights and data-driven information that inform decision-making and improve the effectiveness of design solutions. Designers use statistics to analyze user behavior, conduct user research, evaluate design performance, and make informed design decisions based on empirical evidence.
In design, several statistical methods are employed to analyze data and extract meaningful insights. Some common methods include:
- Descriptive statistics: These methods summarize and describe data, such as calculating measures of central tendency (mean, median, mode), dispersion (range, standard deviation), and visualizing data through charts, graphs, or histograms.
- Inferential statistics: These methods involve making inferences or predictions about a population based on a sample. Techniques such as hypothesis testing, confidence intervals, and regression analysis are used to draw conclusions and make statistically significant statements about the data.
- A/B testing: A/B testing is a statistical method widely used in design to compare and evaluate the performance of two or more design variations. By measuring user behavior and preferences, designers can determine the most effective design solution based on statistically significant results.
Statistics provide designers with objective insights and evidence to support design decisions. Here are a few ways statistics can enhance design outcomes:
- User research: Statistics help designers gain a deeper understanding of user behavior, preferences, and needs through quantitative data analysis. By collecting and analyzing data on user interactions, designers can uncover patterns, trends, and areas for improvement in the design.
- Data-driven decision-making: By using statistical analysis, designers can make informed decisions backed by empirical evidence rather than relying solely on intuition or subjective opinions. This leads to more effective design choices that are based on data and align with user expectations and goals.
- Evaluation and optimization: Statistics enable designers to evaluate the effectiveness of design solutions by measuring key performance metrics. This helps identify areas for improvement, validate design hypotheses, and optimize designs for better user experiences.
Recommended resources
Courses

Business & Technical Fundamentals for PMs


UX Research


Product Analytics

Lessons

Finding AI Opportunities

Automation vs. Augmentation Decisions

Digging into Data
Exercises
Projects

ClearSpend - Budget Flow


MedPal - Medication Reminder