Analytics Tools
Analytics tools help UX and product teams collect, visualize, and interpret user data to evaluate behavior and improve digital experiences.


What are Analytics Tools?
Analytics tools collect and analyze data about how people use websites, mobile apps, and digital products. These platforms track user behavior, measure performance, and transform raw numbers into insights that help businesses make better decisions.
The analytics landscape includes web analytics (Google Analytics), product analytics (Mixpanel, Amplitude), business intelligence (Tableau, Power BI), marketing analytics (HubSpot), and specialized tools for specific use cases like heatmaps or social media measurement.
Analytics Tool Categories and Business Applications
Web analytics platforms
Track website visitor behavior, traffic sources, conversion paths, and content performance. Google Analytics, Adobe Analytics, and Matomo provide comprehensive website measurement with varying levels of sophistication.
Product analytics solutions
Analyze in-app behavior, feature adoption rates, user journey mapping, and retention patterns. Mixpanel, Amplitude, and Heap specialize in detailed product usage tracking and optimization insights.
Business intelligence systems
Combine data from multiple sources into executive dashboards, financial reports, and strategic analysis. Tableau, Looker, and Power BI transform raw information into visual insights for decision-making.
Marketing analytics platforms
Measure campaign performance, customer acquisition costs, lifetime value, and attribution across channels. HubSpot, Marketo, and Salesforce provide marketing-focused measurement and optimization capabilities.
Specialized measurement tools
Address specific needs like user experience analysis (Hotjar, FullStory), social media performance (Sprout Social), email marketing effectiveness (Mailchimp Analytics), or customer feedback collection.
How Product Teams Use Analytics Daily
Feature adoption analysis
Track how users interact with new functionality to separate successful features from those needing improvement. Slack discovered through analytics that only 10% of users found their search feature, leading to interface changes that boosted usage to 60%.
User journey optimization
Analyze conversion funnels to identify drop-off points and optimization opportunities. Airbnb found 40% of potential hosts quit during photo upload, prompting workflow improvements that increased completed listings 25%.
Behavioral cohort analysis
Compare user groups over time to understand retention patterns, feature impact, and lifecycle progression. Spotify uses cohort analysis to predict subscription cancellation and implement retention strategies before users churn.
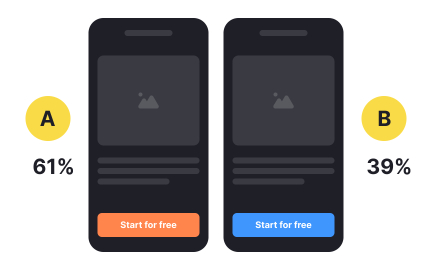
Experiment measurement and validation
Support A/B testing programs with statistical significance testing and comprehensive impact analysis. Amazon attributes billions in additional revenue to systematic experimentation guided by robust analytics measurement.
Recommended resources
Courses

Human-Centered AI


KPIs & OKRs for Products


Reducing User Churn

Lessons

Intro to UI Cursors

Basics of HTML Attributes