Analytics Dashboard for Runners 📲
RunStats is a fitness companion for runners, offering a user-friendly dashboard to track and analyze health data for workouts/runs.
Reviews
3 reviews
Fantastic work on the design brief! I commend you on being experimental with this incorporating the skeuomorphic elements, also the scannable data points are impressive 🌟
Some ways we could explore to enhance even more:
- Alignment & Spacing: Is it possible to give the day and time title a little more breathing room?
- Widget Clarity: The last two widgets may need clearer communication. Consider revising titles and data points for intuitive understanding.
- Design Cohesion: I love skeuomorphism — explore adjustments to the bottom bar to unify the design.
- Color & Excitement: A splash of color could elevate the visual excitement!
- Stakeholder Engagement: Prototypes can bridge perception gaps—highly beneficial for communicating your work.
I would have loved to have read some more information on your design choices and approach, you did a nice job. Keep up the good work! 🚀
You've done a great job of containing a lot of information into a small space. The charts and labels are clear and easy to read. I think a little extra design and colour will really help bring this alive – you've got the framework here so well done. I think it would be worth adding labels to the icons on the bottom nav to make it clear where the user will go.
The overall aesthetic is modern. The use of white space helps in focusing attention on the key data points, and the graphs offer a quick, visual take on the progress.
And here is my suggestions:
- While the monochrome palette is sleek, using subtle color accents could help important data stand out more and guide the user’s eye to the most important information or actionable items.
- It's important to present data succinctly, but there could be an opportunity to prioritize which metrics need to be displayed prominently and which could be accessed through a secondary view, reducing cognitive load.
You might also like
Customer Journey Map for a Co-Working Space
Reimagining Asana's Color System

Responsive Main Screen

Latios - Free Portfolio Template for UX/UI Designers
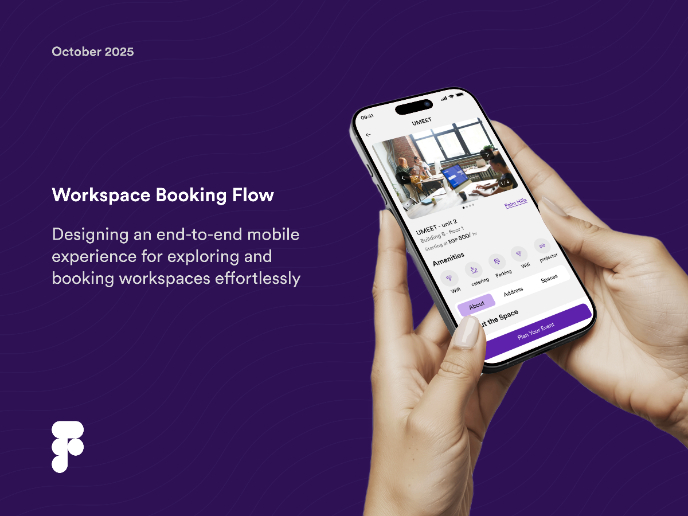
Workspace Booking Flow - UI/UX Design
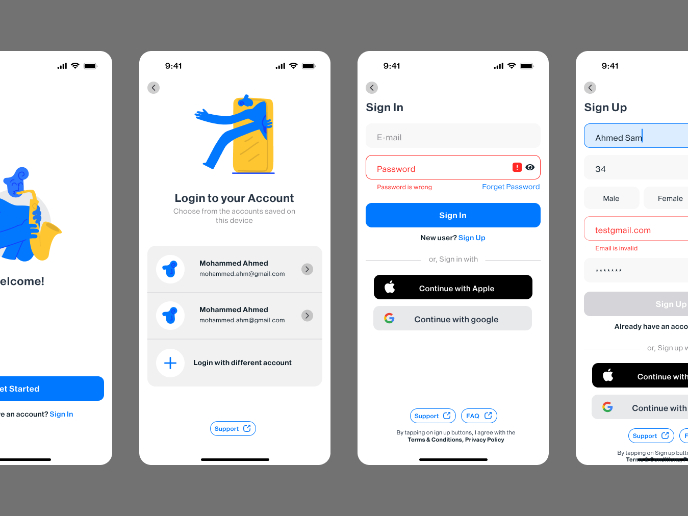
Login/Sign up Form
Visual Design Courses

UX Design Foundations

Introduction to Figma


