Product Metrics & KPIs
Transform product hunches into measurable outcomes by selecting and tracking the metrics that matter most to your business goals
Product metrics and KPIs transform gut feelings into data-driven decisions. Metrics tell the story of your product's health through numbers: user engagement, revenue growth, churn rates, and customer satisfaction scores. KPIs narrow this focus to the vital signs that directly connect to business objectives. A subscription product might track monthly recurring revenue and customer acquisition cost, while a marketplace focuses on transaction volume and seller liquidity. The art lies in choosing metrics that drive meaningful action rather than vanity numbers.
Too many metrics create noise; too few leave blind spots. Successful product managers build measurement frameworks that balance leading indicators (predictive) with lagging indicators (results), operational metrics with strategic ones. They understand that metrics without context mislead, that correlation isn't causation, and that the best metric is one the entire team rallies around.
A North Star metric is the single measurement that best captures the core value your product delivers to customers. For Spotify, it's time spent listening. For Airbnb, it's nights booked. For Slack, it's messages sent within teams.
The best North Star metrics balance customer value with business growth.[1] They're leading indicators that predict long-term success, not just short-term wins. A good North Star metric should be simple to understand, measurable daily, and directly influenced by product changes.
Choosing the wrong North Star can misguide your entire product strategy. Facebook famously shifted from "time spent" to "meaningful social interactions" when they realized endless scrolling wasn't creating value. Your North Star should reflect what makes customers genuinely successful with your product.
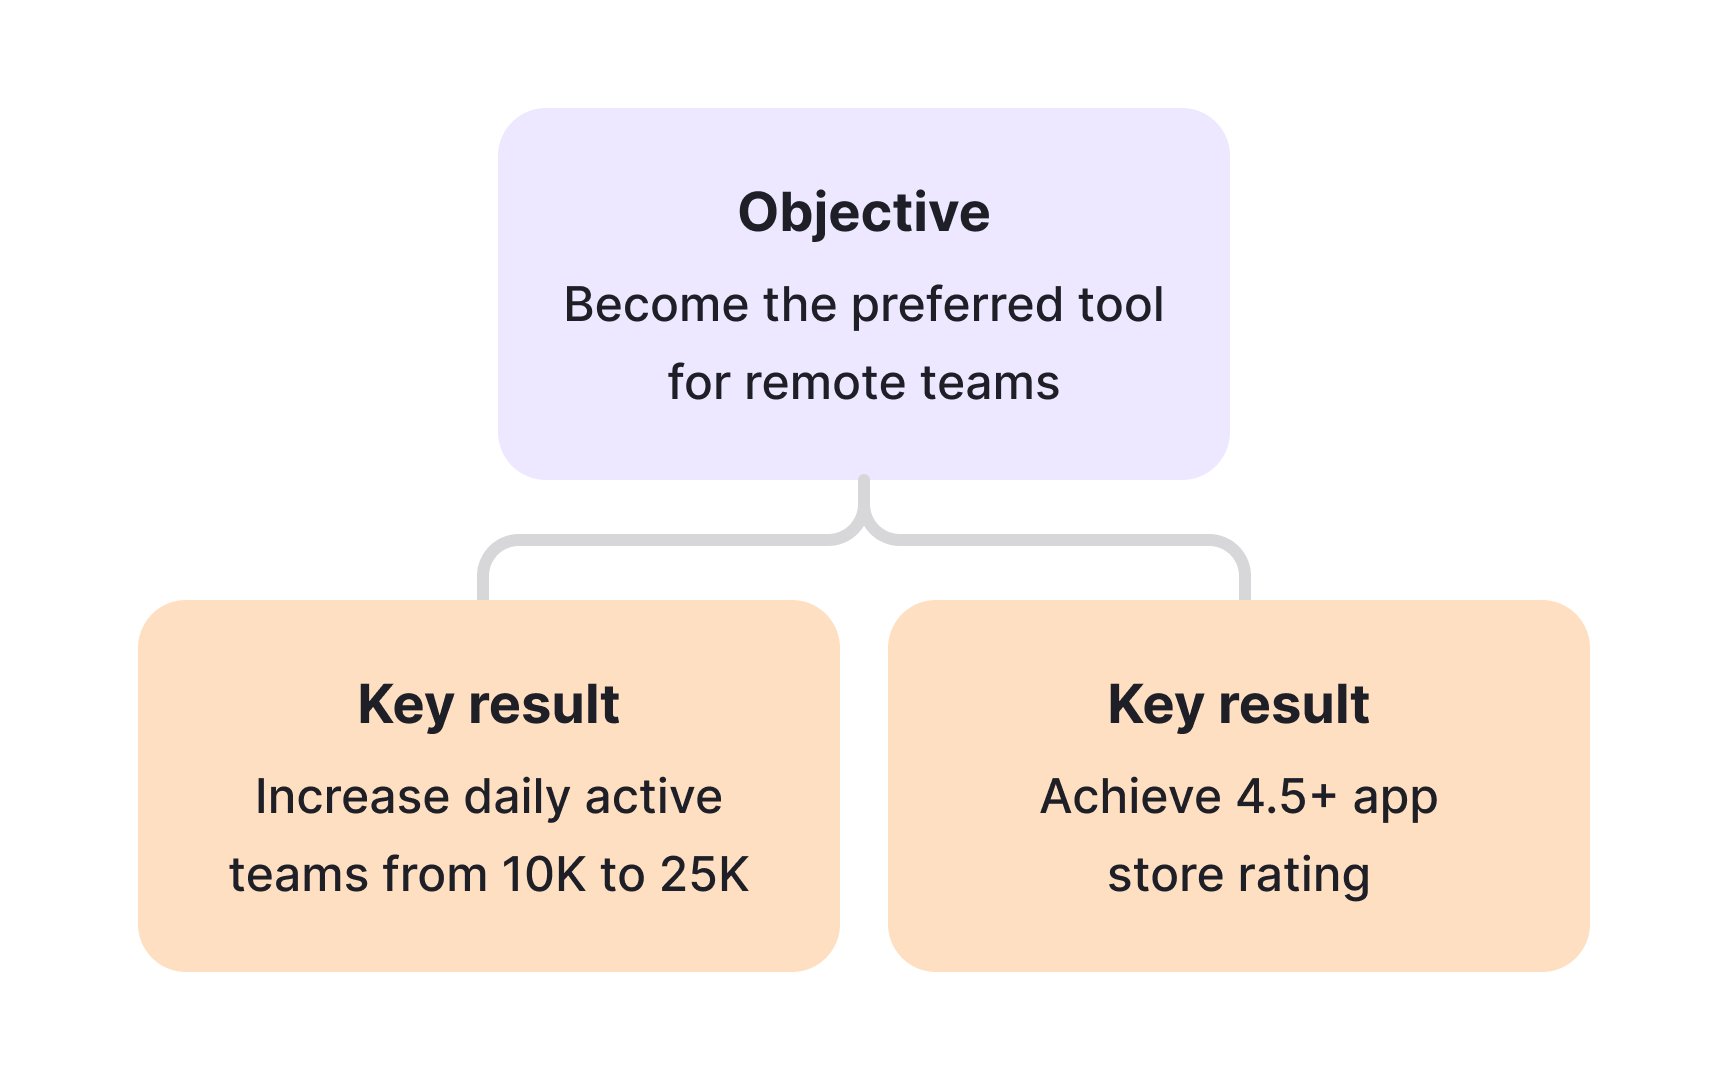
Objectives and Key Results (OKRs) align teams around measurable user outcomes instead of feature lists. The objective states your ambitious goal: "Become the preferred tool for remote teams." Key results measure success: "Increase daily active teams from 10K to 25K" or "Achieve 4.5+ app store rating."
Good OKRs focus on outcomes, not outputs. "Launch video calling" is an output. "Increase team collaboration sessions by 40%" is an outcome. This shift keeps teams flexible about solutions while committed to results. Google aims for 70% OKR achievement - 100% means you're not ambitious enough.
Product OKRs should ladder up to company goals while staying within team control. If the company objective is "Expand internationally," product might target "Support 5 new languages with 80%+ user satisfaction." Quarterly cycles work best for product teams to balance ambition with adaptability.
User engagement metrics reveal how actively people interact with your product. Common measures include daily active users (DAU), monthly active users (MAU), weekly active users (WAU), and the stickiness ratio (DAU/MAU). These numbers tell you if users find ongoing value or just try once and leave.
Engagement goes deeper than login counts. Track meaningful actions relevant to your product, like posts created, items purchased, or videos watched. LinkedIn measures profile views and connection requests. TikTok watches video completion rates and shares. Choose actions that indicate real value exchange.
Context matters when interpreting engagement. A meditation app with 10 minutes daily use might be healthier than a social app with 3 hours. Quality beats quantity when the goal is user success, not addiction.
Retention measures how many users stick around over time. Its evil twin,
Calculate retention cohorts by grouping users who started in the same period. Track Day 1, Day 7, Day 30 retention to spot drop-off patterns. B2B products might measure monthly or annual retention. Consumer apps often focus on daily and weekly rates.
Improving retention beats acquiring new users for sustainable growth. It costs 5-25x more to acquire a customer than to retain one.[3] Small retention improvements compound into massive long-term gains. Focus on the "aha moment" that hooks users early.
Feature adoption reveals which parts of your product users actually value. Track both breadth (how many try it) and depth (how often they use it). Low adoption might mean poor discovery, confusing design, or solving the wrong problem.
Measure adoption funnels from awareness to regular use. How many users see the feature? Click on it? Complete first use? Return to use it again? Each step reveals optimization opportunities.
Set adoption targets before launching features. Industry benchmarks suggest 20-30% adoption for major features is good.[4] But context matters - a power-user feature might succeed at 5% if those users are highly engaged.
Conversion funnels show the steps users take from first interest to completing an action. In e-commerce, this could be moving from browsing to purchasing. In SaaS, it might be going from trial to paid
The most effective way to improve conversion is to fix the weakest step first. For instance, adding more payment options could increase checkout completion more than attracting more visitors to a funnel that already leaks. Even small gains matter. If each step improves by just 10%, the combined effect can double the overall conversion rate.
Cohort analysis groups users who share a common characteristic, typically when they first used your product. This reveals patterns that averages hide. January users might retain better than July users due to product improvements or seasonal factors. Additionally, tracking users by other characteristics like feature usage, plan type, or acquisition channel, can reveal which features create the most or least value and which cohorts have found product-market fit while others haven’t.
Track how each cohort's behavior changes over time. Do users who joined during a promotion
Compare cohorts to measure progress. If September cohorts retain 10% better than January cohorts at the same age, you're improving. This method isolates product improvements from user mix changes or seasonal effects.
Good metric targets balance ambition with achievability. Use historical data, industry benchmarks, and business needs to set goals. A 10% improvement might be aggressive for
Work backwards from business objectives. If you need 50%
Avoid arbitrary round numbers. "Increase DAU by 23%" based on analysis beats "double users" based on optimism. Document assumptions behind targets so you can learn when reality differs. Missing reasonable targets teaches more than hitting random ones.
References
- The Value of Keeping the Right Customers | Harvard Business Review
Topics
From Course

Share


Similar lessons

Introduction to Churn Metrics and Analysis

Common Causes of Customer Churn
