Introduction to Churn Metrics and Analysis
Learn the essential metrics for understanding and reducing customer churn
Churn metrics are crucial for understanding how customer loss impacts business performance. This lesson covers the key metrics used to analyze churn, such as churn rate, customer retention, and customer lifetime value (CLTV). Understanding the distinction between voluntary and involuntary churn helps businesses identify why customers leave and what actions can be taken to prevent it.
By analyzing churn over time through cohort retention and feedback loops, businesses can gain insights into customer behavior and improve retention strategies. Additionally, the relationship between churn and retention is explored, highlighting how focusing on retaining customers can directly reduce churn and enhance long-term customer value.
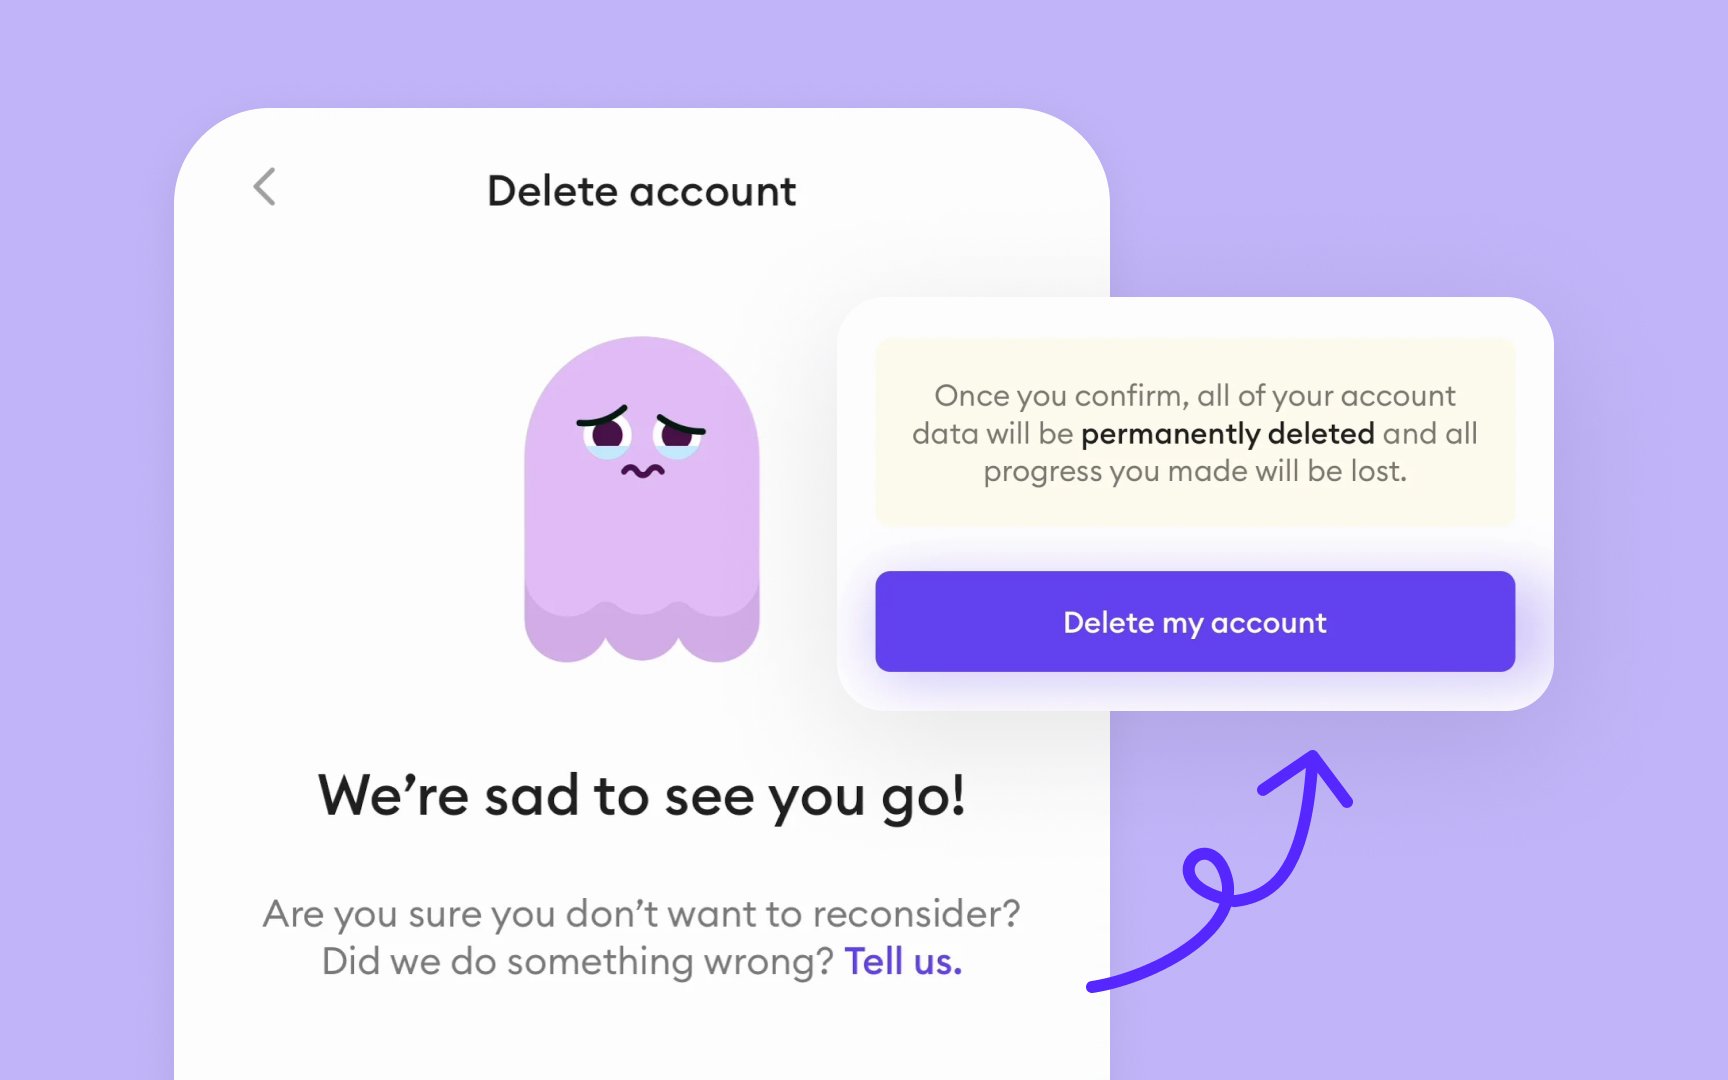
To reduce churn, businesses first need to understand why customers leave. They do this by gathering feedback directly from customers, analyzing how people use their product, and studying responses from exit surveys.
Pro Tip: Start by calculating your churn rate monthly to track how effectively you are retaining customers.
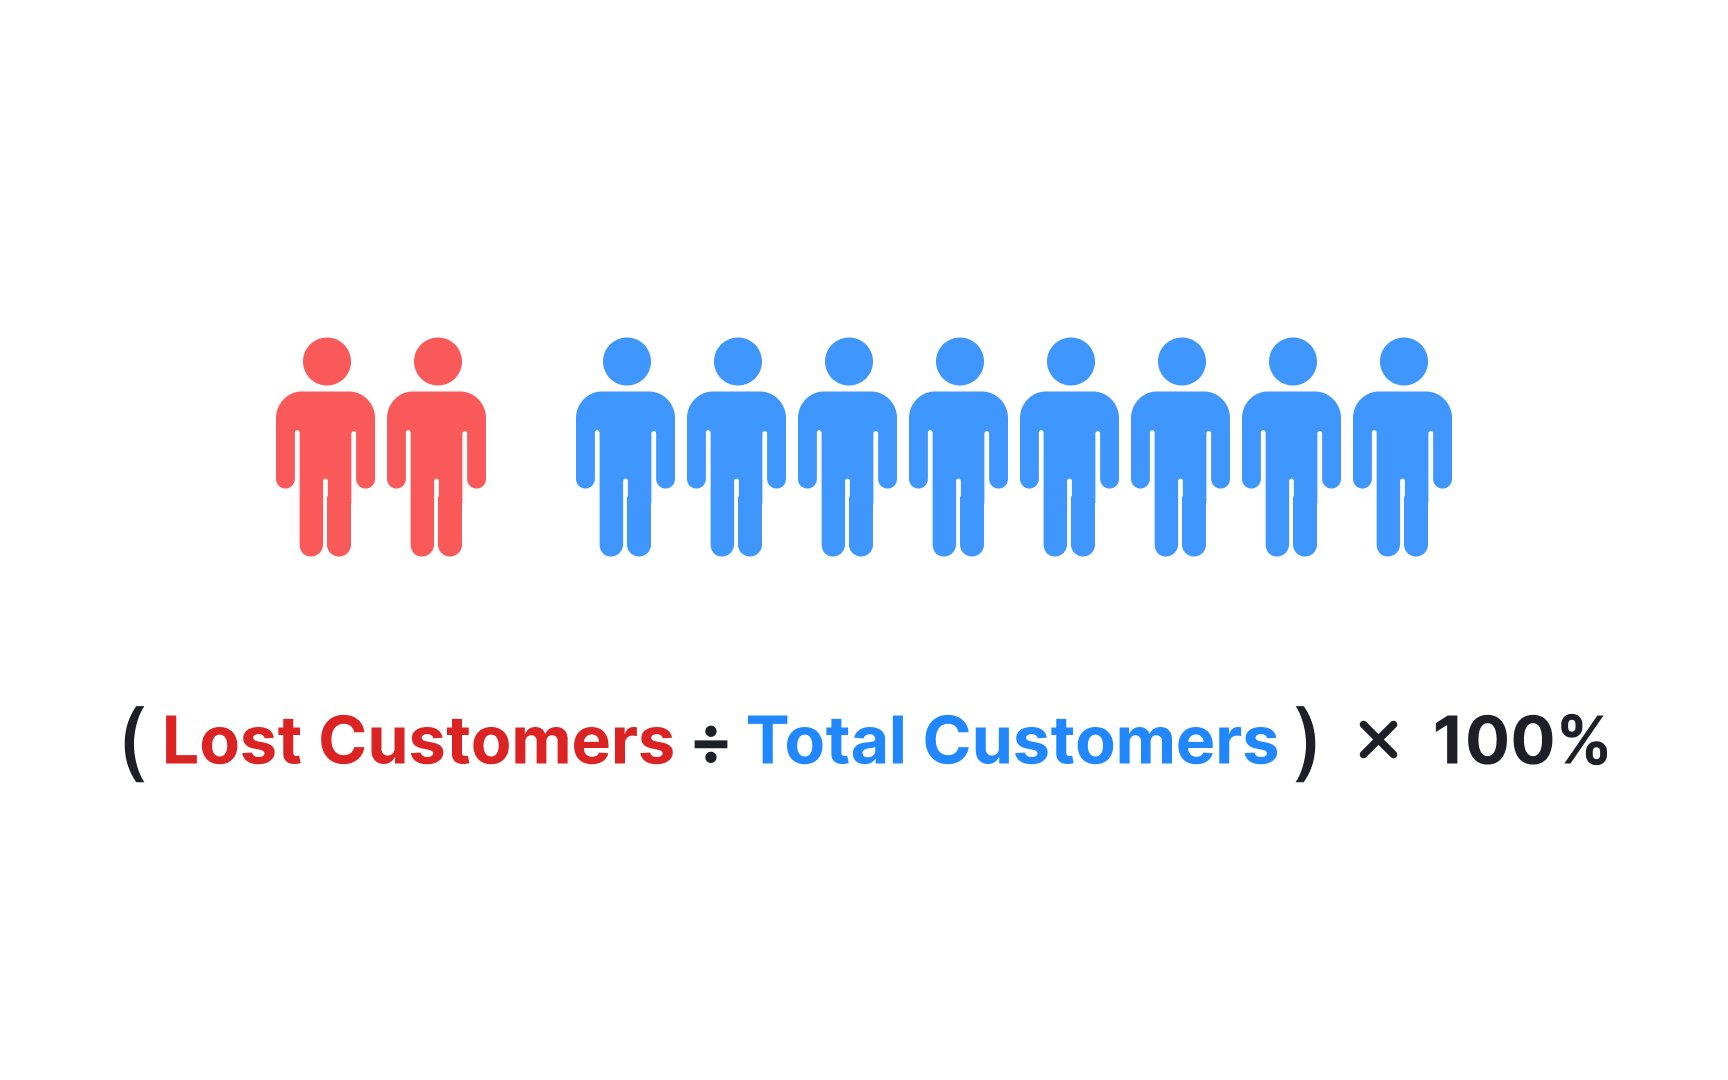
The
However, it's not just about calculating the rate; you also need to understand it. A high churn rate can indicate problems like poor customer satisfaction, weak onboarding, or product issues, while a low churn rate reflects good
Tracking churn rates over time is equally important. If your churn rate rises over several months, it could point to customer experience or product problems. A declining churn rate may show that improvements in service, product quality, or onboarding are working.
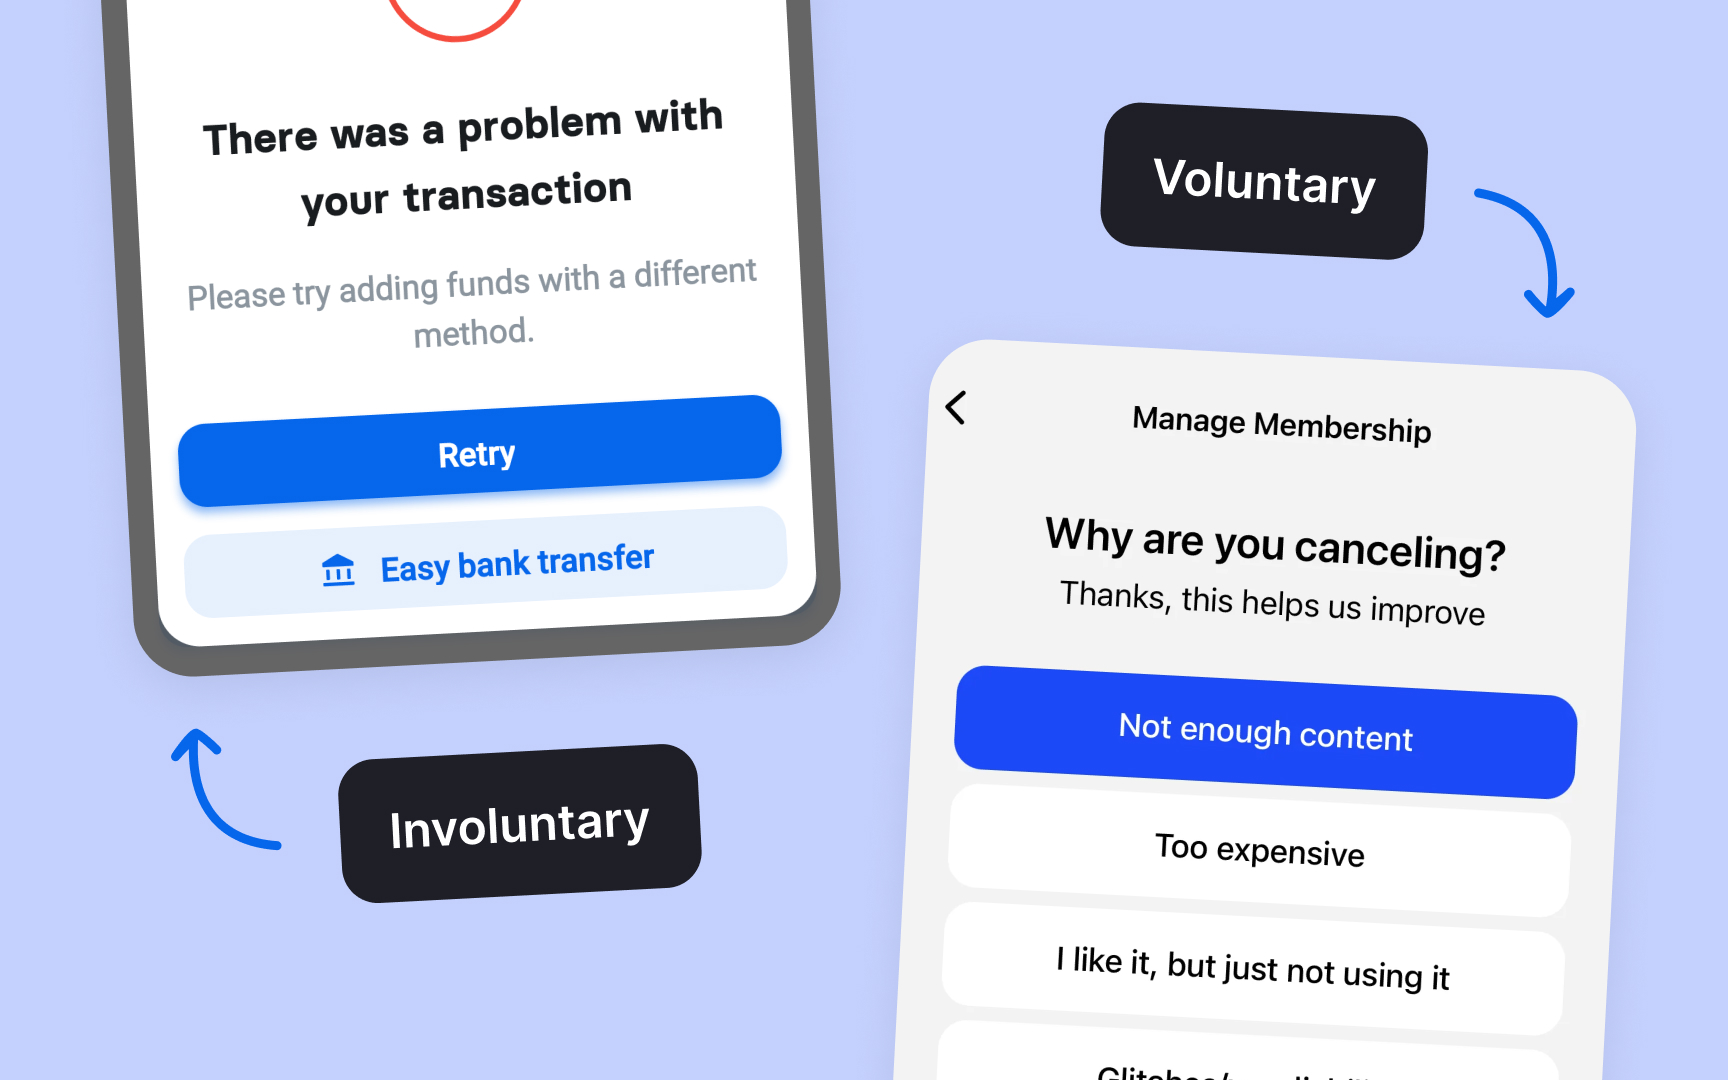
- Voluntary churn happens when customers actively choose to leave a product or service. This usually occurs due to dissatisfaction, a poor
customer experience , finding a better alternative, or a mismatch between the product and the customer’s needs. - Involuntary churn occurs when customers are lost due to reasons beyond their control. For example, payment failures, expired credit cards, or technical issues that prevent customers from renewing their
subscription can cause involuntary churn. Many times, involuntary churn can be minimized by ensuring that payment processes are smooth and automatic reminders are set for customers before payment methods expire.
While voluntary churn requires more proactive approaches, such as improving customer engagement or satisfaction, involuntary churn can often be reduced with simple operational fixes, such as improving payment systems and ensuring proper communication with customers.
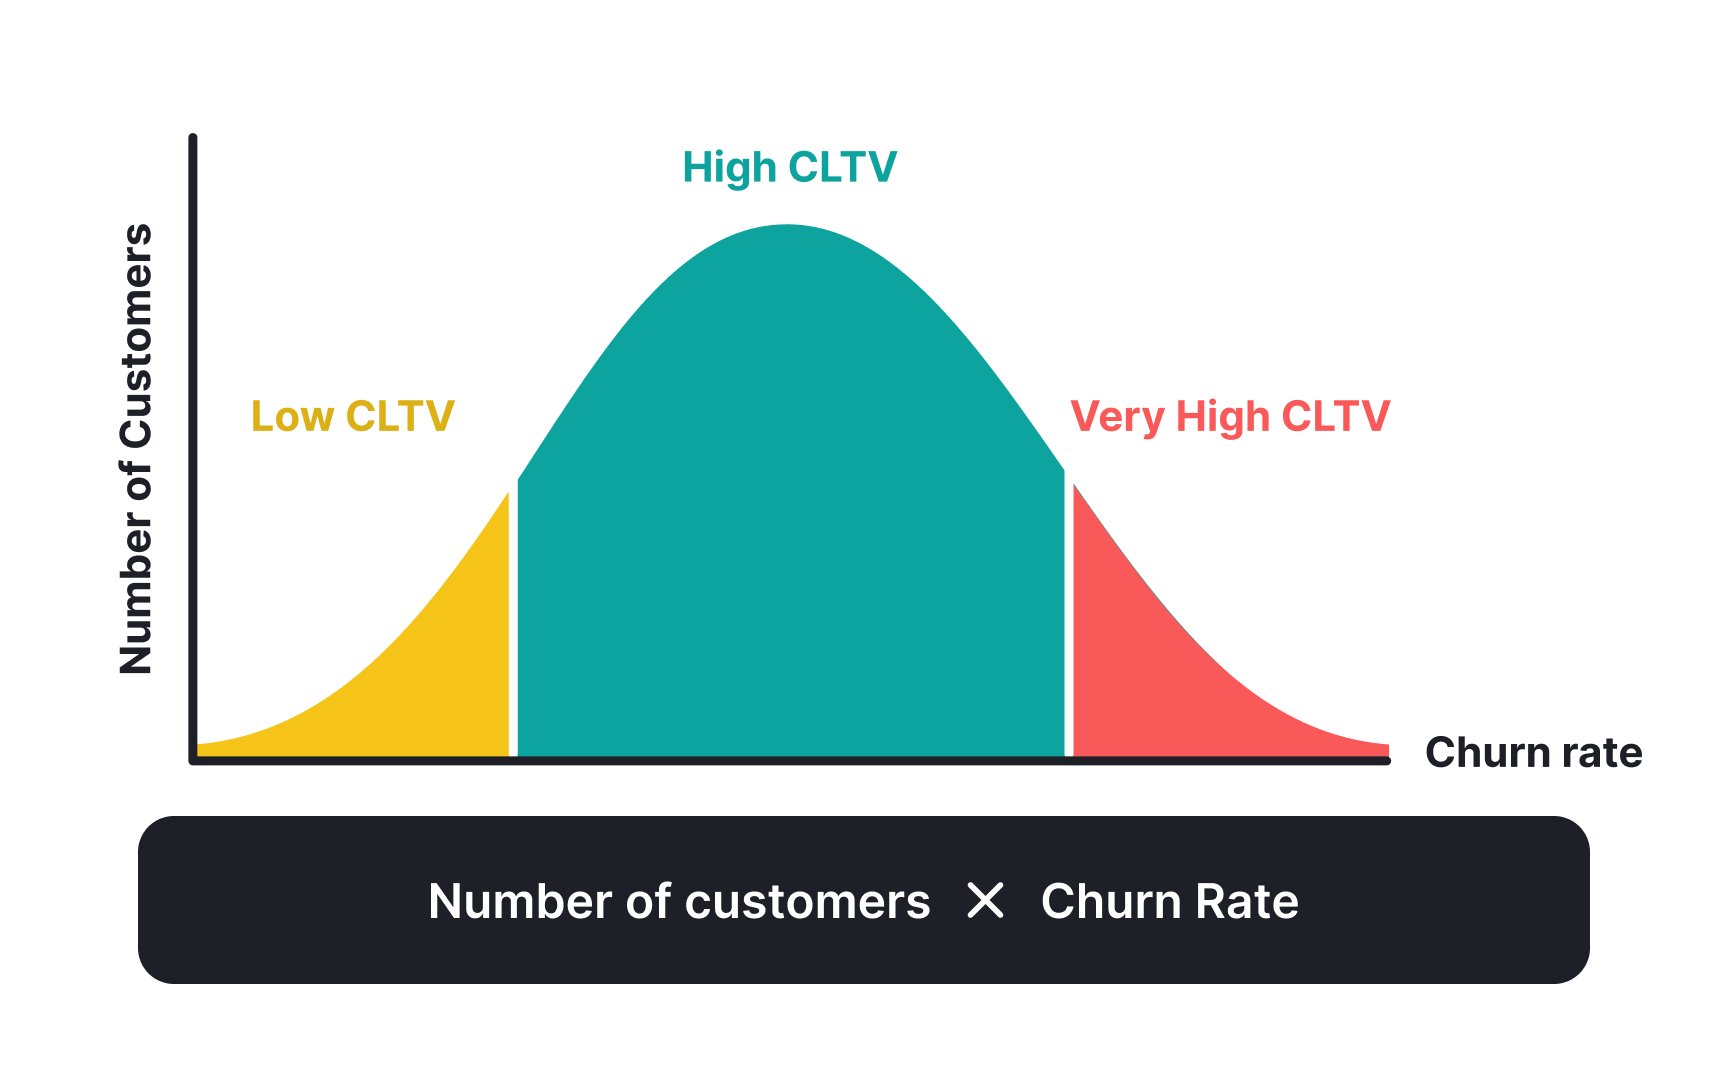
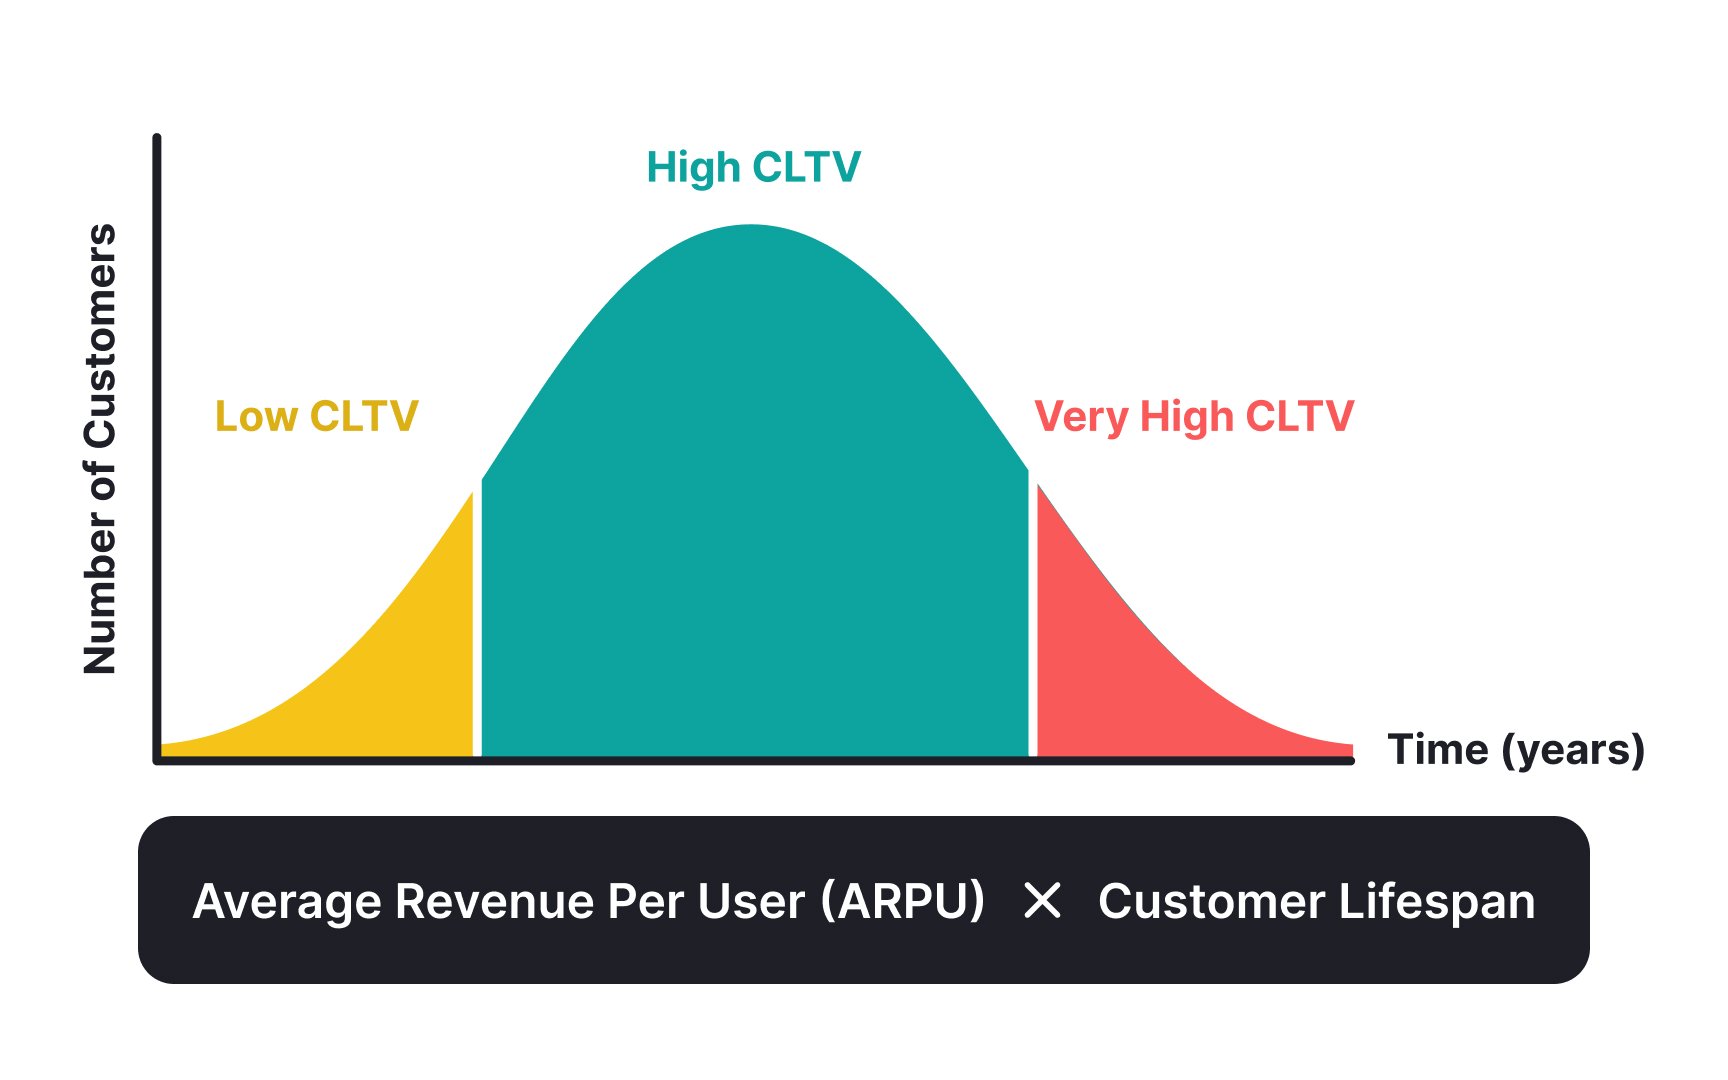
Customer lifetime value (CLTV) represents the total
CLTV is calculated by multiplying the average revenue per user (ARPU) by the customer lifespan (the average length of time a customer remains subscribed).
For example, if a customer spends $50 per month and stays subscribed for an average of 24 months, their CLTV would be $1,200. Understanding CLTV is essential for businesses to identify the balance between acquisition costs and revenue generated over time.
By improving CLTV, businesses can reduce
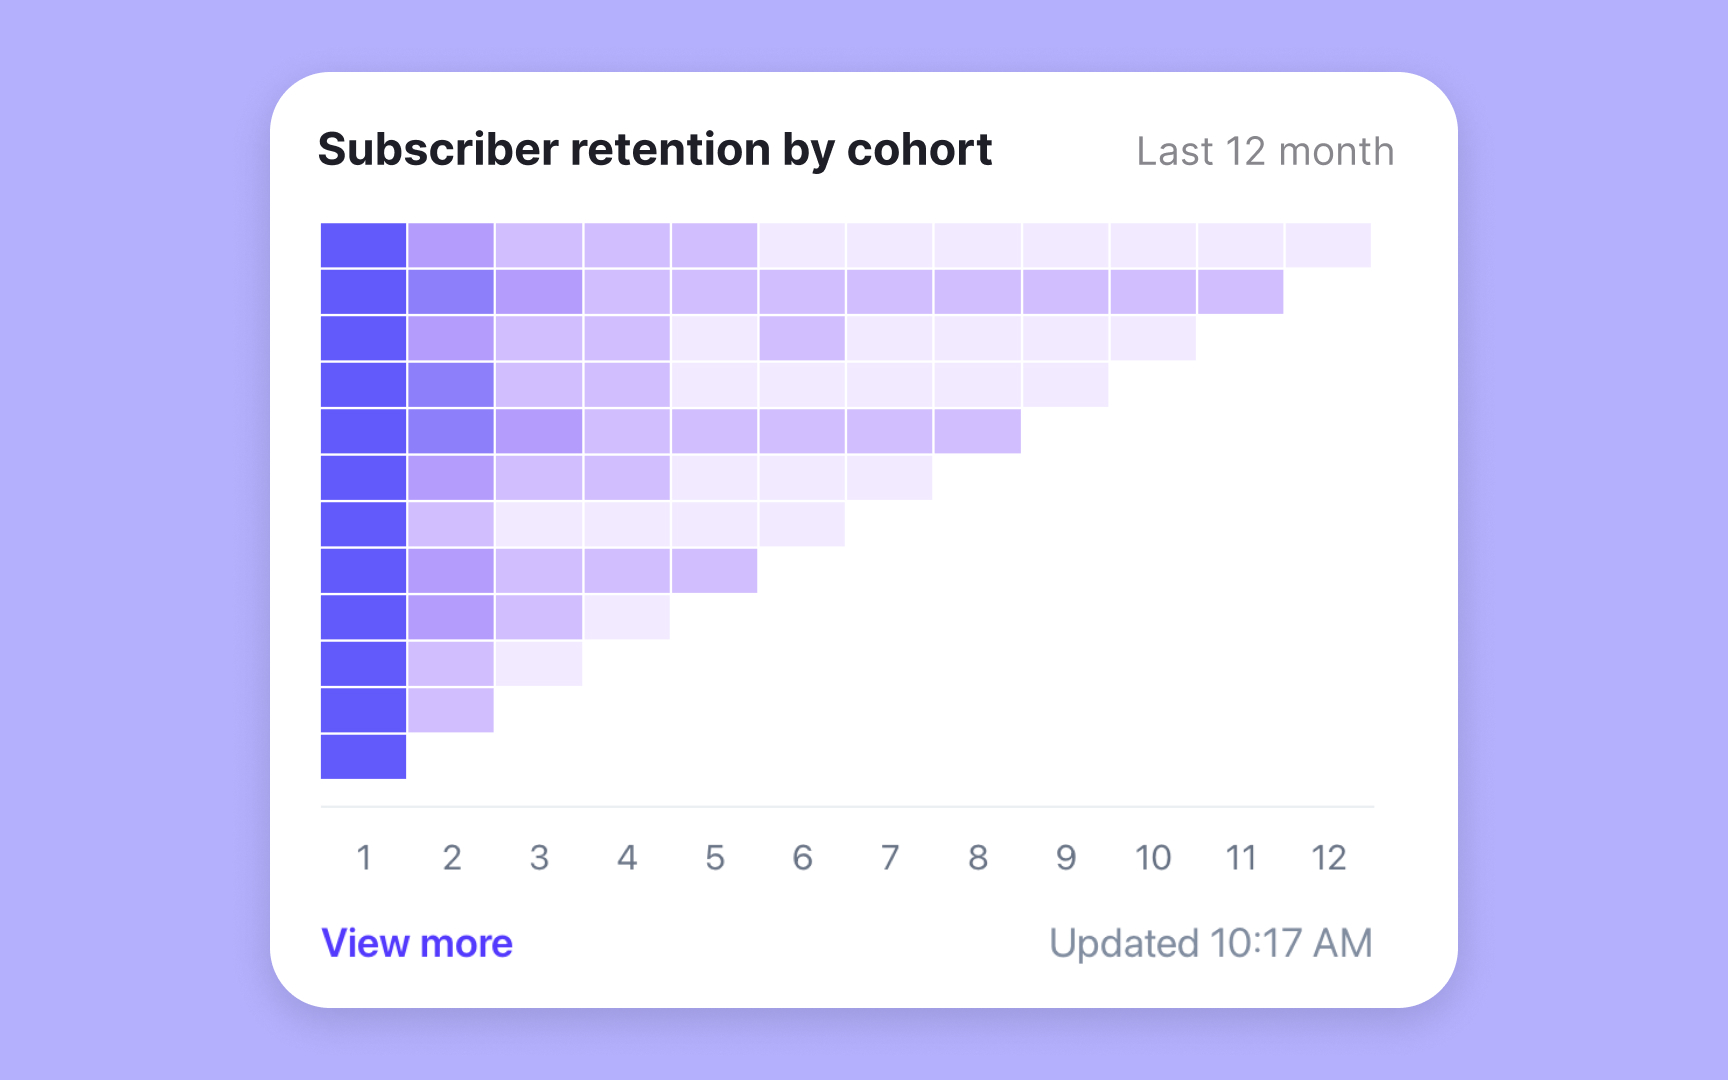
Cohort
By analyzing retention rates across different cohorts, businesses can identify patterns in customer behavior and pinpoint when and why
Cohort analysis is particularly useful for tracking the long-term impact of changes in the product or
Pro Tip: Use cohort retention analysis to identify the exact point in the customer journey where churn spikes and take targeted action to improve retention.
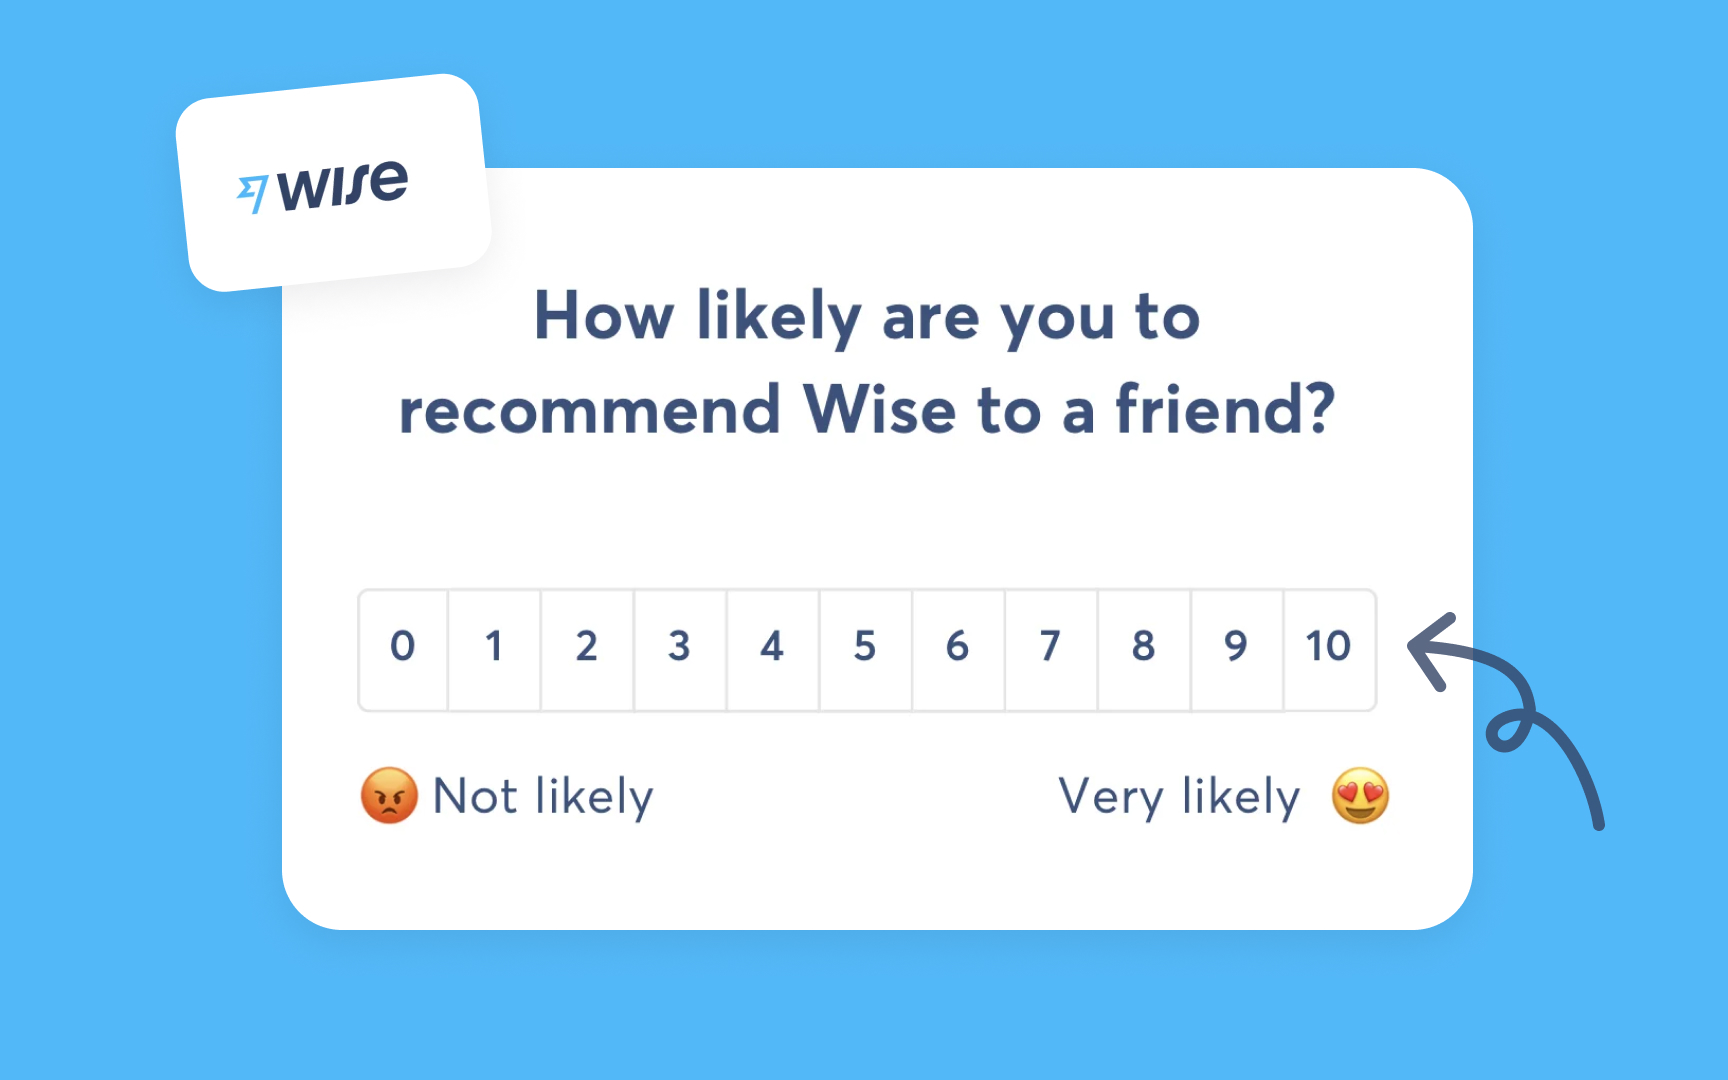
Net promoter score (NPS) is a widely used metric to gauge customer satisfaction and loyalty. It asks customers a single question: “How likely are you to recommend this product or service to a friend or colleague?” The score is measured on a scale of 0 to 10, where respondents are classified into 3 categories:
- Promoters (scores 9-10): Loyal customers who are likely to recommend the product.
- Passives (scores 7-8): Satisfied but unenthusiastic customers.
- Detractors (scores 0-6): Unhappy customers who are at risk of churning and may negatively affect the brand through word of mouth.
NPS is calculated by subtracting the percentage of detractors from the percentage of promoters. For example, if 60% of your customers are promoters and 20% are detractors, your NPS score would be 40. An NPS score between 0 and 50 is generally considered average to good, while scores below 0 may suggest significant dissatisfaction among customers. Scores above 70 are considered excellent.
To reduce
Common early warning signs include:
- Decreased usage: When a customer begins using the product or service less frequently.
- Unresolved support tickets: Customers who have ongoing issues without resolution are more likely to leave.
- Negative feedback: Low ratings, poor reviews, or dissatisfaction expressed through surveys.
- Declining engagement: Reduced interaction with emails, promotions, or other communication channels.
Customer feedback loops are critical tools for reducing
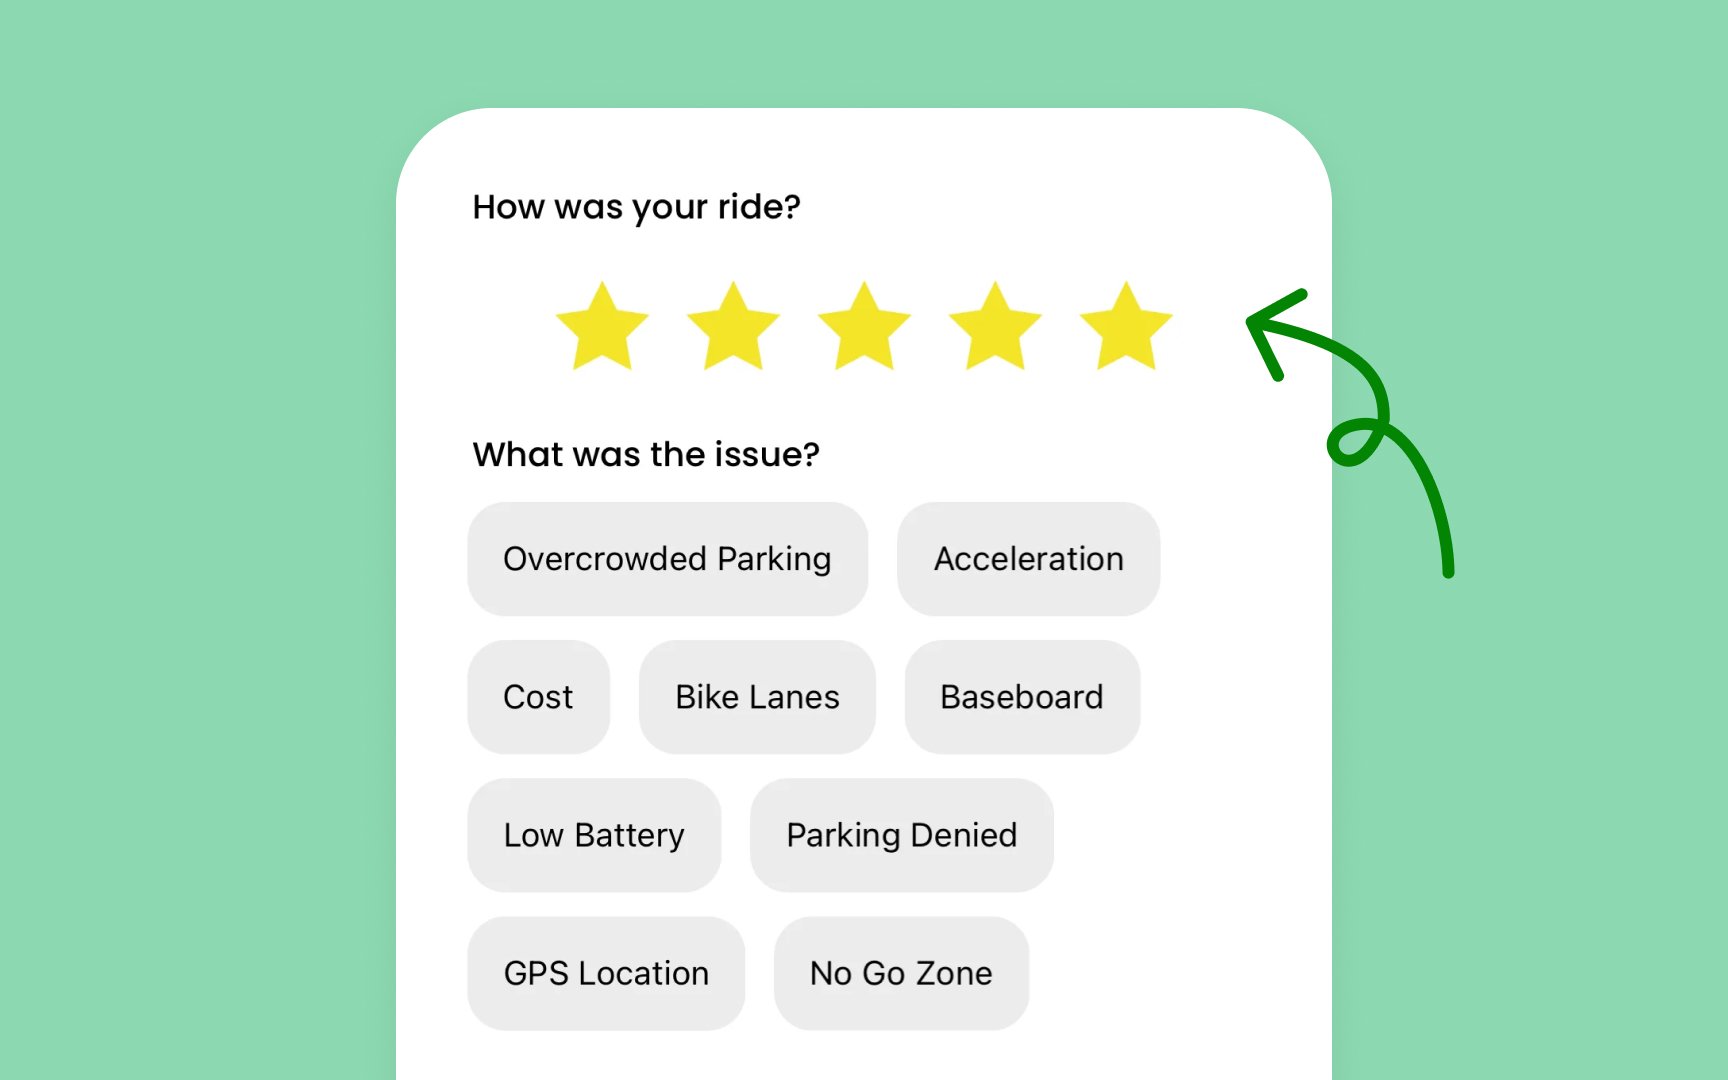
There are several types of customer feedback loops:
- Surveys and polls: These are commonly used to gauge customer satisfaction and identify areas for improvement.
- Customer support interactions: Feedback collected from support tickets can reveal patterns of dissatisfaction.
- Behavioral feedback: Monitoring user actions within the product provides indirect feedback on their experience.
Customer segmentation is a critical strategy for reducing
There are several ways to segment customers, including:
- Demographic segmentation: Grouping customers by age, location, or gender.
- Behavioral segmentation: Categorizing customers based on how they interact with the product, such as usage frequency or engagement levels.
- Value-based segmentation: Identifying high-value vs. low-value customers based on their spending or
subscription tier.
Once customers are segmented, targeted retention strategies can be developed for each group. For example, high-value customers who are disengaging might need personalized offers, while low-value customers could benefit from educational resources to increase their usage.
Monthly recurring revenue (MRR)
- Gross MRR churn refers to the total revenue lost from customers who churned or downgraded their
subscription during a given period. - Net MRR churn accounts for both the lost revenue and any additional revenue gained from existing customers who upgraded or expanded their subscriptions. As a result, net MRR churn can sometimes be lower — or even negative — if the revenue gained from upgrades exceeds the revenue lost from churned customers.
Understanding the difference between these two types of churn helps businesses assess the overall health of their recurring revenue streams. High gross MRR churn indicates significant revenue loss, while a low or negative net MRR churn shows that the business is successfully retaining and growing its customer base.
- Churn rate measures customer loss over a specific period, typically expressed as a percentage. For example, if 10 out of 100 customers leave in a month, the churn rate is 10%.
- Retention rate, on the other hand, measures how many customers continue to use the product or service over the same period. If 90 out of 100 customers remain after a month, the retention rate is 90%.
The relationship between retention and churn is inverse: a high retention rate means a low churn rate, and vice versa. By focusing on improving retention, businesses can reduce churn and increase long-term customer value. Retention strategies, such as improving customer engagement, offering personalized support, or adding value through loyalty programs, directly impact churn reduction efforts.
Pro Tip: Track both retention and churn rates to get a balanced view of customer health and focus on retention strategies to reduce churn.
Top contributors


Topics
From Course

Images provided by

Share


Similar lessons

Common Causes of Customer Churn

Segmentation and Churn Prevention Strategies
