OKRs, KPIs, and North Star Metrics
Transform business goals into measurable progress with strategic metric frameworks
Metrics are essential for product success, but they can quickly become overwhelming. OKRs help teams connect big-picture goals with concrete results, making ambitious visions achievable. KPIs act as your product's vital signs, showing what's healthy and what needs attention. North Star Metrics cut through complexity by focusing everyone on the single measurement that matters most. Many teams struggle when they use these frameworks incorrectly: tracking too many metrics, choosing the wrong ones, or failing to connect data to decisions.
The real magic happens when these approaches work together: your North Star points the direction, OKRs create the roadmap, and KPIs confirm you're on the right path. Understanding the strengths and limitations of each framework helps transform confusing data into clear guidance. When implemented thoughtfully, these complementary tools help teams make confident decisions that actually move the needle on what matters.
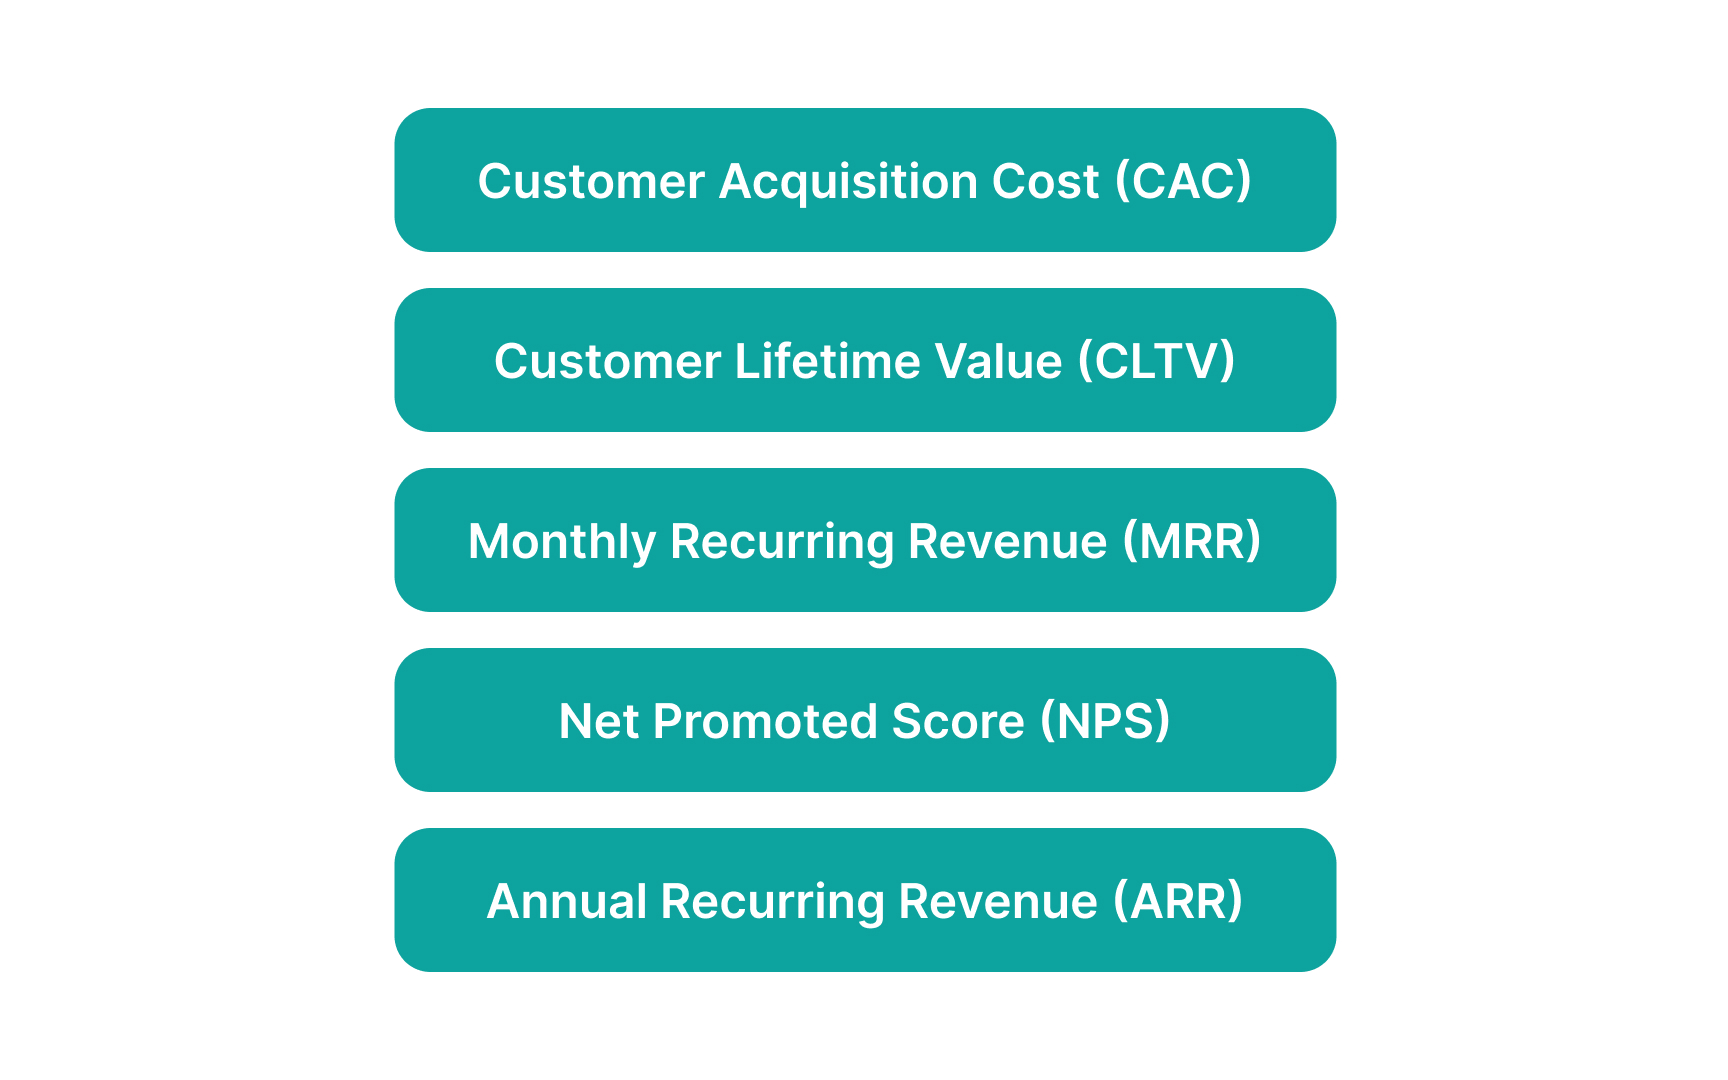
Good KPIs connect directly to your business goals and provide actionable insights. For example, a product team might track metrics like how many new users sign up each month, how long people stay as customers, or how much revenue comes from each user. These numbers tell a clear story about product performance.
What makes KPIs different from regular metrics is their strategic importance. While you could measure countless things about your product, KPIs focus only on the measurements that truly matter for success. This helps teams avoid "vanity metrics" that look impressive but don't actually help make better decisions.
Pro Tip: Limit your KPIs to 3-5 per team or objective to maintain focus since too many KPIs can dilute attention and can paralyze decision-making.
A North Star Metric is the single most important measurement that best reflects your product's success. It serves as a compass for your entire team, helping everyone focus on what truly matters for your business and customers.
The best North Star Metrics combine customer value and company success. For example, Spotify uses a North Star Metric called "Time Spent Listening" rather than just subscription
Finding your North Star Metric starts with understanding what customers truly value about your product. When users find more value, business growth naturally follows. Also keep in mind that a good North Star Metric is influenced by multiple teams, creating alignment across the entire organization.
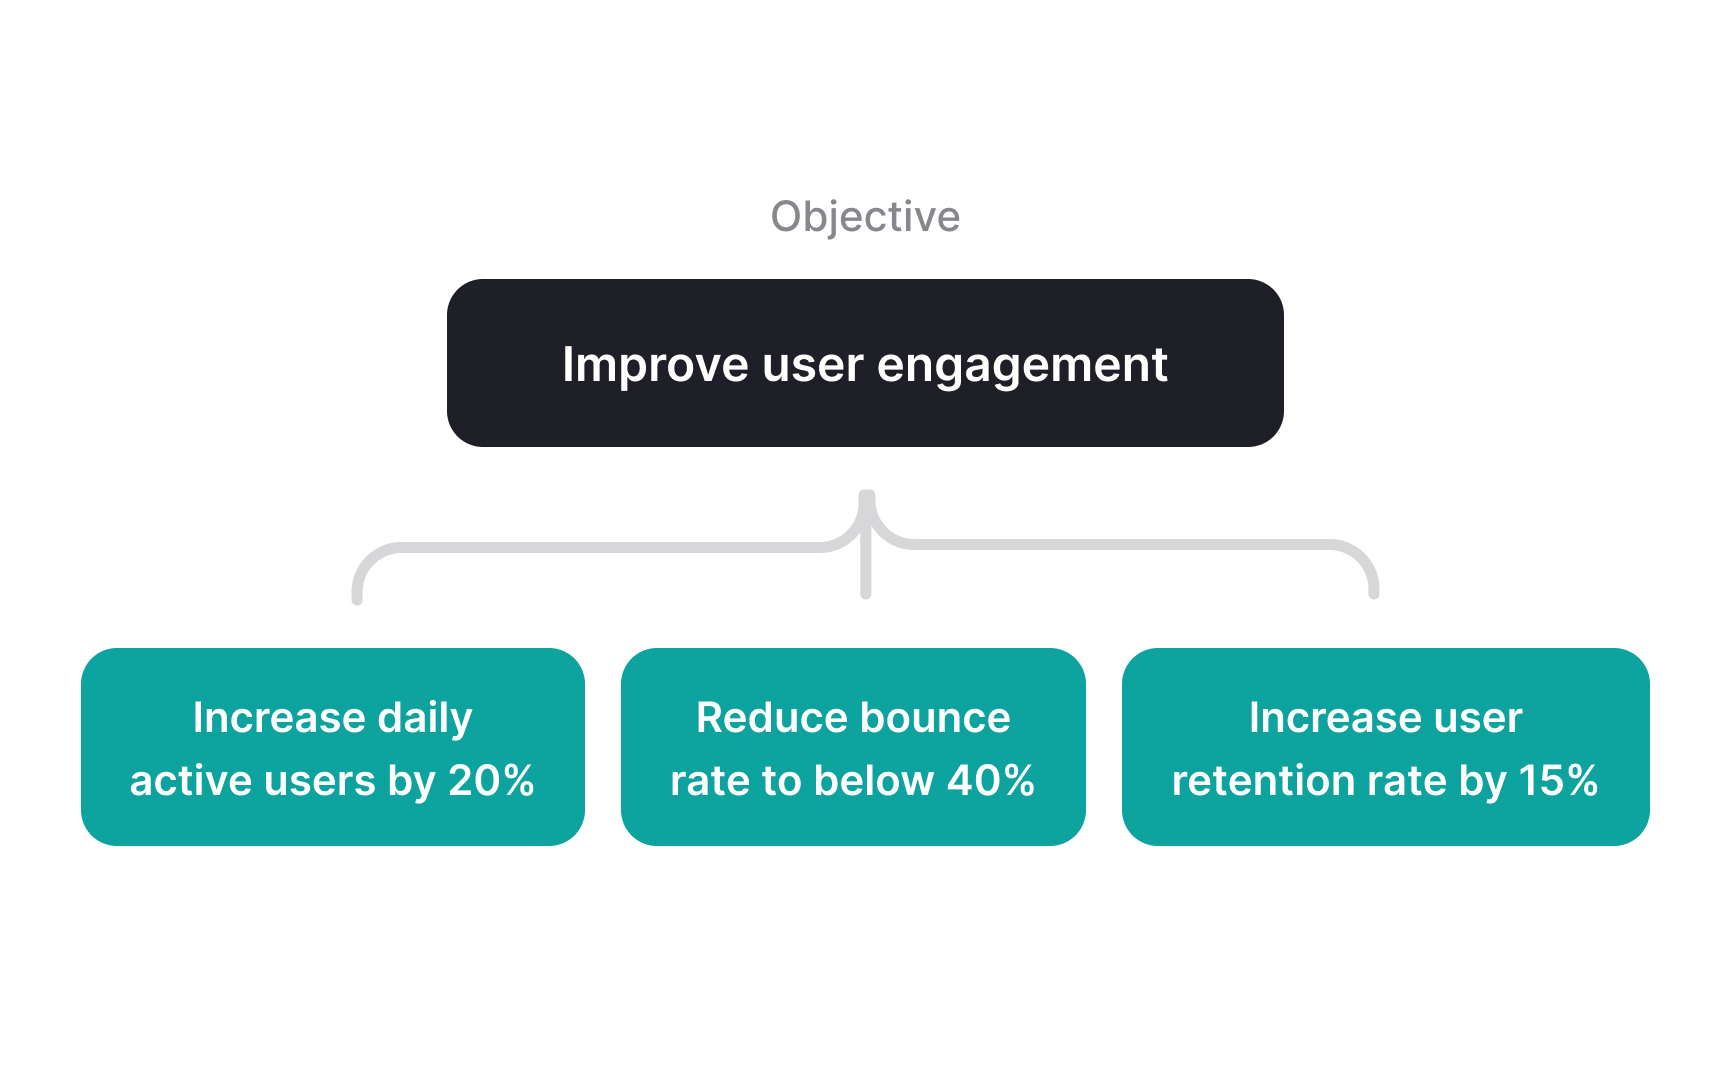
Objectives and key results (OKRs) are a goal-setting framework that connects ambitious goals with measurable outcomes. The objective is what you want to achieve: a clear, inspiring goal that motivates your team. Key results are the specific, measurable outcomes that show you're making progress toward that objective. The OKR framework was popularized by Intel and Google, designed to align teams around shared goals while providing clear measures of success. Unlike traditional goal-setting, OKRs encourage teams to set challenging targets. Achieving just 70% of an OKR is often considered successful.[2]
For example, a product team might set an objective to "Create the most user-friendly onboarding experience in our industry." The key results could include "Reduce time-to-value from 30 minutes to 5 minutes," "Increase completion rate of onboarding from 65% to 90%," and "Achieve an onboarding satisfaction score above 4.5/5." These clearly show whether the objective is being achieved.
OKRs work best when they flow through the entire organization. Company objectives break down into team objectives, which connect to individual objectives. This alignment helps everyone see how their daily work contributes to the company's bigger mission, creating better focus and preventing scattered efforts. A similar framework is the concept of levers and the rate-limiting step. In this framework, the levers are the metrics that move the north star (the key results), and the rate-limiting step is the biggest bottleneck or the most important lever. Smaller teams often use this framework because it is simpler and more direct.
Different measurement frameworks serve different purposes in your product strategy. Knowing when to use each one helps you get maximum value from your metrics.
OKRs shine when you're pushing for significant improvement or change. They're perfect for quarterly focus areas where multiple teams need to coordinate their efforts. A company might set OKRs when launching a new product feature, entering a new market, or solving a critical business problem that cuts across departments.
Your North Star Metric provides long-term direction that rarely changes. It helps teams prioritize work and make decisions when faced with competing options. While KPIs and OKRs might change quarterly or annually, a good North Star Metric remains stable for years, changing only when your business model fundamentally shifts.
The KPIs you choose don't just measure performance. They actively shape what your team prioritizes. Selecting the right metrics is one of the most powerful ways to influence behavior across your organization without constant management oversight.
Effective KPIs create a clear link between daily work and business success. For example, a
Be careful about unintended consequences when designing KPIs. If you measure only speed, quality might suffer. If you track only quantity, value may decline. For each
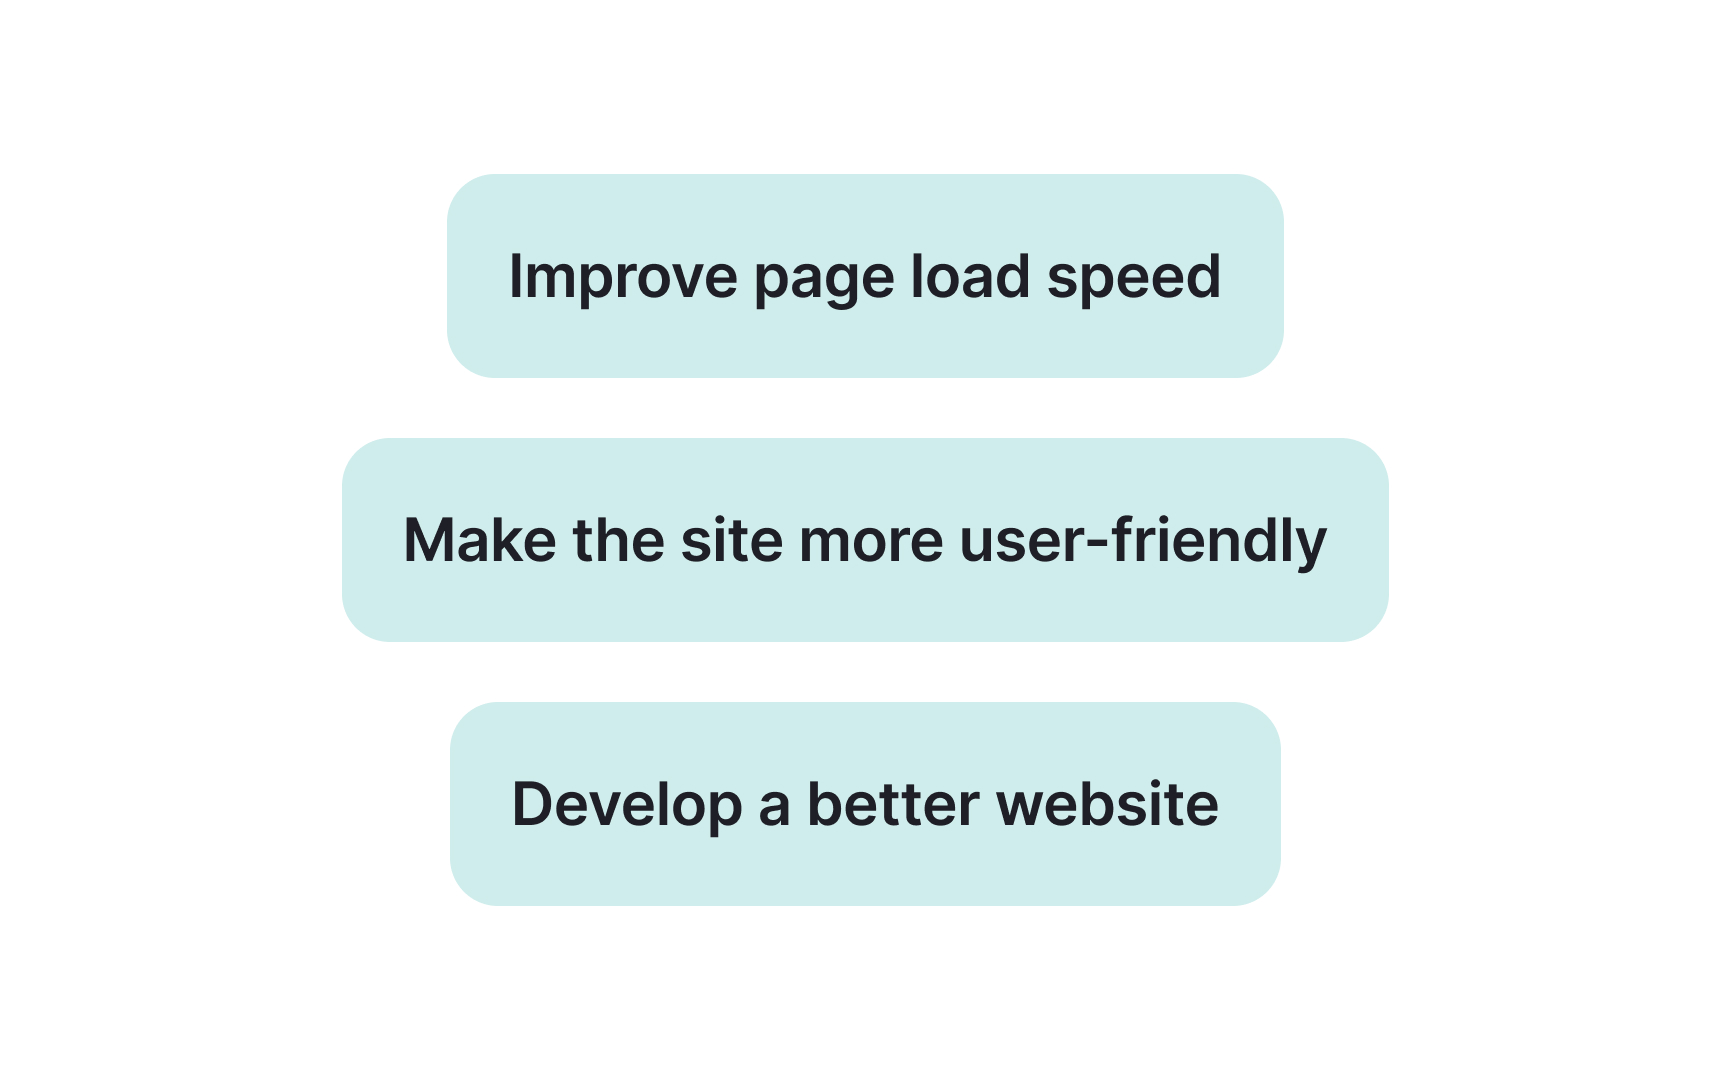
Powerful objectives inspire action through clarity and emotional resonance. Good objectives are concise, memorable, and ambitious enough to energize your team. Instead of vague corporate language like "Optimize customer acquisition efficiency," use simple, inspiring statements like "Make our signup process the simplest in the industry."
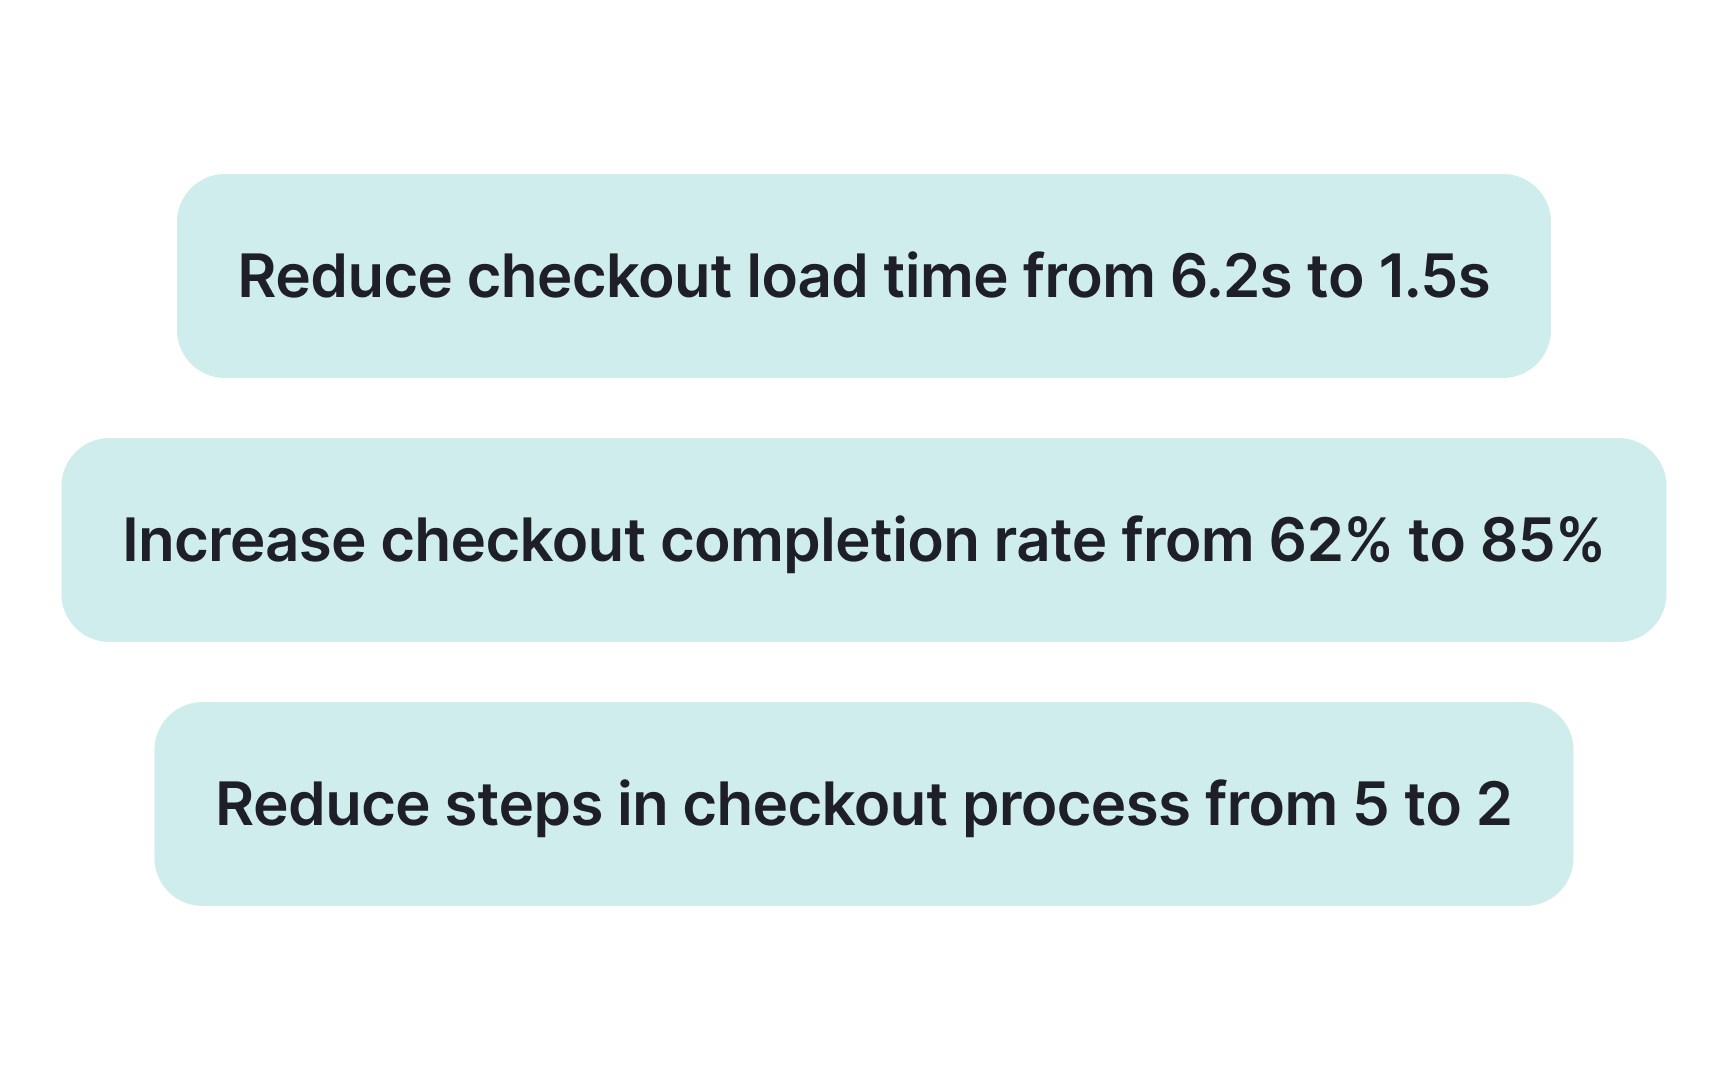
Key results transform your objectives into measurable outcomes. Each key result needs a specific number and unit of measurement so everyone can clearly see progress. For example, rather than "Improve website performance," a better key result would be "Reduce page load time from 4.2 seconds to under 1.5 seconds." This precision eliminates debates about whether you've succeeded.
Also, limit each team to one objective with 2-3 key results. Focus on achieving the objective with the highest impact first before moving on to the next one.
Pro Tip: Draft your OKRs, then explain them to someone unfamiliar with your work. If they immediately understand what you're trying to achieve and how you'll measure success, you're on the right track.
A 90-day OKR cycle creates a powerful balance between stability and adaptability. This timeframe is long enough to accomplish meaningful work yet short enough to adapt to changing conditions. But a quarter only works well if a team focuses on one key objective. If a team has more than one, it spreads too thin. Think about this: if only 1 in 4 or 5 experiments work, and a team runs one per week, they’ll get about 3 wins in a quarter. That’s why focus matters.
Good OKR cycles follow a simple structure:
- Start with a planning session. Make sure team goals align with company goals.
- Check in halfway through the quarter. Review progress. Adjust if needed.
- End with a retrospective. Talk about what worked, what didn’t, and why.
The real magic happens when you complete a few consecutive OKR cycles. Teams develop a muscle memory for setting ambitious but achievable goals, tracking meaningful metrics, and delivering results. Each quarter builds on the learning from previous cycles, creating a continuous improvement loop that drives increasingly better outcomes over time.
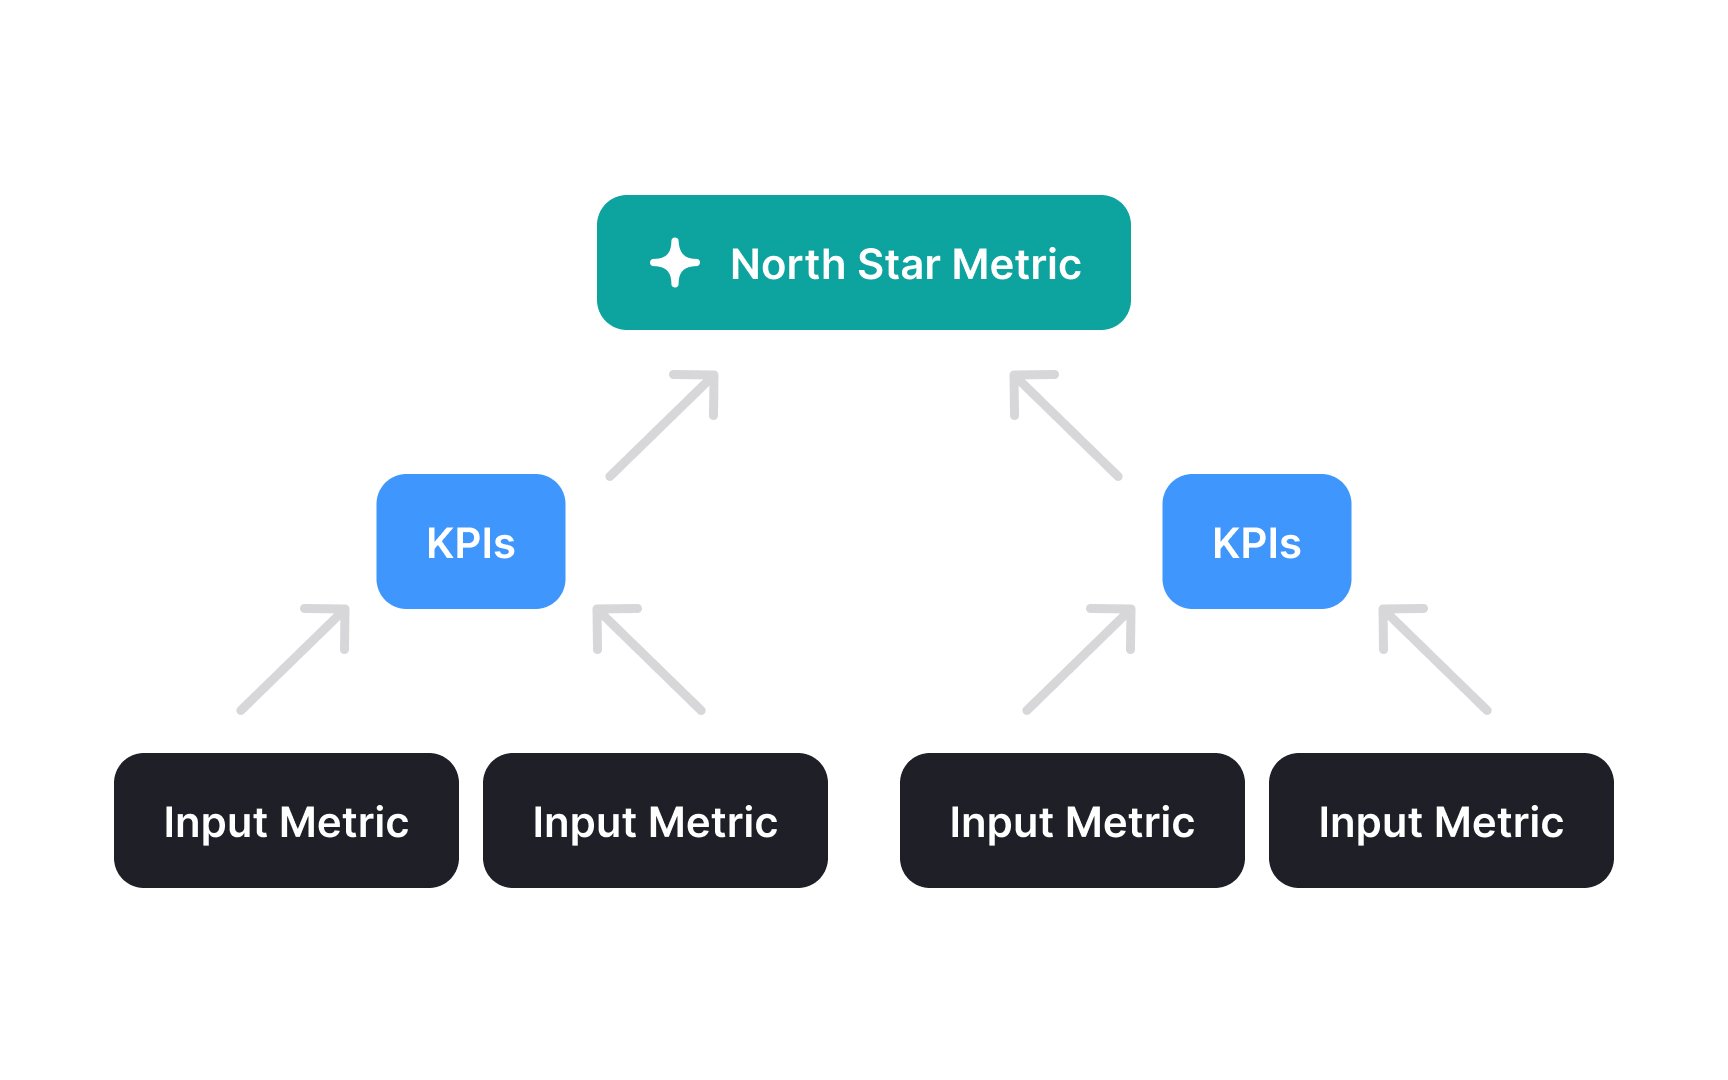
A well-structured metrics hierarchy connects high-level business goals to daily team activities. At the top sits your North Star Metric, defining overall success. The middle layer contains KPIs that monitor critical business functions. The foundation consists of team-specific input metrics that directly influence higher-level outcomes. In OKRs, you can set higher-level input metrics as your objectives. Then use more specific or lower-level input metrics as your key results. That way, the work your team does connects directly to bigger outcomes.
This hierarchical approach makes cause-and-effect relationships clear. For example, a product team might track feature adoption (input metric), which influences user engagement (
Building an effective metrics hierarchy requires collaboration across teams. Product, marketing, engineering, and customer success must agree on how their respective metrics influence each other.
Good measurement is about focusing on basic principles, not complicated systems. First, be clear about why you're measuring something. Each metric should help you answer a specific question or make better decisions. Ask "What will we do with this data?" before adding any new metric. If you can't clearly explain how a measurement will impact decisions, it probably isn't worth tracking.
Data quality matters more than quantity or sophistication. The most elegant metrics framework fails when built on unreliable data. Smart teams invest heavily in data integrity because they know decisions based on flawed data lead to worse outcomes than informed intuition. Before expanding your measurement system, ensure your core metrics are accurately and consistently captured.
Finally, remember that metrics support human judgment; they don't replace it. Numbers can't capture every nuance of customer experience or product success. Always complement quantitative metrics with qualitative insights from user research. The most successful teams use metrics as guidance while recognizing the limitations of pure quantitative measurement.
References
Topics
From Course

Share


Similar lessons

Introduction to Churn Metrics and Analysis

Common Causes of Customer Churn
