A/B Testing & Experimentation
Learn how to run controlled experiments to validate product decisions with real user data
A/B testing lets you compare two or more versions of something to see which one works better. Instead of guessing what users want, what will work for them, or make them behave in a desired way, you show version A to some people and version B to others, then measure what happens. This approach takes the politics, guesswork, and subjectivity out of product decisions since numbers don't lie. Testing isn't just about button colors anymore. Netflix tests different thumbnail images to see which ones get more clicks. Spotify experiments with playlist layouts. Amazon constantly tweaks its checkout process. These companies test hundreds of things at once because small improvements add up to big wins. Running good tests requires patience. You need enough users to see real patterns, not random noise.
Statistical significance tells you when results are trustworthy versus just luck. Many tests fail or show no difference, and that's valuable information too. The tricky part is designing fair tests. If you change too many things at once, you won't know what caused the difference. Testing during holidays might skew results for some products and industries. Some users might see both versions if the test is not configured properly, and mess up your data. Ethical testing means being transparent with users and not manipulating vulnerable groups. The best product teams test constantly, learning what works through real user behavior rather than opinions in meeting rooms.
Successful experiments start with clear goals. Are you trying to increase sign-ups, reduce cart abandonment, or improve engagement? Each goal needs specific metrics that directly measure success. Vague objectives lead to inconclusive results that waste time and resources.
Pro Tip: Start with high-traffic pages or features to get results faster and more reliable data.
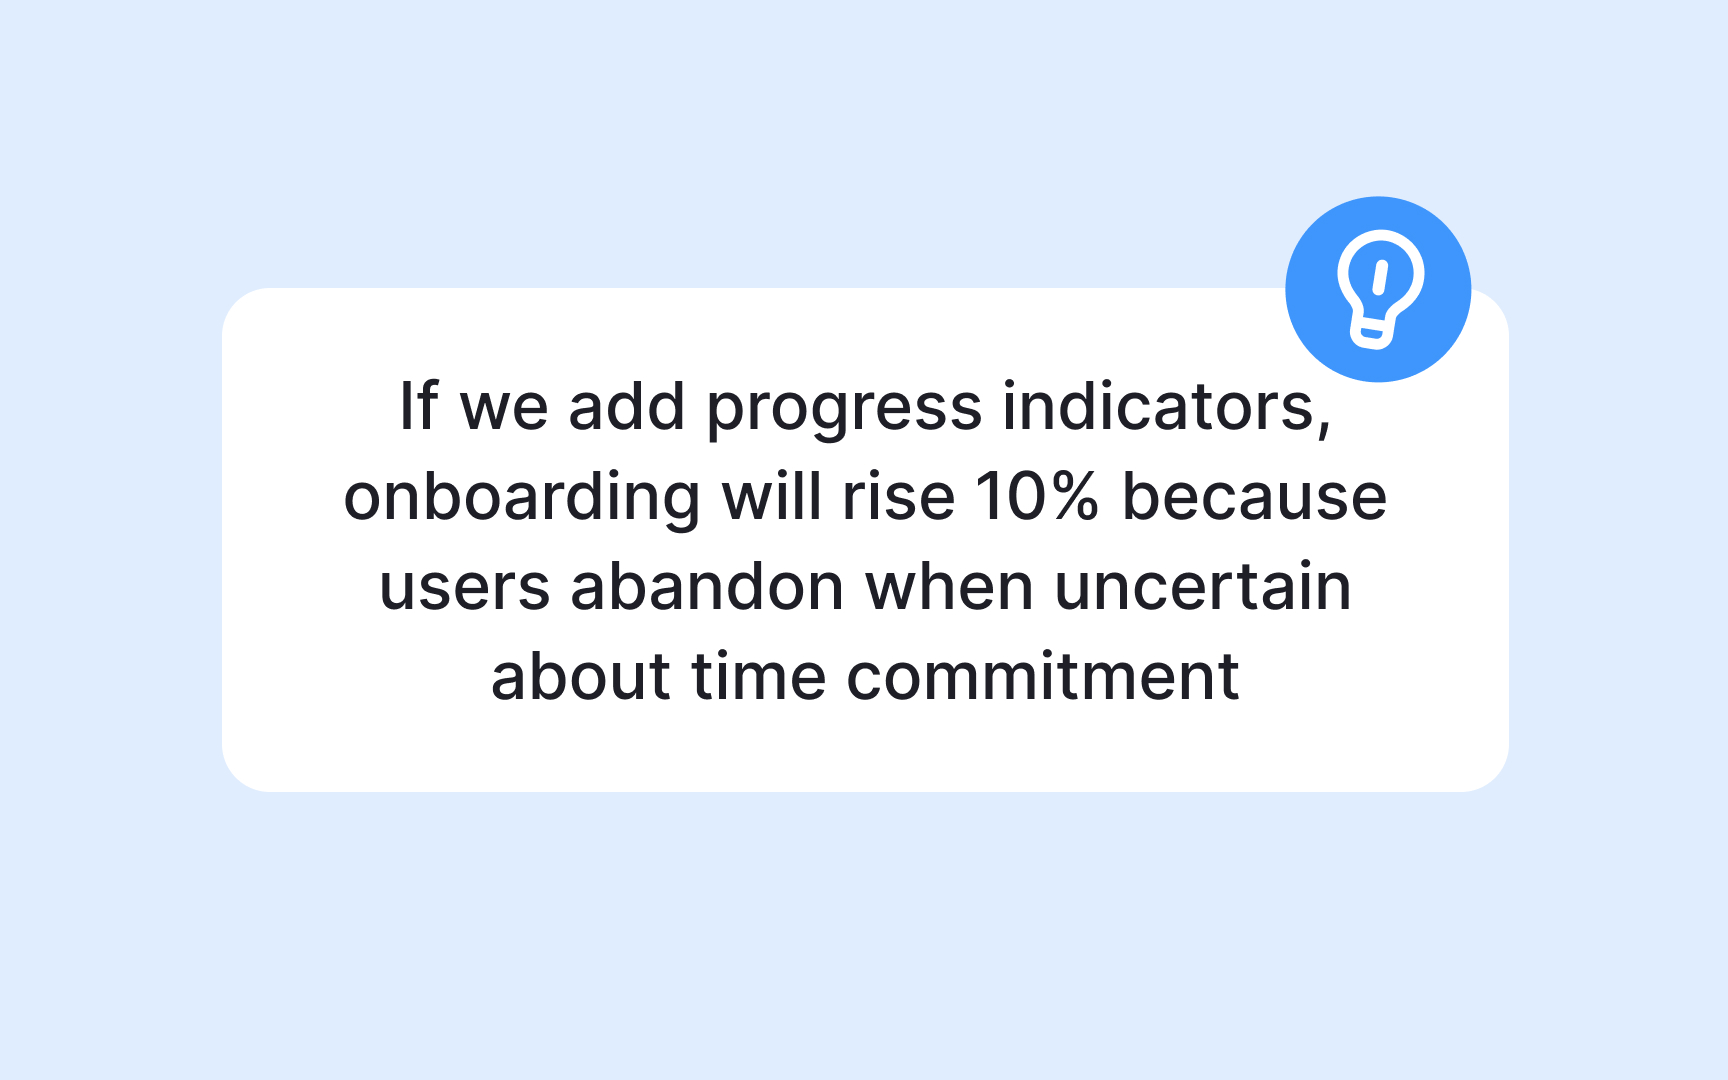
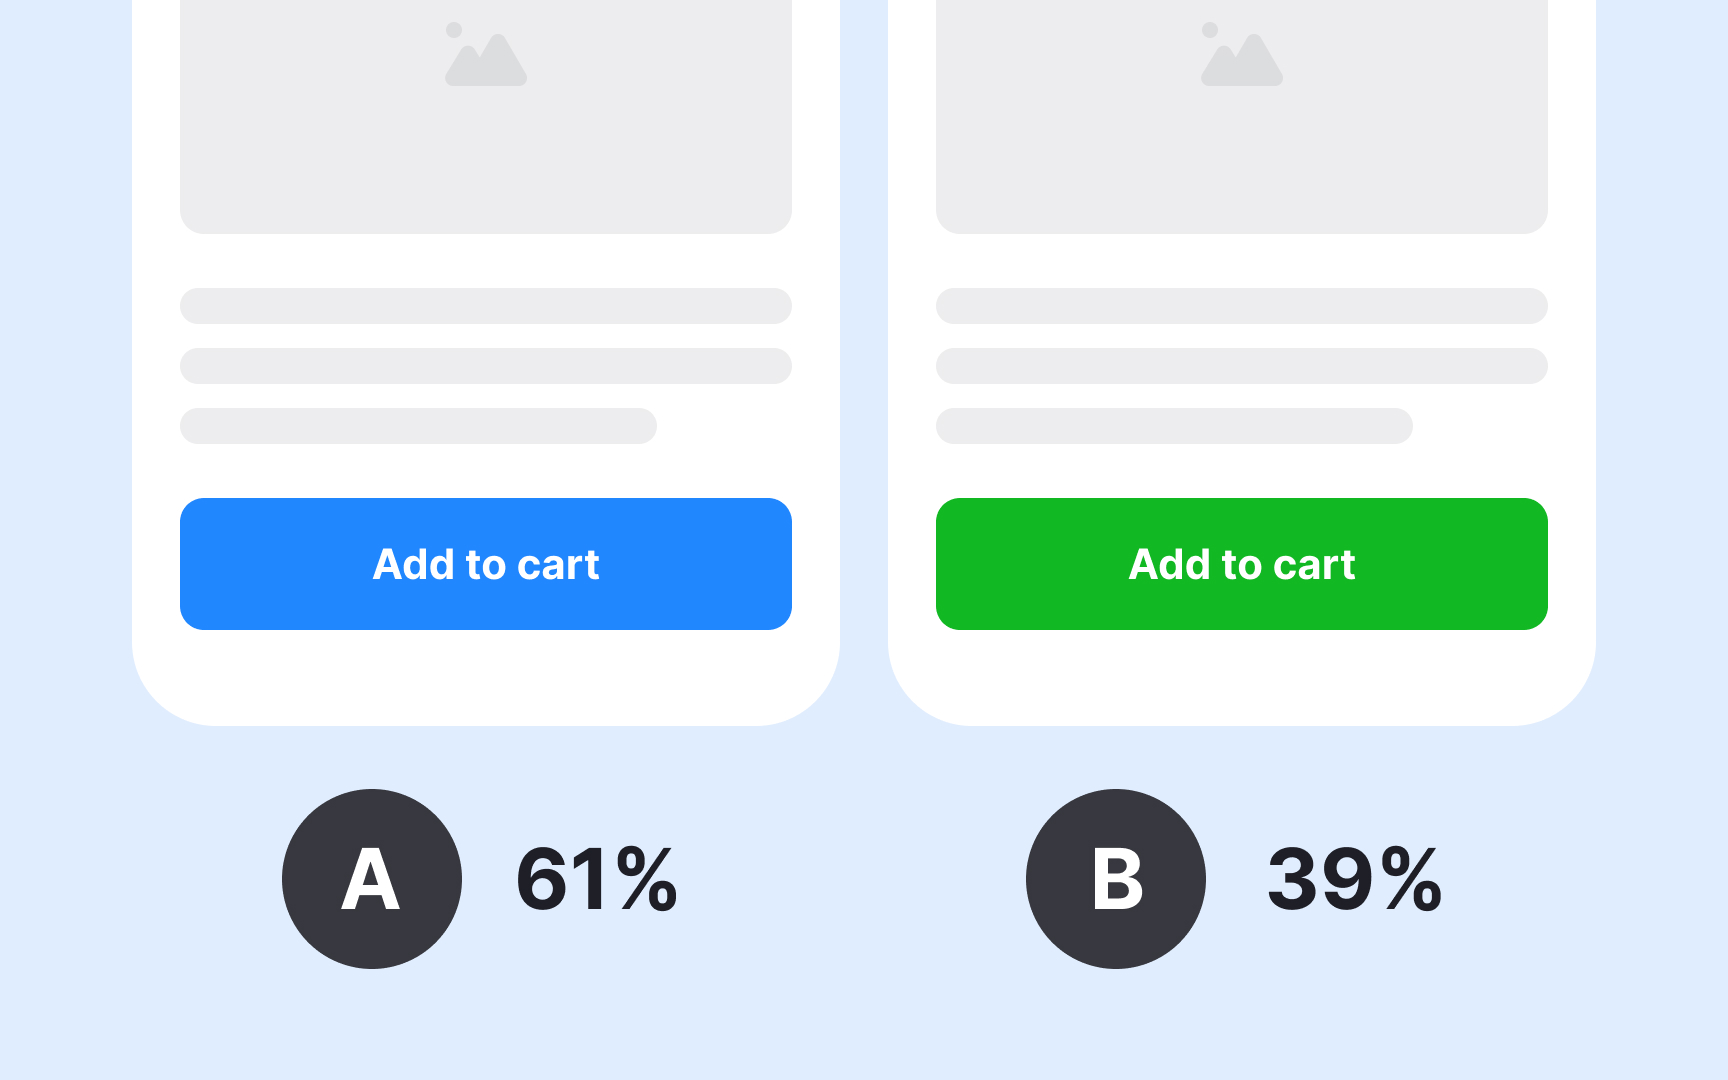
Strong hypotheses predict specific outcomes based on user behavior insights. They follow a simple format: "If we [make this change], then [this metric] will [increase/decrease] because [user insight]." This structure forces clarity about what you're testing and why you believe it will work.
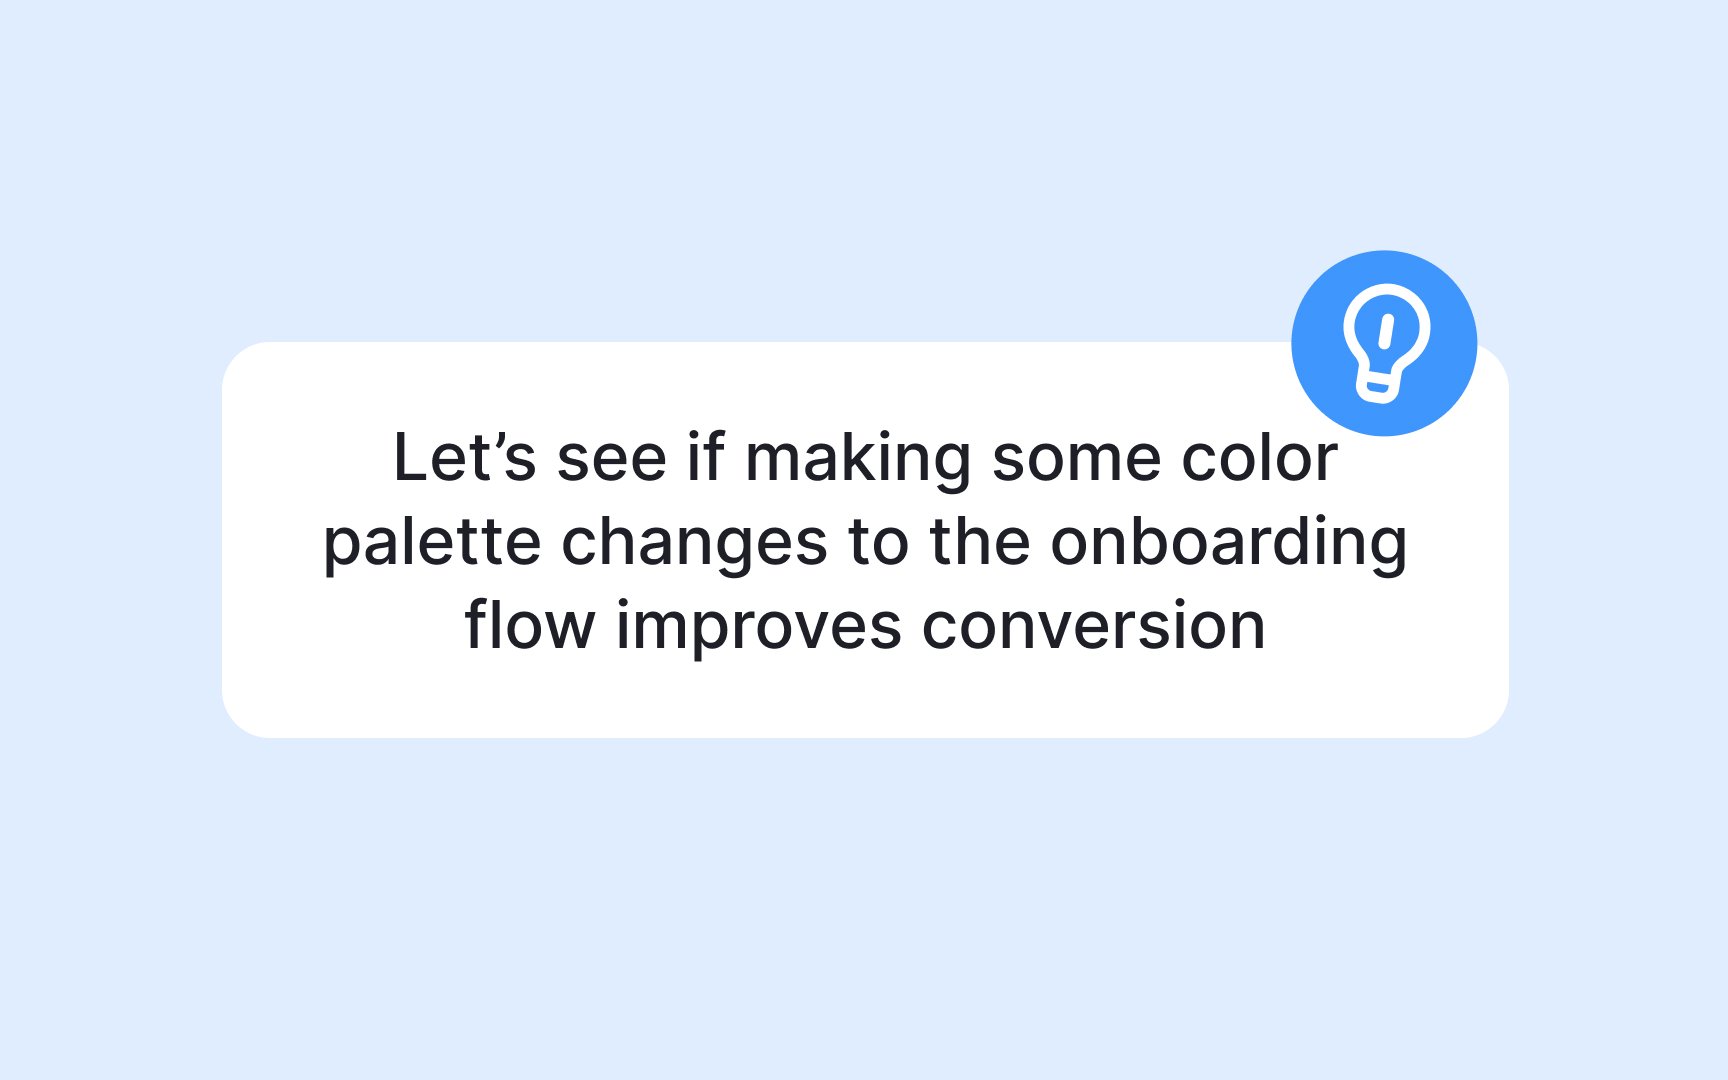
Bad hypotheses make vague predictions without reasoning. "Let's see if a bigger
Hypotheses should be falsifiable and measurable. In this example, the hypothesis is falsifiable because the test can clearly show it is wrong: completion rates may stay the same or even drop after increasing the button size.
Importantly, design your test to disprove the hypothesis rather than prove it. This approach helps reduce confirmation bias, our natural tendency to seek evidence that supports what we already believe. You need to be wrong sometimes. If every test "succeeds," you're probably measuring the wrong things or interpreting data to fit predetermined conclusions.
Sample size tells you how many users need to see your test before you can trust the results. Too few users means your winner might just be lucky. Too many users means waiting forever when you already have a clear answer.[1]
Online calculators like Optimizely help you find the right number.[2] The calculation needs 3 things: your baseline conversion rate or other metric you want to improve, the minimum improvement you want to detect, and your desired statistical confidence level. For example, if your product’s desired subscription level has a 20% conversion rate and you want to detect a 5% improvement with 95% confidence, you might need 25,000 visitors per variation to make a valid conclusion.
Your daily traffic determines how long tests run. Amazon can test new features in hours because millions visit daily. A small B2B tool might need weeks to get enough data. This is why you should calculate sample size first. Otherwise you might end tests too early or let them drag on too long.
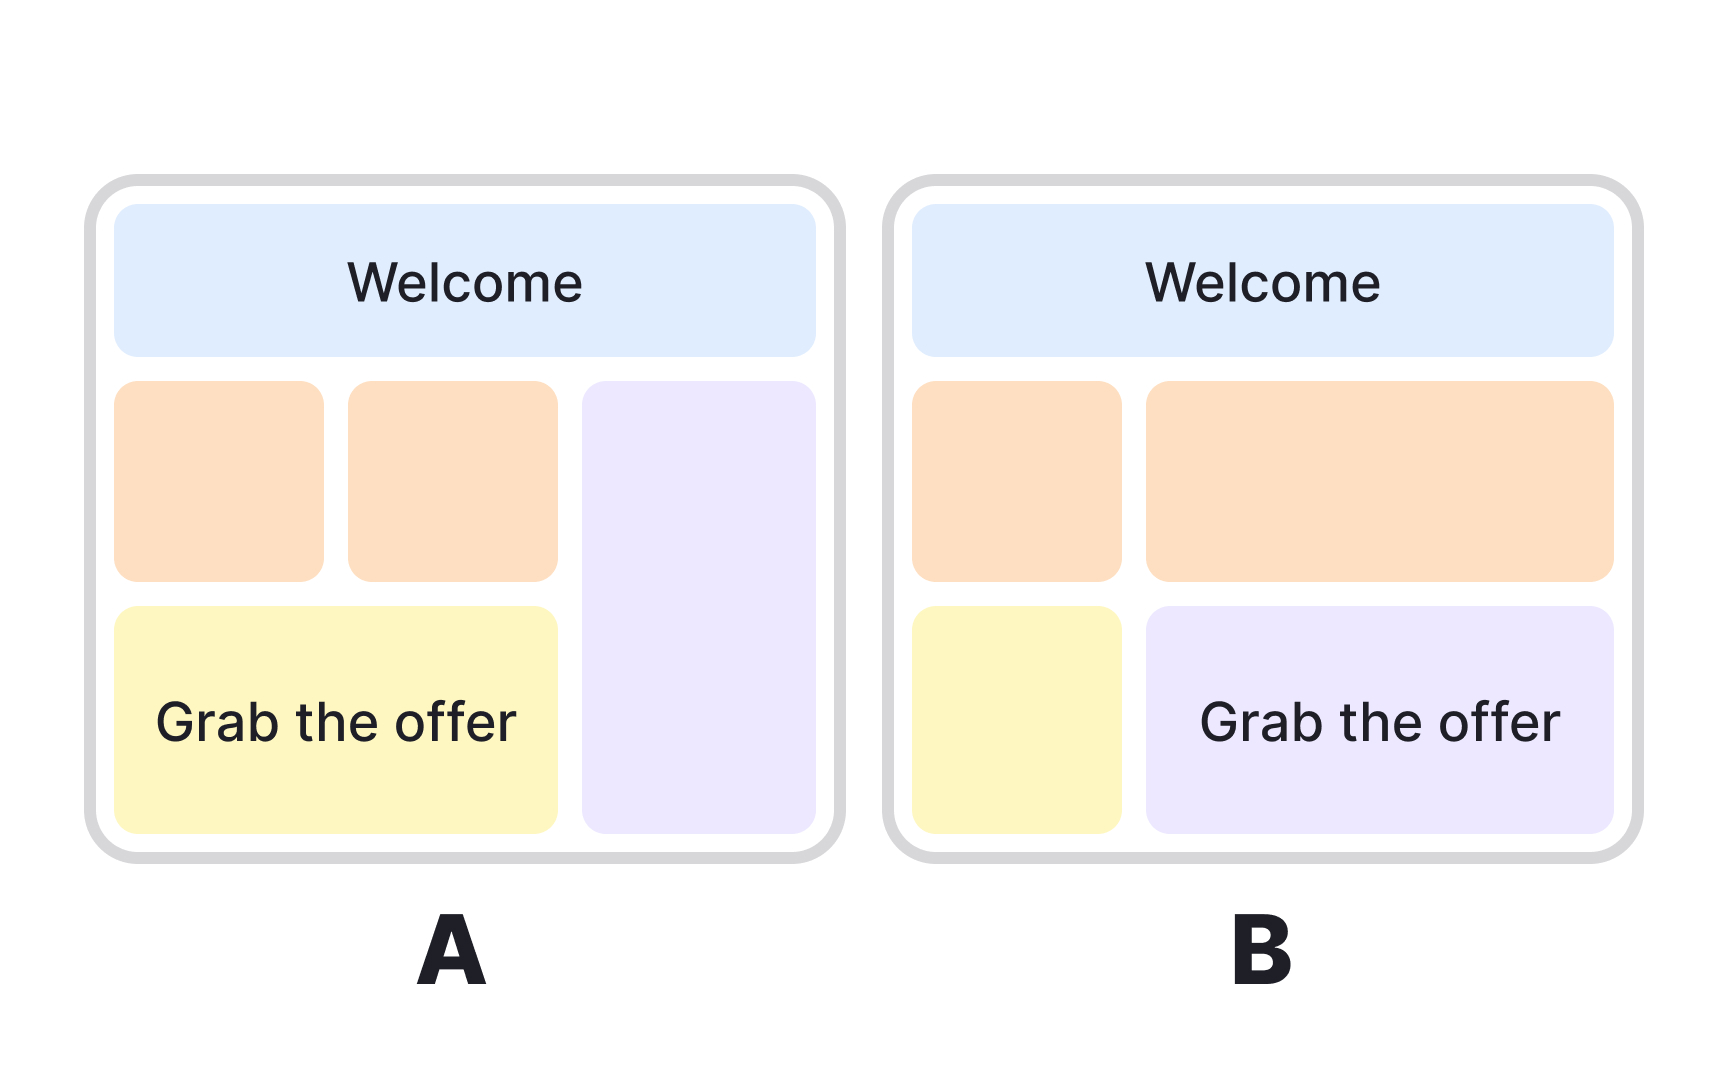
Good test setup prevents broken experiments. Start by defining exactly what changes between versions. Document every difference, even tiny ones like spacing or load times. This documentation helps when analyzing results and prevents confusion about what actually drove the change.
User assignment must be random and persistent. When someone visits, they're randomly assigned to version A or B. They should see the same version every time they return. Cookie-based tracking usually works, but consider logged-in user IDs for better accuracy. Split traffic 50/50 unless you have specific reasons to do otherwise. Quality assurance catches problems before launch. Test both versions on different devices and browsers. Check that tracking fires correctly. Verify that users can't accidentally see both versions. Small setup mistakes create big headaches later.
Popular
Statistical significance tells you whether your test results are real or just random chance. Think of it like flipping a coin. Getting heads three times in a row doesn't mean the coin is rigged. Similarly, version B performing better for a day doesn't mean it's actually superior. You need enough data to be confident.
Most teams use 95% confidence level, meaning there's only a 5% chance the results are due to random variation. P-value measures this confidence. When p-value drops below 0.05, you've reached statistical significance. But this isn't a magic number. Sometimes 90% confidence makes sense for low-risk changes. Critical features might need 99% confidence.
Reaching significance too quickly often means something's wrong. If your test shows significant results after 100 users, check your setup. Real differences usually take hundreds or thousands of users to detect.
Raw numbers tell only part of the story. Version B might show 10% higher conversion, but dig deeper. Check if the improvement holds across different user segments. Mobile users might love the change while desktop users hate it. New visitors might convert better while returning customers convert worse.
Look beyond your primary metric. An experiment might increase purchases but decrease average order value, resulting in lower revenue. Or it might boost short-term conversion while hurting long-term retention.
Context also matters for interpretation. A successful holiday season test might fail in January. A test that works for US users might flop in Japan. Time-based patterns like day of week or hour of day can skew results. This is why many teams run tests for full weeks to capture these cycles.
Multivariate testing examines how different elements work together. Instead of testing one change at a time, you test combinations. For example, you might test two headlines and two
The downside of this testing method is complexity and traffic requirements. Testing two elements with two variations each needs 4x more traffic than a simple
Successful experimentation requires organizational buy-in beyond just the product team. Engineers need to prioritize test infrastructure. Designers must accept that user data might contradict their intuition. Executives should celebrate learning from failed tests, not just
Start small with low-risk, high-visibility wins. Test email subject lines or
Create systems that make testing easier:
- Build reusable test templates
- Document past experiments in a searchable database
- Set up automated significance calculators
- Establish clear guidelines for test approval and analysis