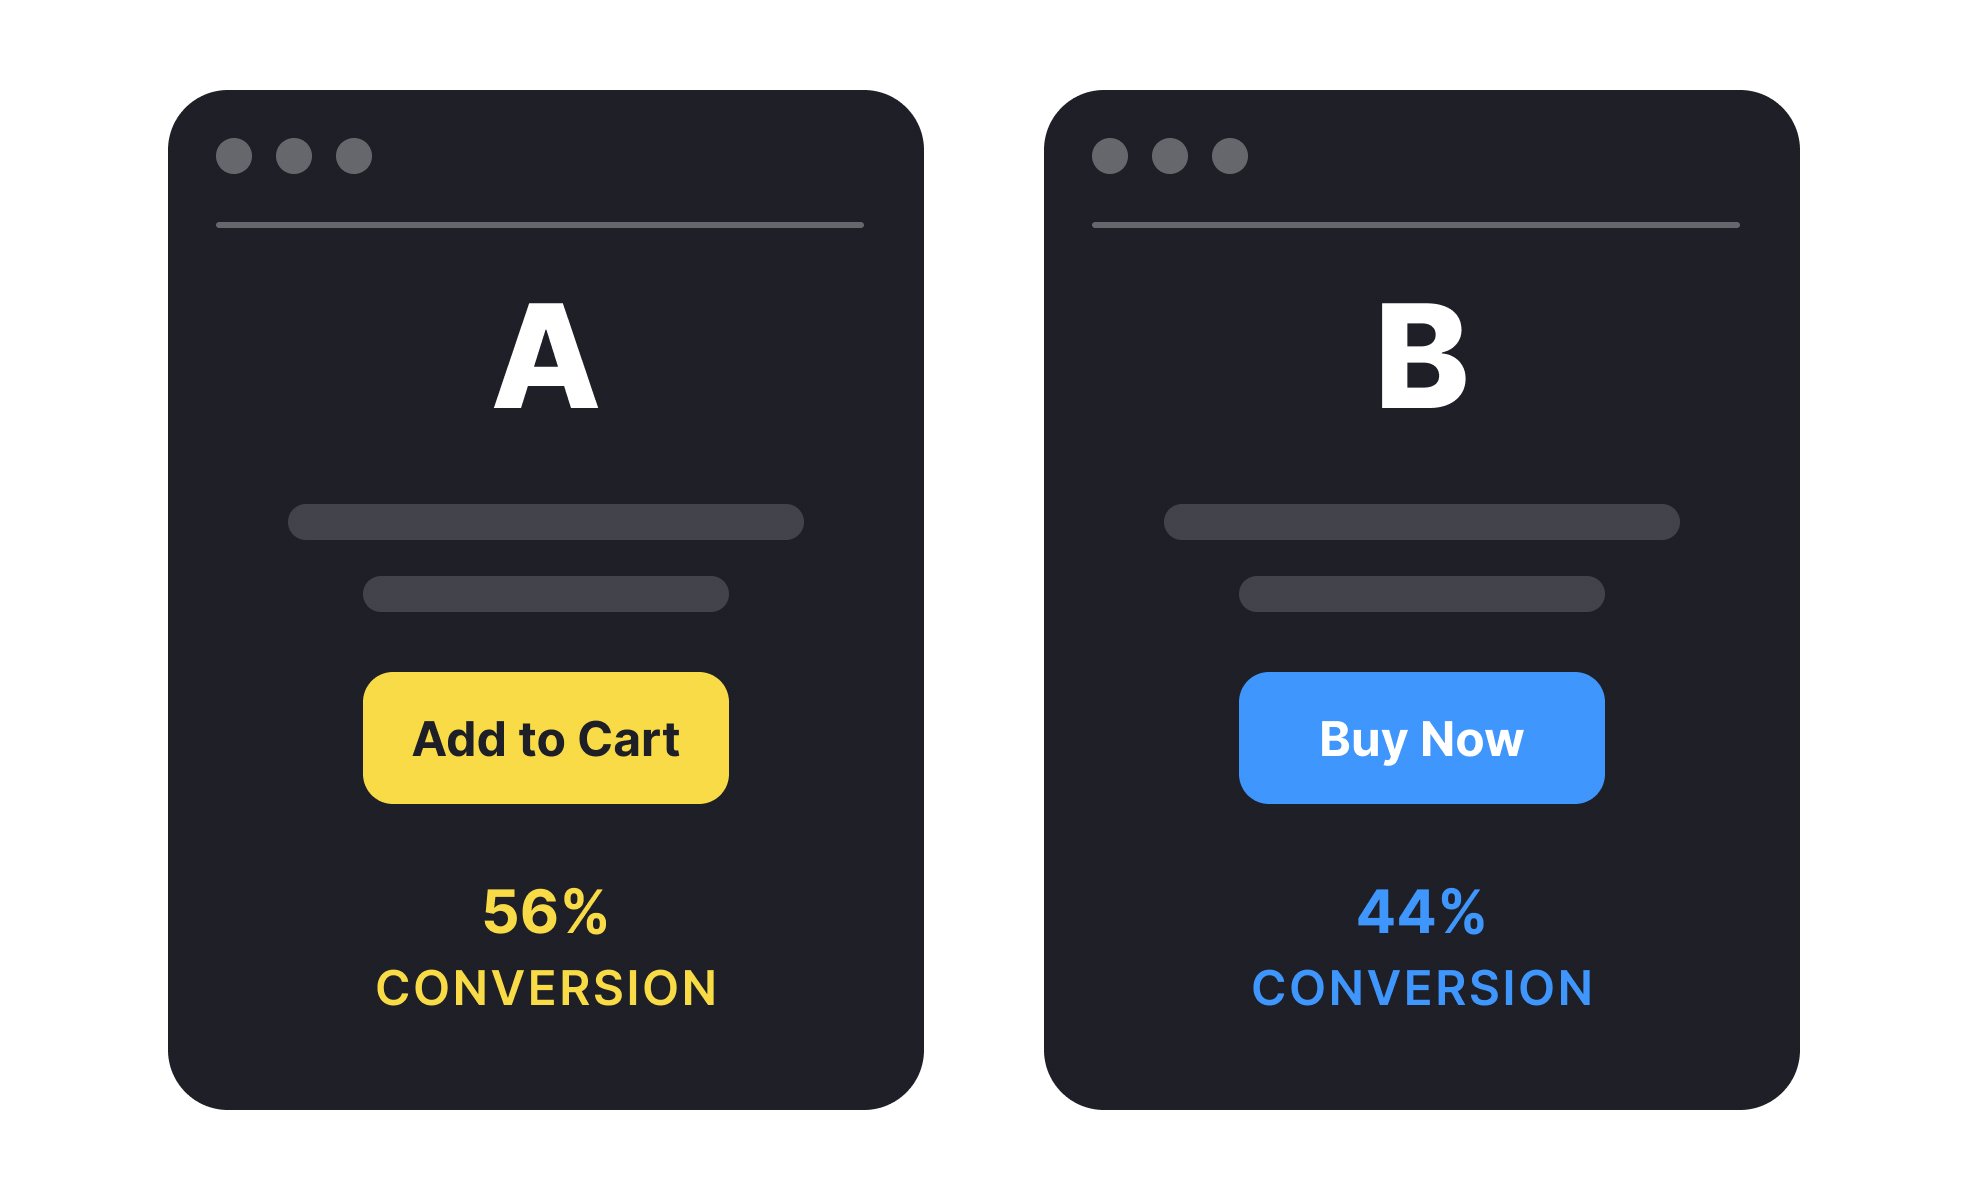
A/B Testing
A/B testing compares two versions of a design or feature to evaluate which performs better based on user behavior and data.


What is A/B Testing?
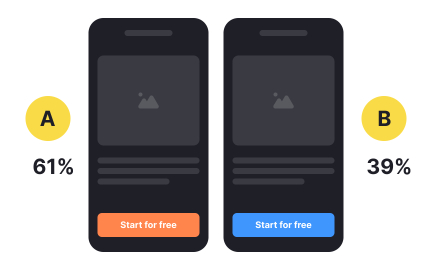
A/B testing compares two versions of something - a webpage, app screen, email, or advertisement - to see which performs better. Half your audience sees version A, half sees version B, then you measure results. It's like having two store displays and counting which one sells more products.
The concept extends beyond simple comparisons. Split testing, multivariate testing, and bucket testing all follow similar principles but test different variables. Some teams run dozens of tests simultaneously to optimize every aspect of user experience.
A/B Testing Across Different Product Areas
Product teams apply controlled testing throughout customer journeys to validate assumptions and optimize experiences systematically.
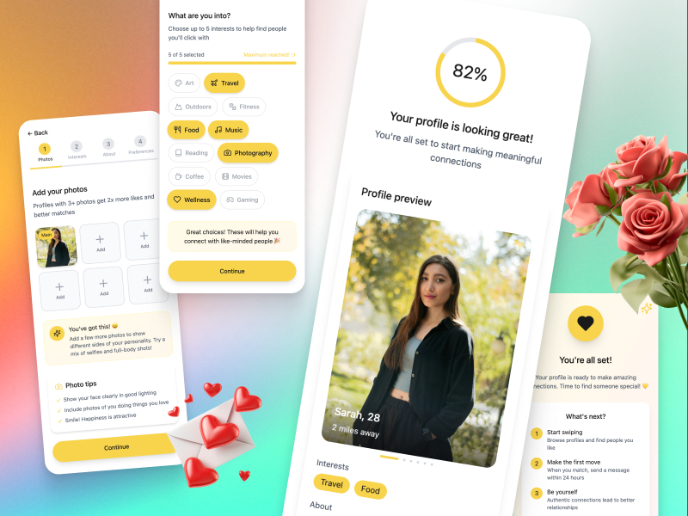
New feature validation
Test functionality with limited user segments before general release. Microsoft's Bing team discovered through testing that a minor search result layout change generated $100 million in extra annual revenue - something no focus group would have predicted.
Onboarding flow optimization
Compare different welcome sequences to find the smoothest path to activation. Slack increased activation rates 30% through systematic testing of their new user experience, removing friction points that weren't obvious to internal teams.
Pricing experiments
Test different price points and packaging structures to optimize revenue. Netflix found their three-tier pricing model through extensive testing, not boardroom discussions - it boosted revenue 15% over their previous two-option approach.
Interface improvements
Validate visual and functional changes before implementation. Capital One tests every major interface modification in their banking app, achieving 20% better customer satisfaction through systematic refinement.
Set up your testing process
Step 1: Create a specific hypothesis
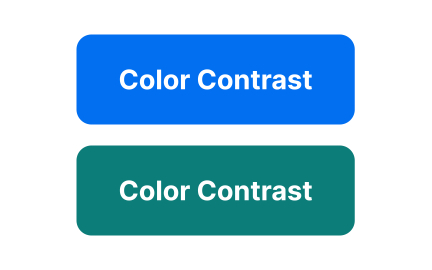
Make testable predictions with clear reasoning. "Changing the buy button from green to orange will increase clicks 15% because orange contrasts better with our blue background" beats vague hopes about "improving performance."
Step 2: Design and implement
- Change one element at a time for clear cause-and-effect
- Use sample size calculators to determine statistical requirements
- Plan 2-4 week testing periods for reliable results
- Set success criteria before launching
Step 3: Let it run
Deploy through platforms like VWO and Optimizely. Watch for data quality issues but resist drawing conclusions from early patterns. Most tests need full duration for accurate results.
Step 4: Analyze and act
Wait for 95% statistical significance before making decisions. Check secondary metrics beyond primary goals to understand complete impact. Document learnings for future testing program
Until statistical significance is reached, which depends on user traffic and variance between versions.
Yes, that’s called multivariate testing, but it requires more users and careful planning.
No, it's a complement; quantitative data needs qualitative insights for deeper understanding.
Recommended resources
Courses

Color Psychology


UX Writing


UX Research
Lessons

Testing Color Combinations

Testing UX Copy

Mobile Testing
Exercises

Assessments

Wireframing

Usability Testing

Prototyping


Projects

Uxcel Pride Month Scholarship Program

Redesigning Bumble’s Onboarding for Better Connections

Design a welcome screen for a smart fridge to help educate kids about food waste