Quantitative Research
Quantitative research uses numerical data, such as surveys, click rates, or time on task to reveal usage patterns and inform product decisions.


What is Quantitative Research?
Your product decisions rely on gut feelings and small user feedback samples instead of statistical evidence about user behavior patterns, leading to choices that might feel right but don't reflect actual user needs at scale.
Most teams collect some usage data but don't systematically analyze quantitative patterns that reveal user preferences, behavior trends, and opportunities for optimization based on statistically significant evidence.
Quantitative research is the systematic collection and statistical analysis of numerical data about user behavior, preferences, and outcomes to identify patterns, measure impact, and validate hypotheses through statistically rigorous methods that provide reliable evidence for product decisions.
Teams using strong quantitative research achieve 45% more accurate product decisions, 35% better feature adoption rates, and significantly higher ROI because their choices are based on statistical evidence rather than assumptions or small sample feedback.
Think about how companies like Google use A/B testing and analytics to optimize search results based on millions of user interactions, or how e-commerce companies use conversion funnel analysis to identify optimization opportunities that improve business outcomes.
Why Quantitative Research Matters for Data-Driven Decisions
Your product development lacks statistical validation because decisions are based on qualitative feedback from small user groups that might not represent broader user behavior patterns or preferences.
The cost of skipping quantitative research accumulates through every product decision. You optimize for vocal minority preferences, miss behavior patterns that affect most users, and compete based on assumptions rather than evidence about what actually drives user satisfaction and business results.
What systematic quantitative research delivers:
Better decision accuracy because statistical analysis reveals user behavior patterns that aren't obvious from individual feedback or internal assumptions about user preferences.
When you have statistically significant data, you can make confident decisions about feature changes, interface improvements, and strategic directions that actually improve outcomes.
Higher optimization success through measurement of specific metrics that show whether changes improve user experience, engagement, or business outcomes rather than just implementing changes that seem theoretically better.
Faster learning cycles because quantitative research provides quick feedback about what works and what doesn't, enabling rapid iteration based on measurable results rather than lengthy qualitative research processes.
Stronger business cases as quantitative research provides compelling evidence for resource allocation, strategic investments, and product direction that stakeholders can evaluate objectively.
Enhanced competitive advantage through understanding of user behavior patterns that inform product improvements and strategic positioning based on evidence rather than market assumptions.
Advanced Quantitative Research Strategies
Once you've established basic quantitative research capabilities, implement sophisticated statistical analysis and optimization approaches.
Predictive Analytics and Modeling: Use statistical modeling to predict user behavior, churn risk, and feature adoption patterns that inform proactive product improvements and strategic planning.
Multivariate Testing and Optimization: Conduct complex testing that evaluates multiple variables simultaneously to identify optimal combinations of features, interfaces, and experiences.
Cohort and Segmentation Analysis: Analyze user behavior patterns across different segments and time periods to understand how user needs and preferences vary across different contexts.
Statistical Significance and Power Analysis: Apply rigorous statistical methods that ensure research results are reliable and actionable rather than just statistically interesting but practically meaningless.
Quantitative research in UX design involves collecting and analyzing numerical data to measure and quantify user behaviors, preferences, and patterns. It employs methods such as surveys, analytics data analysis, A/B testing, and statistical analysis to make data-driven decisions and understand the overall user experience at scale.
Quantitative research is valuable in UX design when there is a need to gather large-scale data, measure user behaviors or preferences objectively, or make statistical inferences about the user population. It helps in identifying patterns, trends, and statistical relationships, providing insights for optimizing the user experience.
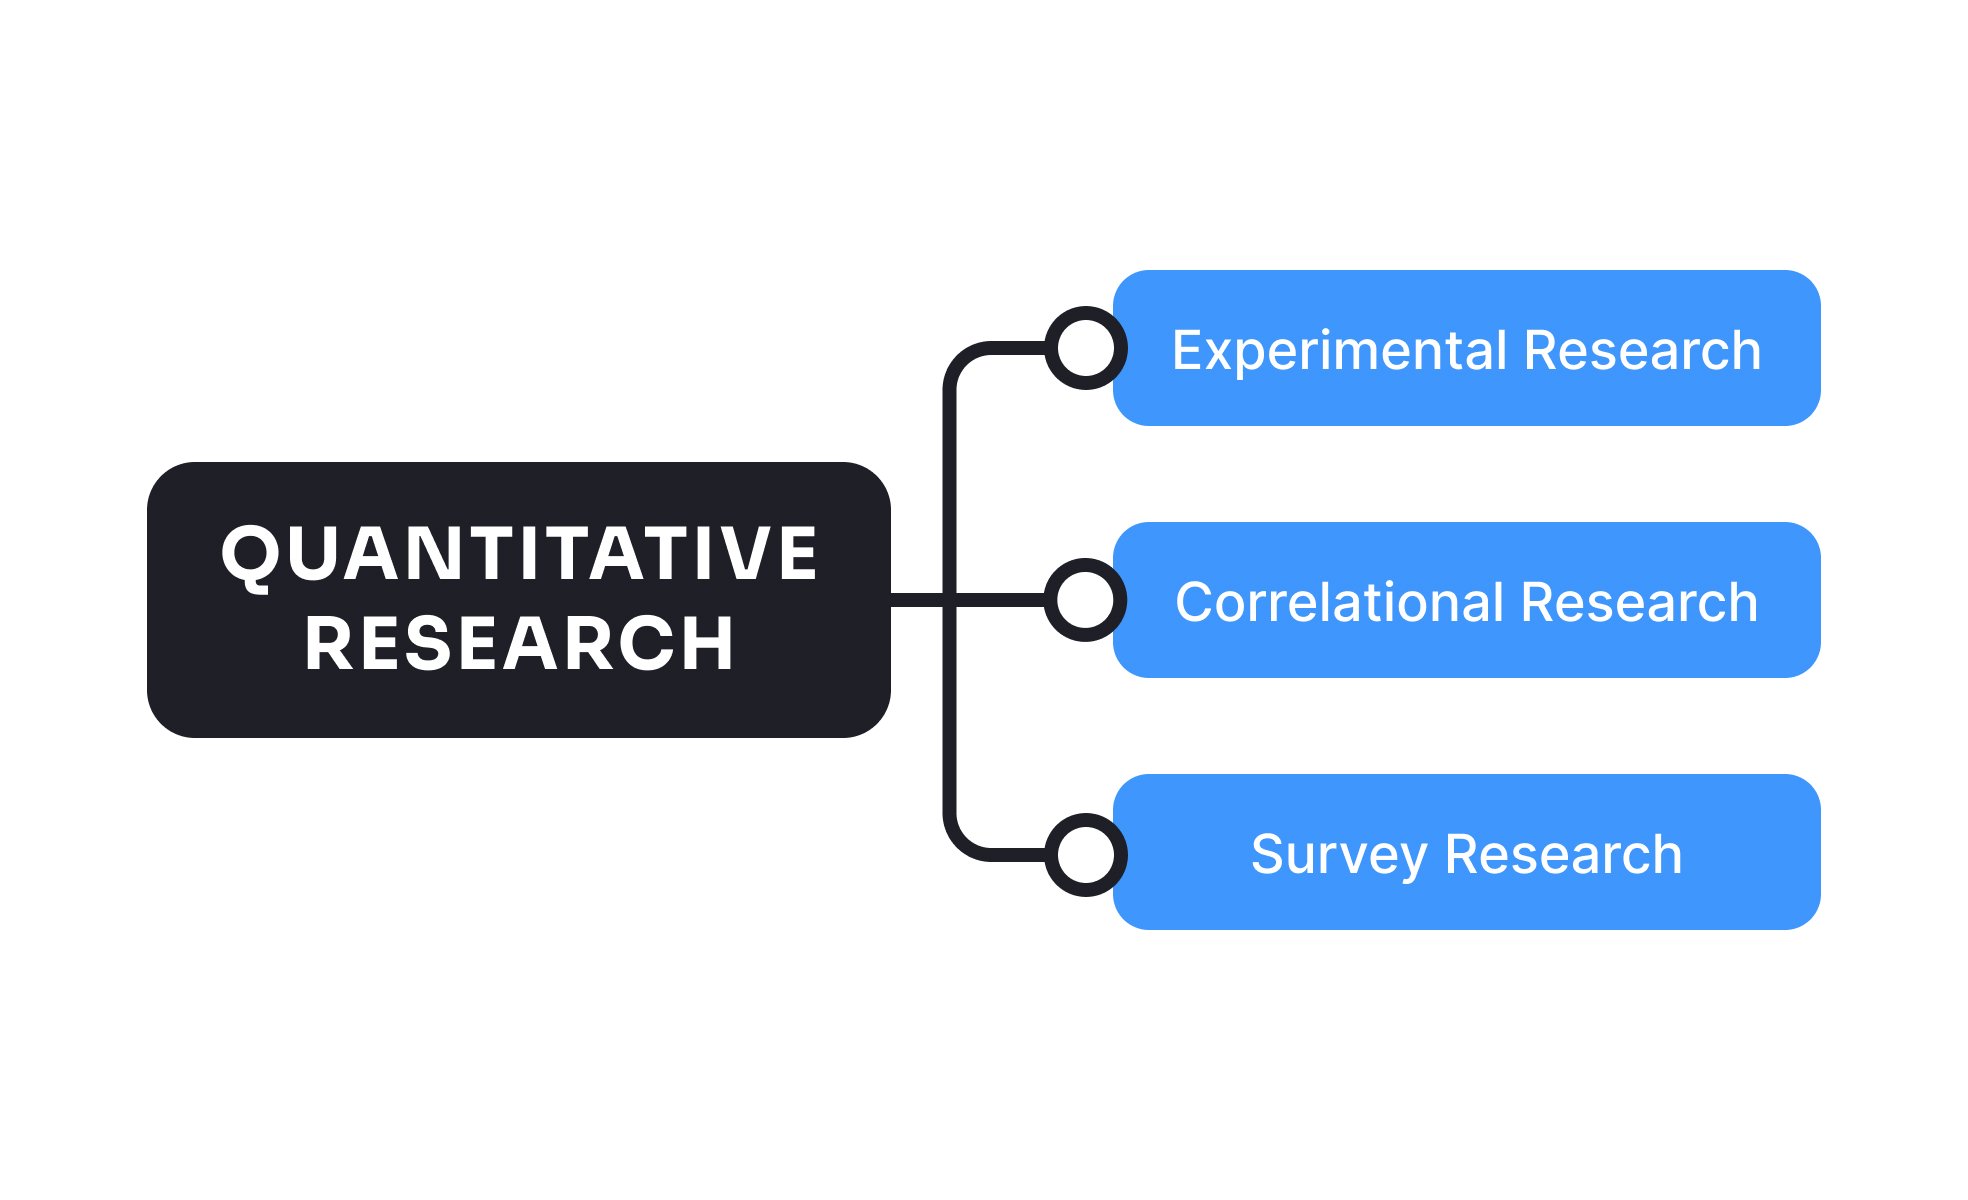
Common quantitative research methods used in UX design include:
- Surveys and questionnaires: Collecting structured data through surveys to gather feedback, measure user satisfaction, or assess usability at scale.
- Analytics data analysis: Analyzing quantitative data from tools like Google Analytics or heatmaps to understand user behaviors, navigation patterns, or conversion rates.
- A/B testing: Comparing the performance of different design variations or features by randomly assigning users to different groups and measuring quantitative metrics to determine the most effective option.
- Clickstream analysis: Analyzing user interactions and clickstream data to identify patterns, user flows, and areas of improvement in the user experience.
Learn more on the topic in our Quantitative UX Research Methods lesson.
Recommended resources
Courses

Color Psychology


UX Writing


UX Research
Lessons

User Research Basics

Quantitative UX Research Methods

Creating Surveys for UX Research
Exercises


Projects

User Persona for TikTok


eSIM from Monobank


Creating a Survey for a Food Delivery Service Survey