A/B Testing
Learn how to compare design variations to discover what truly works for your users
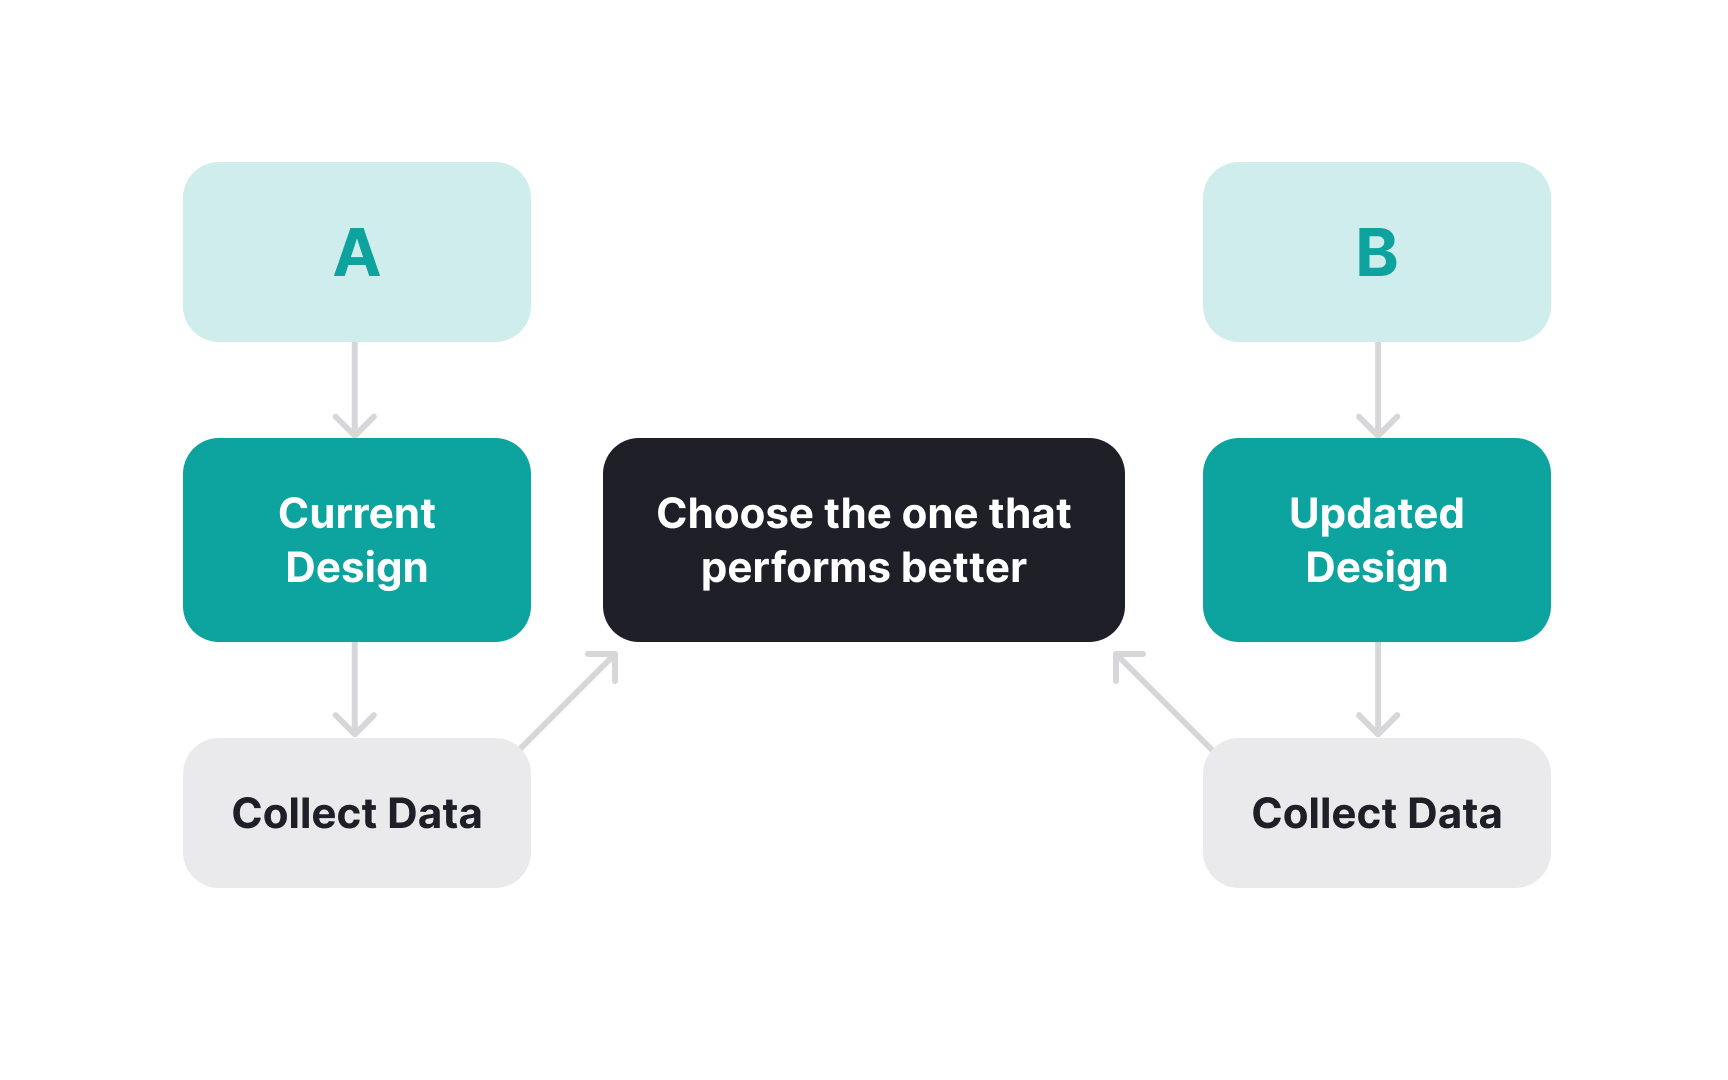
A/B testing takes the guesswork out of product decisions by comparing two versions of a design or feature to see which one performs better. This experimental approach splits users into two groups — one sees version A while the other interacts with version B. Each test reveals clear data about user preferences, making it easier to improve everything from button colors to signup flows. Product teams can use these insights to boost important metrics like conversion rates and user engagement. Rather than relying on assumptions and opinions, A/B testing provides concrete evidence of what works best for users. This scientific method of product development helps teams make confident decisions, reduce risks, and create experiences that truly resonate with their audience. The result is a product that evolves based on real user behavior rather than assumptions.
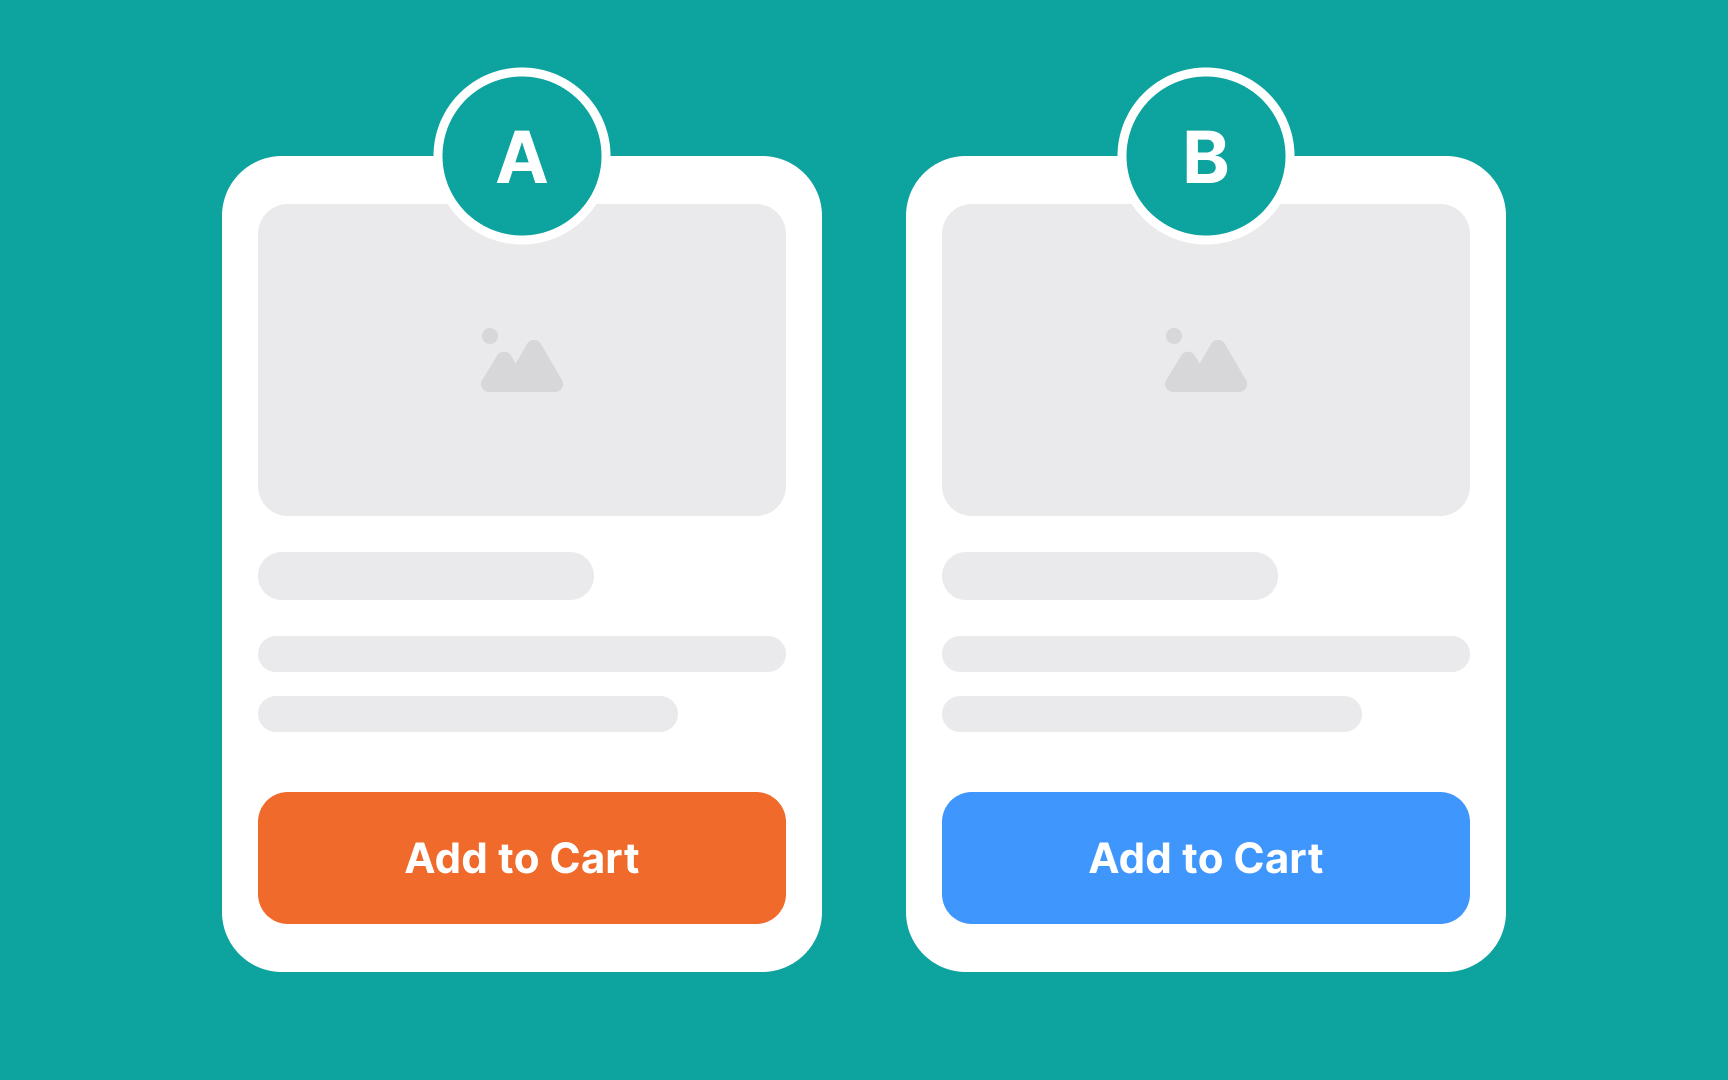
Take an e-commerce product page for example. A hypothesis here could be, "By moving product reviews above the description, we expect a 10% increase in add-to-cart rate because customers will see social proof earlier in their decision process." This identifies the change (review placement), the metric (add-to-cart rate), and the reasoning (earlier access to social proof). Unlike vague statements like "let's test different review layouts," this format creates actionable tests. Setting numerical targets (10% increase) predicts both the direction and magnitude of improvement, making test results easier to evaluate.
Sample size determines how many users you need to make reliable
The essential factors in sample size calculation include your baseline
Similarly, detecting smaller improvements requires larger sample sizes than spotting major changes. For example, testing a major change, like extending a free trial from 7 to 30 days, might need only 5,000 visitors per variation because it could drive a big improvement. However, testing a
Imagine flipping a coin 10 times and getting 6 heads. Does this mean the coin favors heads? Probably not — this small difference could be random chance. But if you flip it 1000 times and get 600 heads, that's more convincing evidence of a real pattern. Statistical significance works the same way in
The p-value is your risk of being wrong. A p-value of 0.05 (which equals 95% confidence) means there's a 5% chance that the difference between A and B versions is just random luck. Think of it like a weather forecast — if there's a 5% chance of rain, you probably don't need an umbrella. Similarly, if there's only a 5% chance that your test results are random (p-value = 0.05), you can feel confident about implementing the winning version.
Most product teams aim for a p-value less than 0.05, meaning at least 95% confidence in the results. A higher p-value like 0.2 means a 20% chance of random results — too risky for making important product decisions. Running tests longer and testing bigger changes typically leads to lower p-values and more reliable results.[1]
A control group in
Let's say you're testing a new checkout flow. Your current single-page checkout has a 25%
Traffic splits can vary based on risk. Testing a major change like a new pricing strategy? Use a 90/10 split (9,000 users see the current prices, 1,000 see new prices) to limit potential revenue impact. Testing a minor copy change? Stick with 50/50 to get results faster. Just don’t change these splits mid-test as they can skew your results.
While
A multivariate test for just these two elements creates four variations: blue button with “Buy Now,” blue with “Purchase,” green with “Buy Now,” and green with “Purchase.” This approach helps identify not just which elements perform better individually, but also how they interact. For example, green might work better with “Buy Now” while blue performs better with “Purchase.”
The trade-off is sample size — each added variable multiplies the required visitors. With our example's 4 variations, you need 4 times as many visitors as a simple A/B test to reach statistical significance. This means multivariate tests work best on high-traffic pages where you can gather enough data within a reasonable timeframe.
Test duration determines how long an
A good test duration covers at least one full business cycle, typically 1-2 weeks minimum. For example, an e-commerce site sees different shopping patterns between weekdays and weekends — stopping a test after just 3 weekdays would miss weekend behavior. Similarly, a B2B product should test through both peak and quiet business hours to capture all user patterns.
Seasonal events also significantly impact test timing. Running a
Segment-based testing reveals how different user groups respond to the same change. While overall test results might show a positive impact, breaking down the data by segments often uncovers important nuances.
Common segments to analyze include:
- Device type (mobile/desktop)
- User type (new/returning)
- Traffic source (organic/paid)
- Geographic location
For instance, a navigation change might show a 10% overall improvement in click-through rate, but segment analysis reveals it's actually helping desktop users (+20%) while hurting mobile users (-5%). This insight helps you make more nuanced implementation decisions.
Testing segments requires larger sample sizes since you're effectively running multiple tests. For meaningful segment insights, each segment needs enough traffic to reach statistical significance. Running segment analysis on small segments like "mobile users from Canada using Safari" often leads to inconclusive results due to insufficient data.
Test prioritization helps you decide which A/B tests to run first when there are multiple testing ideas. Using a structured approach prevents wasting time on low-impact tests or running too many tests simultaneously.
The most effective framework to use here is PIE, where:
- Potential measures the possible improvement a test could bring. A
checkout flow redesign might have high potential (30% conversion increase) while a minorcolor change has low potential (1-2% improvement) - Importance considers traffic volume and business value — testing a high-traffic homepage brings faster insights than testing a rarely-visited support
page - Ease evaluates implementation time and technical complexity
For example, when choosing between testing a new
Interpreting
- Check statistical validity: Start by confirming your test reached statistical significance (95% confidence) and ran for a full business cycle. A test showing 90% confidence after just two days isn't reliable enough for decision-making. Look at your sample size — did you get enough traffic in both the control and test groups?
- Examine primary metrics: Look at your main success metric from your hypothesis. For example, if you predicted your new
checkout design would increaseconversion rate by 15%, check the actual numbers. Did version B achieve a 14% increase? That's close enough to call it successful. Did it only achieve 2%? That might not be worth the implementation effort. - Review secondary impacts: Sometimes improvements in one area create problems elsewhere, so check related metrics that might be affected. For a checkout test, this could be average order value, support ticket volume, time to complete checkout, and cart abandonment rate.
Pro Tip: Document both positive and negative impacts of each test — they help inform future test hypotheses and prevent repeating mistakes.
References
- A/B Testing: A Guide You’ll Want to Bookmark | A/B Testing Software
Topics
From Course

Share


Similar lessons

Analytics Strategy & Planning
Data Collection & Tracking
