Experimentation Metrics
Build measurement frameworks that turn experiments into practical product insights
Experimentation metrics are essential tools for making smart product decisions based on real data rather than assumptions. These metrics help teams test their ideas and learn what works. Some metrics show immediate results (like clicks or engagement), while others reveal long-term impacts (like retention or revenue). The early signals, called leading indicators, let teams quickly adjust their approach instead of waiting weeks for final results from lagging metrics.
A well-designed metrics framework creates fast feedback loops that speed up learning and reduce wasted effort. Knowing which metrics matter at each stage helps teams avoid tracking meaningless numbers and focus on measurements that actually connect to their goals. The best approach combines hard numbers with customer feedback to guide product improvements while staying aligned with bigger business objectives. By measuring the right things at the right times, teams can make confident decisions about what to build next.
Product experiments are structured tests that help teams make evidence-based decisions by comparing different solutions against specific hypotheses. Rather than relying on opinions or assumptions, experiments provide empirical data about how changes affect user behavior and business outcomes.
A well-designed experiment includes:
- A clear hypothesis
- A control group (users experiencing the existing version)
- An experimental variant (users experiencing the new version being tested)
- Pre-determined success metrics
- Appropriate sample sizes (number of users in the experiment)
The hypothesis should follow an "If we [make this change], then [this metric] will [increase/decrease] because [reasoning]" format, ensuring the experiment has a clear purpose and measurable outcome.
Experiments can range from simple A/B tests comparing two versions to multivariate tests examining multiple variables simultaneously. They help reduce risk by validating ideas before full implementation, prevent costly mistakes, and create a culture of continuous learning. Organizations with mature experimentation practices typically make faster progress because they can quickly separate effective ideas from ineffective ones.
Leading indicators are early signals that help predict the final results of your experiments. Think of them like checking if seeds are sprouting rather than waiting for the full harvest. These early metrics let teams learn faster without waiting weeks for final business results.[1]
Good leading indicators have a clear connection to your end goals. For example, if you want to increase purchases (your final goal), you might track "add to cart" clicks as a leading indicator. More people adding items to their cart today often means more purchases tomorrow. When choosing these indicators, look at your past data to find which early user actions best predict your desired outcomes.
Leading indicators are especially helpful when your main goal happens rarely or takes a long time to measure. By watching these early signals, you can quickly spot which experiment versions show promise, stop unsuccessful tests sooner, and run more experiments in less time. This faster feedback cycle helps teams learn and improve products much more efficiently.
Pro Tip: Regularly check that the leading indicators do indeed predict later behavior. The relationship between leading indicators and ultimate outcomes can shift over time as user behavior or product dynamics change, requiring periodic validation of these correlations.
Every experiment needs clear measurement priorities to avoid conflicting signals and misinterpretation of results. Your primary metric is the main measurement that determine if an experiment succeeds or fails, directly tied to your hypothesis and business objectives. Secondary metrics provide additional context but don't determine the experiment's outcome. For instance, if your experiment aims to increase checkout completion, conversion rate would be your primary metric while metrics like product split or cart total/average order value might be secondary. This distinction helps teams make clear decisions even when metrics move in different directions.
Secondary metrics can also be considered health metrics that serve as guardrails and diagnostic tools that help explain why your primary metrics changed. They ensure your experiment doesn't improve one aspect at the expense of others and provide insights into the mechanisms behind observed changes.[2] This dual approach helps teams understand not just if their experiment worked, but why it worked and what trade-offs occurred.
Confidence thresholds determine how certain you need to be before declaring an experiment successful. While the standard 95% confidence level is common, the appropriate threshold should vary based on the risk and impact of implementation decisions. Higher-risk changes warrant stricter confidence requirements, while lower-risk experiments can use more relaxed thresholds.
When setting confidence thresholds, consider both the potential downside of being wrong and the opportunity cost of waiting longer for higher confidence. For critical flows like
Many organizations adopt a tiered approach to confidence thresholds based on experiment context. This flexible framework balances speed and certainty while reducing the risk of false negatives, potentially valuable changes that never reach traditional significance levels. Remember that every decision has two potential errors: implementing ineffective changes or missing valuable opportunities by being too cautious.
Standardized metrics give consistency across experiments, so results stay comparable over time. In a project management app, teams might always track metrics like
Customized metrics focus on the exact hypothesis being tested. In the same project management app, an onboarding experiment might track “time to first task created.” A collaboration feature experiment might track “number of tasks edited by more than one user per project.” These metrics tie directly to the feature’s goal and often show changes that broad engagement numbers won’t.
Strong experimentation programs use both. They track a small set of standardized metrics across every experiment to keep alignment, and they add custom metrics when testing a specific feature or flow. This way, teams stay consistent while still measuring what matters for each test.
There are two types of experiment results: those we can see right away and those that take weeks or months to show up. Short-term metrics like click-through rates or time-on-page provide quick feedback on immediate user reactions, while long-term metrics like
The challenge with measuring long-term effects is that they require extended observation periods and can be influenced by many external factors beyond your experiment. Holdout groups solve this problem by maintaining a small percentage of users on the original (control) experience even after the experiment concludes and the new version is rolled out to most users. This approach creates a clean comparison group for measuring sustained impact over months rather than days.
Some product changes show positive short-term effects but negative long-term consequences, or vice versa. For example, an aggressive promotion might boost immediate conversion while hurting long-term retention. By establishing a balanced measurement framework that tracks both immediate and delayed effects, teams can identify these trade-offs and optimize for genuine, sustainable improvement rather than temporary shifts in behavior.
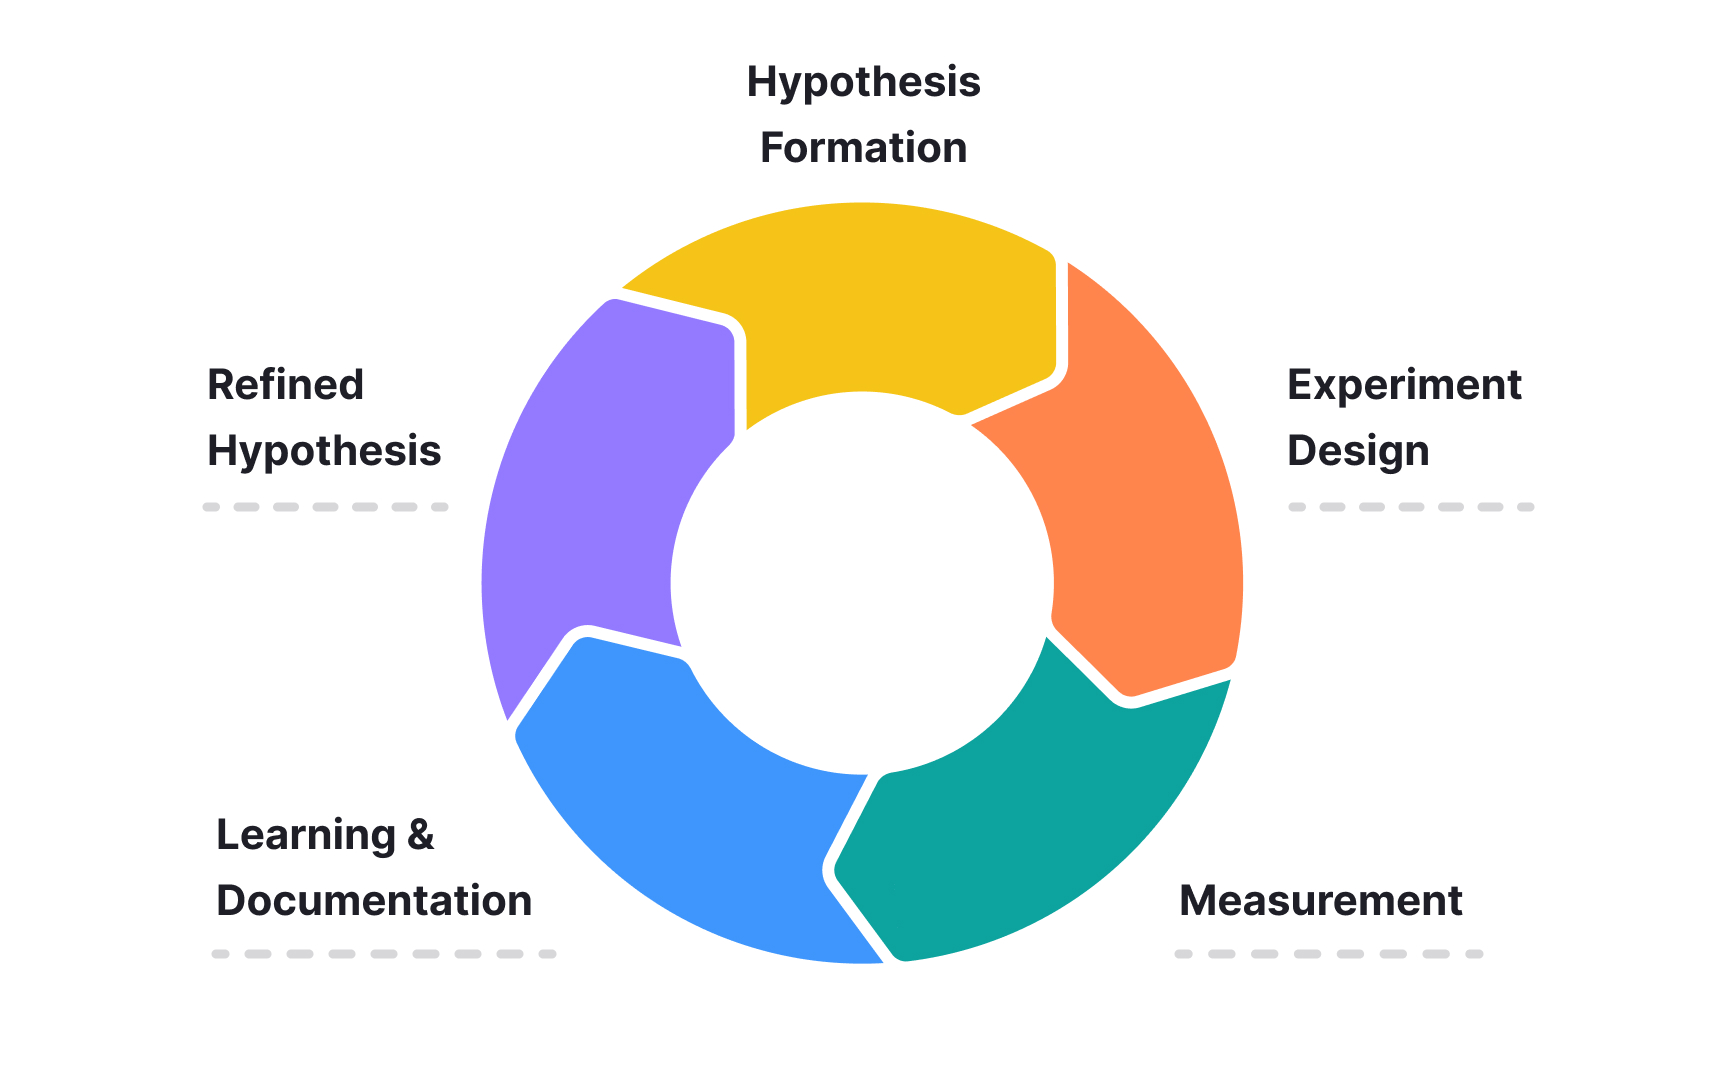
Iterative experimentation frameworks transform isolated tests into cohesive learning cycles that build upon each other. Unlike one-off experiments, iterative approaches use learnings from each experiment to inform subsequent hypotheses, creating a continuous feedback loop that drives progressive improvement. This systematic method helps teams converge on optimal solutions faster than traditional A/B testing alone.
A well-designed iterative framework follows a consistent process: formulating specific hypotheses, designing experiments to test them, measuring results using predetermined metrics, and documenting insights regardless of outcome. By maintaining this structured approach, teams can build an evidence library that reduces repeated mistakes and accelerates discovery of effective patterns. This documentation is especially valuable when team members change or when revisiting problem spaces months or years later.
The most effective iterative frameworks balance exploration and exploitation. Exploration experiments test novel ideas with high potential but uncertain outcomes, while exploitation experiments refine and optimize proven concepts. Maintaining this balance helps teams explore new approaches even after finding initial success.
Experiment results should feed directly into measuring progress on your objectives and key results (OKRs). This connection ensures that your testing activities contribute to strategic goals rather than just generating isolated insights. For example, imagine your company has a quarterly OKR: "Improve user engagement" with a key result of "Increase average session duration by 15%." Instead of running random experiments, you would design tests specifically targeting this metric. You might test a redesigned
Review your experiment roadmap regularly, asking: "Are we testing the right things to move our key results?" If experiments consistently fail to impact OKRs, either the experiments need redesigning or the OKRs might be unrealistic.
References
Top contributors

Topics
From Course

Share


