Landing page for the event management service "Takimi"


How do users "hire" events?
What are users offered by competitors?
Do competitors' solutions completely solve users' "pains"?
These and many other hypotheses I decided to test by creating the design of the "Takimi" service. In this case study, I mapped the entry point of a user's "journey" to a dream event.
As the first block of the website I used an invitation to buy tickets of one of the music bands presented in "Takimi". According to my hypothesis - this will solve a business problem, such as increasing the number of registrations in the service. And it will also help to increase ticket sales


Next, I decided to bring out a few of the events that have already been created and trigger the desire to move on to the full list of events. From a business point of view this can increase the number of registrations (in my opinion this metric is very important in this business)

As positive reinforcements, I decided to add brief information about the service, testimonials and the option to join the Facebook group


And now that you've spent so much of your valuable time studying this case study - a quick word about color choice!
"Color-boss" I have #7E58C6 - purple color. It is associated with the care with which organizers create events and versatility - in "Takimi" you will find events for all tastes!
And a little "Takimi" so you don't think I'm fantasizing:)


Thanks for your time!:)
Reviews
2 reviews

Vlad, your project idea is interesting but there are some major issues that I think needs your attention.
First of all, the design brief lacks clarity and focus, with a disjointed structure that doesn't effectively communicate user needs or justify design decisions. To improve, you clearly define the problem and objectives, justify design choices with data, and ensure a logical, user-centered flow that aligns with business goals. (Use uxcel's own case study guide which is available for figma too.)
If I didn't leave anything out, these small issues were what stood out the most for me:
Lack of Visual Hierarchy: Important elements like the "Buy Ticket" button are not prominent. Use size, color, and placement to highlight key actions.
Cluttered Layout: The design feels cramped with insufficient spacing. You can add white space and group-related information to improve navigation.
Inconsistent Color Use: The color palette lacks clear purpose, I can't really tell which is your accent color or even what is your brand color. Try establishing a consistent color system for different UI elements.
Poor Readability: Low contrast makes some text hard to read. Increase contrast, especially for critical text like buttons. Use figma's a11y plugin or stark plugin.
Navigation & Interaction Issues: Elements are not easily distinguishable, and interactive states are unclear.
Overwhelmed by information: Too much information overwhelms users, canban board needs a bit fixing, prioritize key info and use progressive disclosure.
Typography Inconsistencies: Inconsistent font usage disrupts reading flow. Standardize typography with a clear hierarchy.
Keep up the good work!
That's an interesting idea for a case study. However, I agree with the comments of a previous expert that it's a bit hard to follow. I'd suggest adding more spacing and section titles to clarify to the reader what you're talking about. Maybe start with more information about the product - what is it about? What problems does it aim to solve? Then you can move on to the next part of your research.
What caught my eye are some issues with the microcopy. It's confusing. For example, I'd recommend distinguishing buttons "Sign In" and "Sign Up" - they sound too similar and it might take users some time to realize where they need to go. "Log In" and "Sign Up" are easier, but "Log In" and "Join" or "Register" would be even better. I'd also recommend checking the spelling in the copy.
The dashboard with tasks and proposals lacks clarity - there's too much going on and no dividers. It's hard to follow. Adding dividers between columns and maybe adding containers for each item might help. Anyway, thank you for sharing.
You might also like
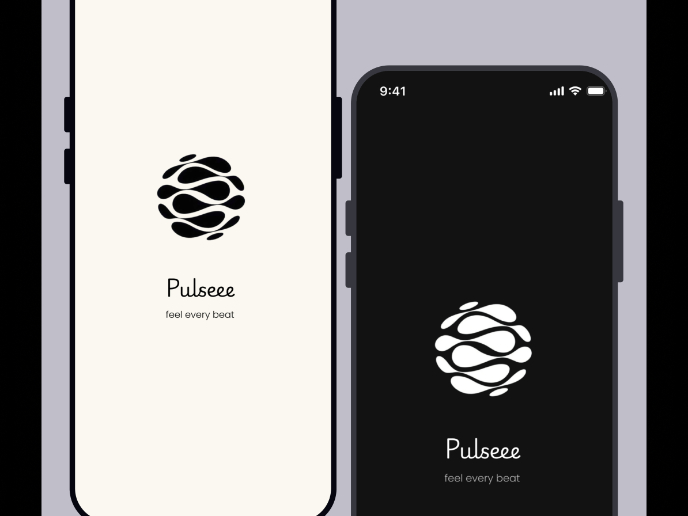
Pulse — Music Streaming App with Accessible Light & Dark Mode
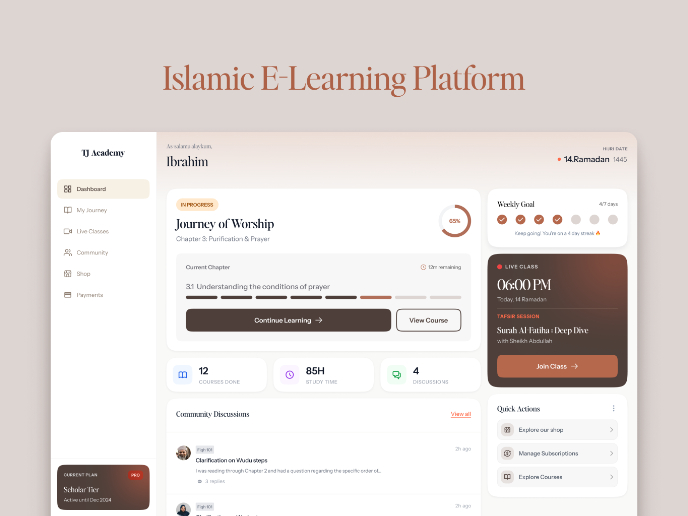
Islamic E-Learning Platfrom Dashboard

SiteScope - Progress Tracking App

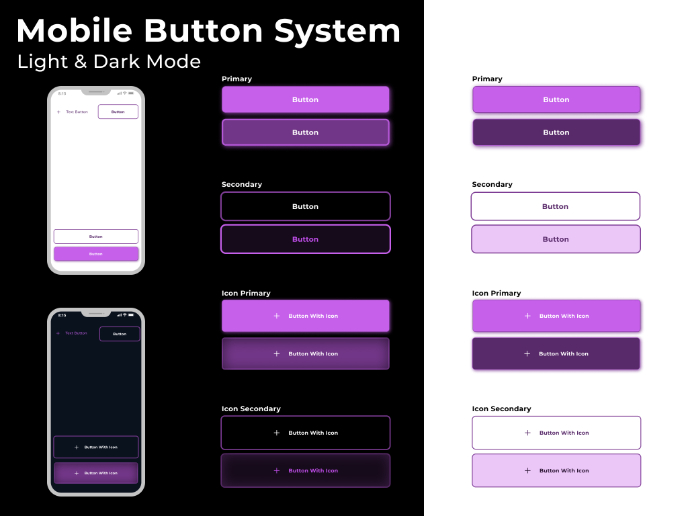
Mobile Button System
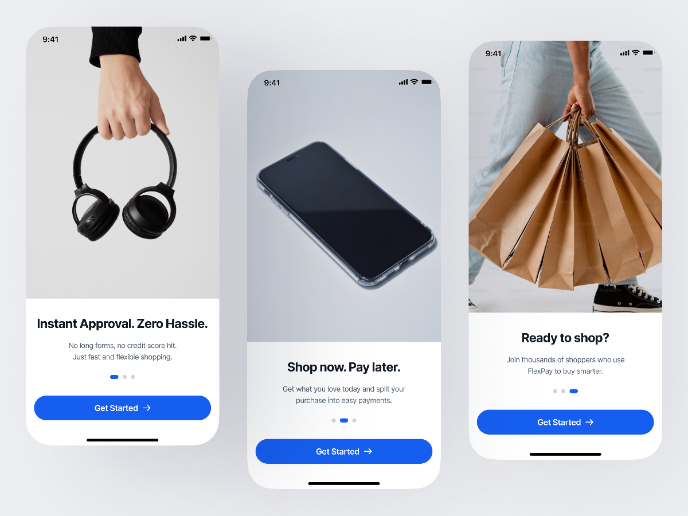
FlexPay

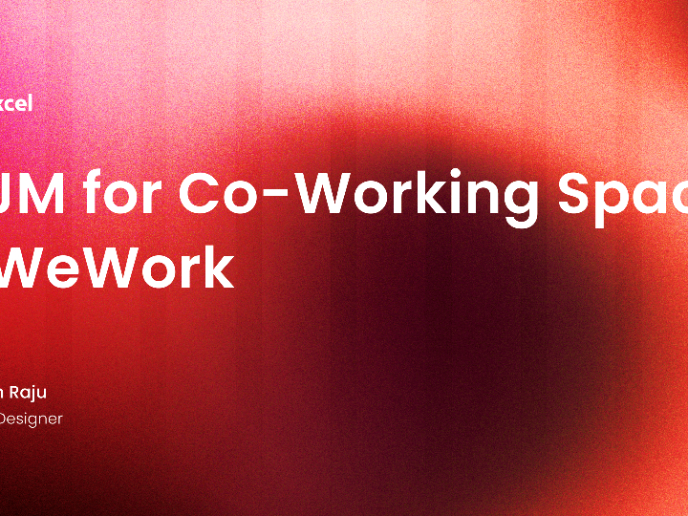
CJM for Co-Working Space - WeWork

Popular Courses

UX Design Foundations


Introduction to Figma

Design Terminology
