Environment & Sustainability
Discover ways to reduce environmental impact through conscious design and development choices
Digital products consume real resources despite their intangible nature. Every click, scroll, and data transfer requires energy from servers and devices, contributing to the internet's massive carbon footprint. In fact, the digital sector ranks among the world's top polluters, with data centers consuming enormous amounts of electricity and electronic waste mounting from outdated devices.[1]
Product teams shape these environmental impacts through daily decisions about features, architecture, and infrastructure. Balancing user expectations, business goals, and environmental responsibility creates genuine tension. Sustainable choices sometimes mean higher upfront costs, technical constraints, or features that perform differently than users expect. There's no simple formula for building responsibly while meeting market demands. Product teams must navigate tradeoffs between performance, sustainability, and profitability while understanding how design and development decisions ripple through infrastructure, user devices, and planetary resources.
Every digital interaction generates carbon emissions through the energy required to power servers, transmit data, and run user devices. A single email produces roughly 4 grams of CO2, while streaming an hour of video can generate up to 55 grams. These numbers seem small individually, but scale massively across billions of users and interactions daily.
Measuring your product's carbon footprint starts with tools like Website Carbon Calculator, Ecograder, or cloud provider dashboards that estimate emissions based on data transfer and server usage. While measurements aren’t very precise, they reveal patterns. Track data transfer per user session, server processing time for key features, and infrastructure energy consumption.
Focus on high-traffic areas first since they multiply impact across your user base.Use this baseline to identify optimization opportunities. Heavy homepage assets that load on every visit create more impact than rarely-accessed features. Auto-playing videos and uncompressed images are common culprits. Product teams can prioritize reducing carbon in areas that also improve performance, creating alignment between environmental and user experience goals. The goal isn't perfect measurement but understanding where your product consumes the most resources.
Infrastructure choices determine a significant portion of your product's environmental impact, yet these decisions often happen early in development when sustainability isn't prioritized. Cloud providers vary dramatically in their energy sources and efficiency. AWS, Google Cloud, and Azure all publish sustainability reports, but their actual carbon intensity differs by region and service type. A product hosted in Virginia might run on coal power while the same setup in Oregon uses hydroelectric energy.
Evaluate providers during initial setup when switching costs are low. Google Cloud and Azure have committed to carbon-neutral operations, while AWS offers renewable energy matching in select regions. Review their sustainability
Moving infrastructure after launch is expensive, so make informed decisions early. If you've inherited infrastructure, optimize within current constraints by consolidating services, eliminating unused resources, and selecting greener regions for new deployments. Use tools like Cloud Carbon Footprint to monitor emissions across your infrastructure. Small changes like moving storage to regions with better renewable energy can reduce impact without major migration projects.
Design decisions directly affect how much energy products consume on user devices and servers. Auto-playing videos, infinite scroll, animated backgrounds, and high-resolution
Start by auditing resource-heavy patterns in your product. Lazy load images so they only download when needed. Replace auto-play videos with click-to-play thumbnails. Simplify animations or make them optional. Use image compression tools to reduce file sizes without noticeable quality loss. Choose appropriate image formats — WebP typically outperforms JPEG and PNG for web use.
Balance
When apps require the latest processors, maximum RAM, or the newest operating systems, older devices become obsolete, not because they're broken but because software excludes them. This creates a cycle where perfectly functional hardware ends up discarded because products won't run on it anymore.
Supporting older devices requires testing on legacy hardware and optimizing for lower specifications. Implement progressive enhancement where core functionality works everywhere while advanced features activate on capable devices. Use feature detection rather than assuming all users have the same capabilities. Provide settings that let users on older devices disable resource-intensive features like
Balance backward compatibility with innovation by defining a support window based on actual usage data. If less than 5% of users have devices older than 3 years, supporting beyond that point offers diminishing returns. Focus optimization efforts on the device generations that represent your primary user base, ensuring the product performs well for most people rather than barely running on everything.
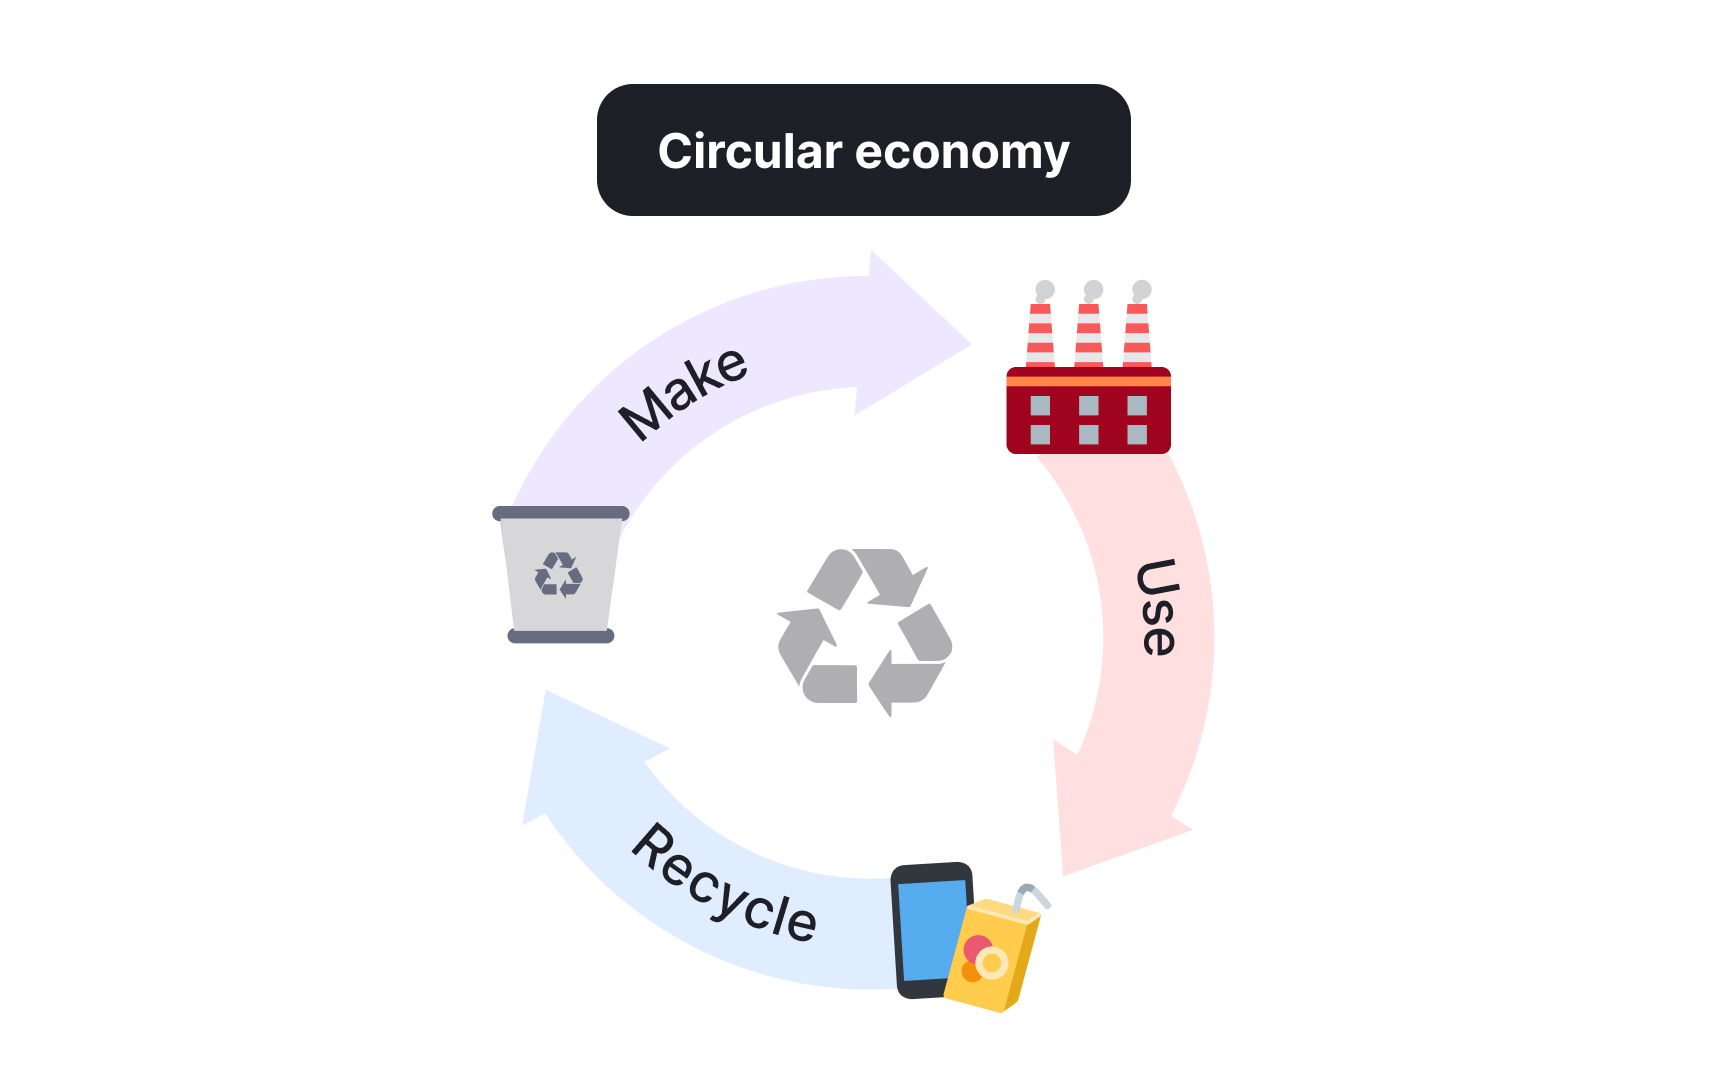
Circular economy principles keep resources in use through reuse, repair, and data portability rather than disposal. For digital products, this means letting users export their data, transfer accounts, and preserve content when switching platforms. Implement data export features that provide complete information in standard formats like JSON or CSV that users can actually use elsewhere. GDPR mandates basic portability[3], but going beyond compliance creates genuine user value.
Build export functionality that handles edge cases and large datasets properly. Test with real user data to ensure exports complete successfully and include all relevant information. Provide clear documentation about what's included and how to use exported data. Users who know they can leave easily often stay longer because they feel in control.
Web hosting providers vary in environmental impact based on energy sources and infrastructure
Research provider sustainability claims by reviewing their published reports and certifications. Look for providers that use actual renewable energy rather than just purchasing offsets. Check region-specific energy sources since the same provider may use different energy in different locations. Compare environmental credentials alongside traditional factors like performance, features, and cost.
If switching providers isn't feasible, optimize within your current infrastructure. Consolidate services to reduce server count, eliminate unused resources, and choose regions powered by renewables when available. Use CDNs to reduce data transfer distances. Implement caching strategies that reduce server requests. Small optimizations across existing infrastructure can significantly reduce impact without major migrations.
Minimizing data transfer reduces energy consumption across servers, networks, and user devices. Compress
Audit API responses to eliminate unnecessary data. Return only the fields clients actually need rather than entire objects. Implement pagination for lists instead of returning thousands of records at once. Use compression for API responses and review your largest, most frequently called endpoints first since optimizing them provides the biggest impact across your user base.
Balance optimization with development velocity by building
Tracking environmental impact starts with metrics that connect to actions you can take. Data transfer per session provides a measurable baseline that correlates with carbon emissions and performance. Use analytics to track total bytes transferred, broken down by feature or page. Monitor trends over time to catch regressions when new features ship. This metric is accessible through standard analytics tools and directly actionable through optimization.
Implement carbon estimation tools like Website Carbon Calculator or cloud provider sustainability
Report sustainability metrics alongside traditional product metrics in dashboards and reviews. Frame environmental data in business terms stakeholders understand. For example, “Data
Climate-positive features actively contribute environmental benefits rather than just reducing harm. Implement eco-mode
Provide visibility into environmental impact through carbon tracking or sustainability metrics displayed to users. For example, Ecosia shows trees planted per search.[5] This awareness encourages sustainable behaviors while reinforcing your product's values. Keep messaging informative rather than preachy — show data and let users draw their own conclusions.
Consider carbon offset programs or partnerships with environmental organizations. Some products plant trees, invest in renewable energy, or contribute to climate projects based on usage. These initiatives create tangible environmental benefits while building brand differentiation.
References
- Art. 20 GDPR – Right to data portability - General Data Protection Regulation (GDPR) | General Data Protection Regulation (GDPR)
Topics
From Course

Share


