Design Audit Preparation Phase
Build systematic frameworks for design audit documentation and data collection.
Design systems evolve rapidly, leaving scattered documentation and inconsistent tracking methods in their wake. Even the most meticulous design decisions blur over time without proper documentation frameworks.
Think of audit documentation as a design system's health record. It reveals patterns, flags inconsistencies, and identifies growth areas that might otherwise go unnoticed. From tracking component variations to mapping interaction patterns, these frameworks eliminate guesswork from design evaluation. Solid documentation structures also break down communication barriers between designers, developers, and stakeholders, creating a shared understanding of design system health. While gathering evidence through templates and checklists might seem mechanical, it actually liberates creative thinking by establishing clear baselines for improvement.
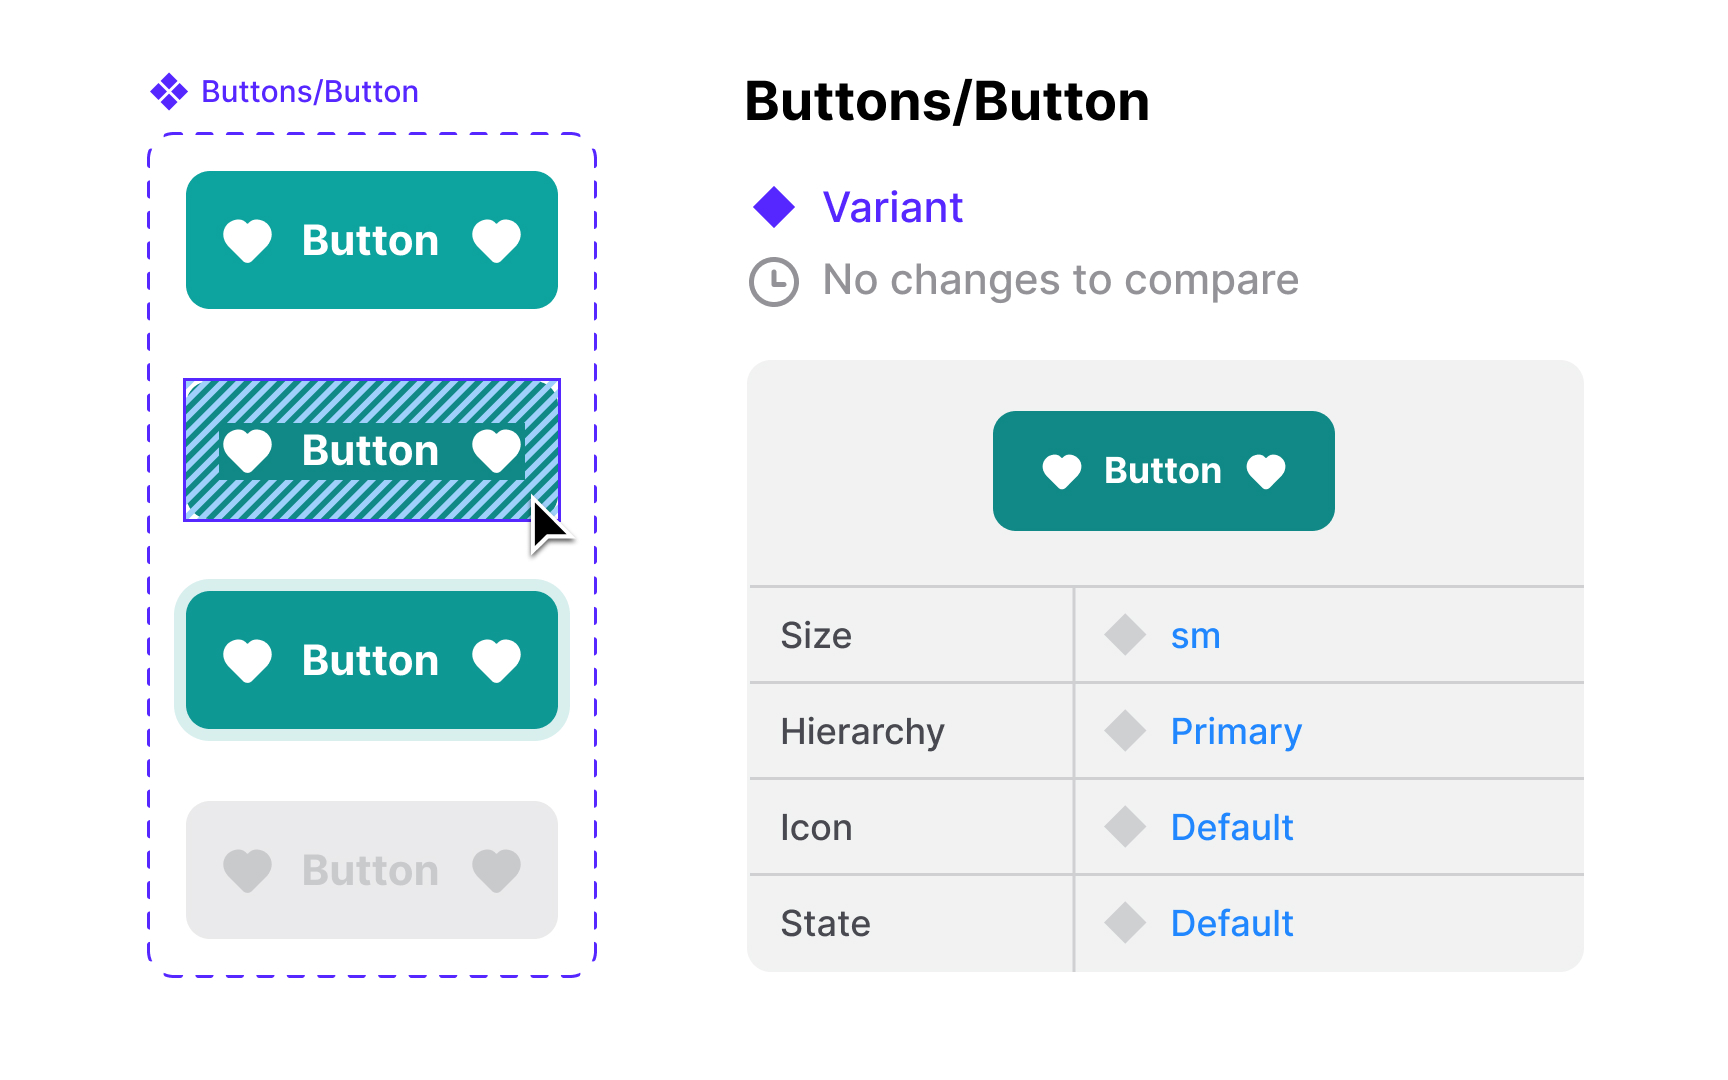
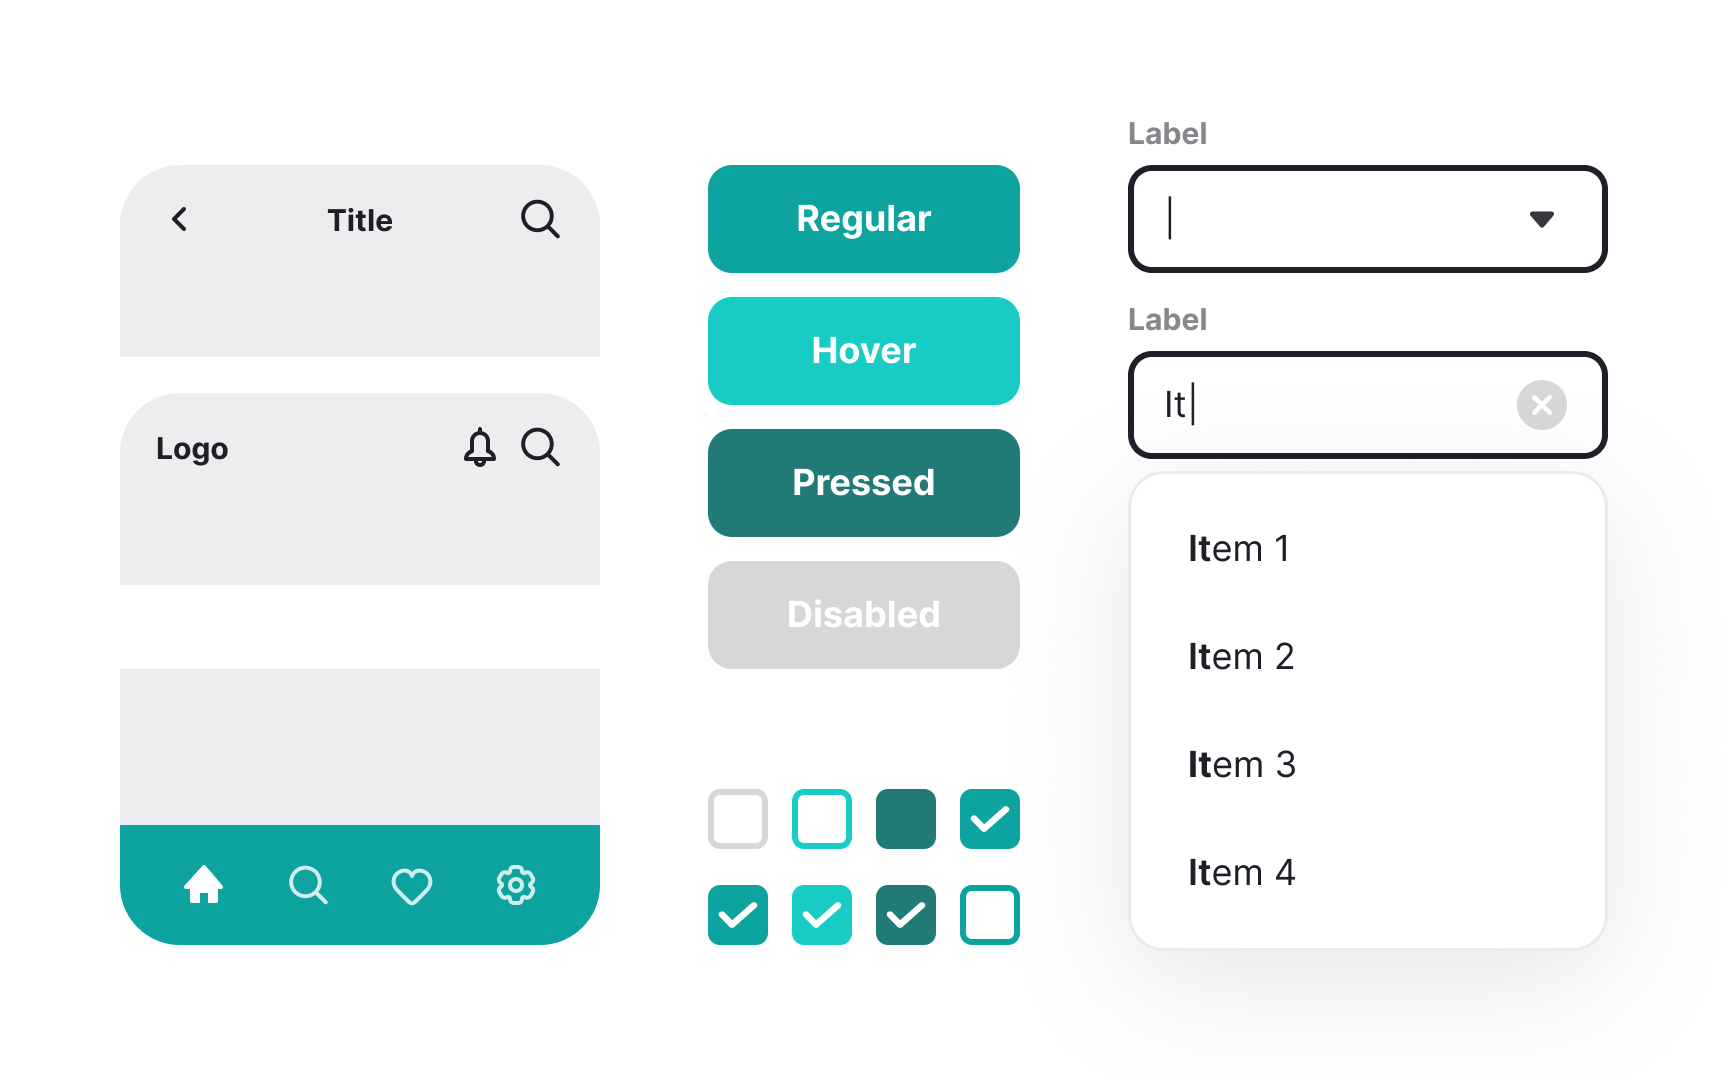
Component inventories bring clarity to complex
Key focus areas:
- Classification methods: Organizing components into logical categories based on function and complexity
- Component metadata: Recording states, variants, usage rules, and dependencies
- Status tracking: Monitoring implementation state, deprecation status, and adoption rates
- Usage patterns: Documenting where and how components are implemented across products
- Health indicators: Tracking maintenance needs, technical debt, and update requirements
Pro Tip: Create a simple health scoring system for components (e.g., 1-5 scale) to quickly identify which parts of your design system need immediate attention.
Usability evaluation frameworks turn complex user interactions into clear, measurable data points. Using industry-standard tools like Nielsen's heuristics, cognitive walkthroughs, and task analysis methods, teams can consistently evaluate how well interfaces serve their users.
Key focus areas:
- Evaluation criteria: Setting specific success metrics like task success rate, number of clicks to completion, navigation accuracy, and form completion rates
- Behavioral patterns: Identifying common interaction sequences, preferred navigation paths, frequently abandoned journeys, and repeated action patterns
- Performance benchmarks: Measuring average task completion time, interaction speed, system response time, and learning curve indicators
- Error tracking: Monitoring input mistakes, navigation errors, form field corrections, and misclick patterns across different user segments
- Satisfaction indicators: Using metrics like SUS score, NPS rating, feature satisfaction ratings, frustration signals (rage clicks), and post-task confidence ratings
Pro Tip: Start by tracking just 3 key metrics for each interface element, e.g., completion rate, time on task, and error rate. Then expand based on specific product needs.
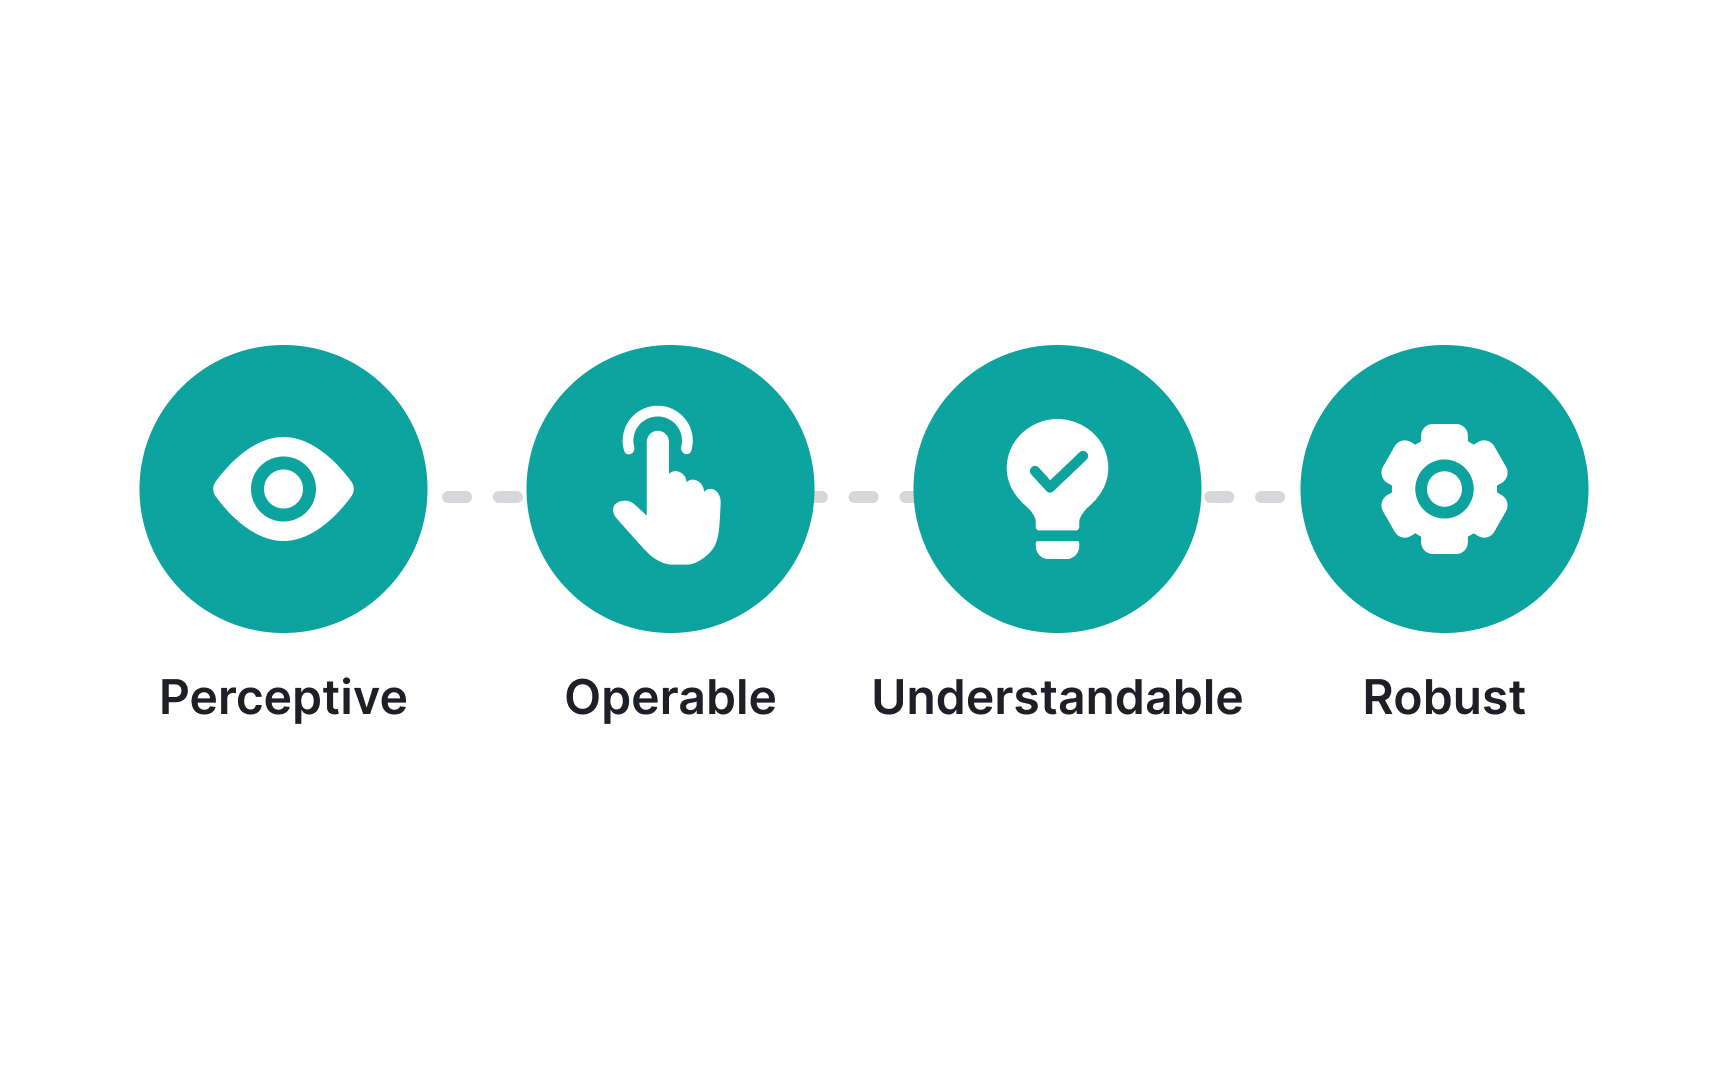
Accessibility checklists transform complex WCAG guidelines into actionable evaluation tools. Moving beyond basic compliance, these structured frameworks help catch both technical violations and
- Visual accessibility: Tracking color contrast ratios, text scaling behaviors, focus indicators, and alternative text coverage
- Keyboard navigation: Documenting focus order, keyboard traps, shortcut availability, and interactive element reachability
- Screen reader support: Testing ARIA labels, landmark regions, dynamic content updates, and meaningful sequence
- Cognitive aspects: Evaluating content clarity,
error prevention, recovery mechanisms, and timing adjustments - Media accessibility: Checking captions, audio descriptions, transcript availability, and media player control[1]
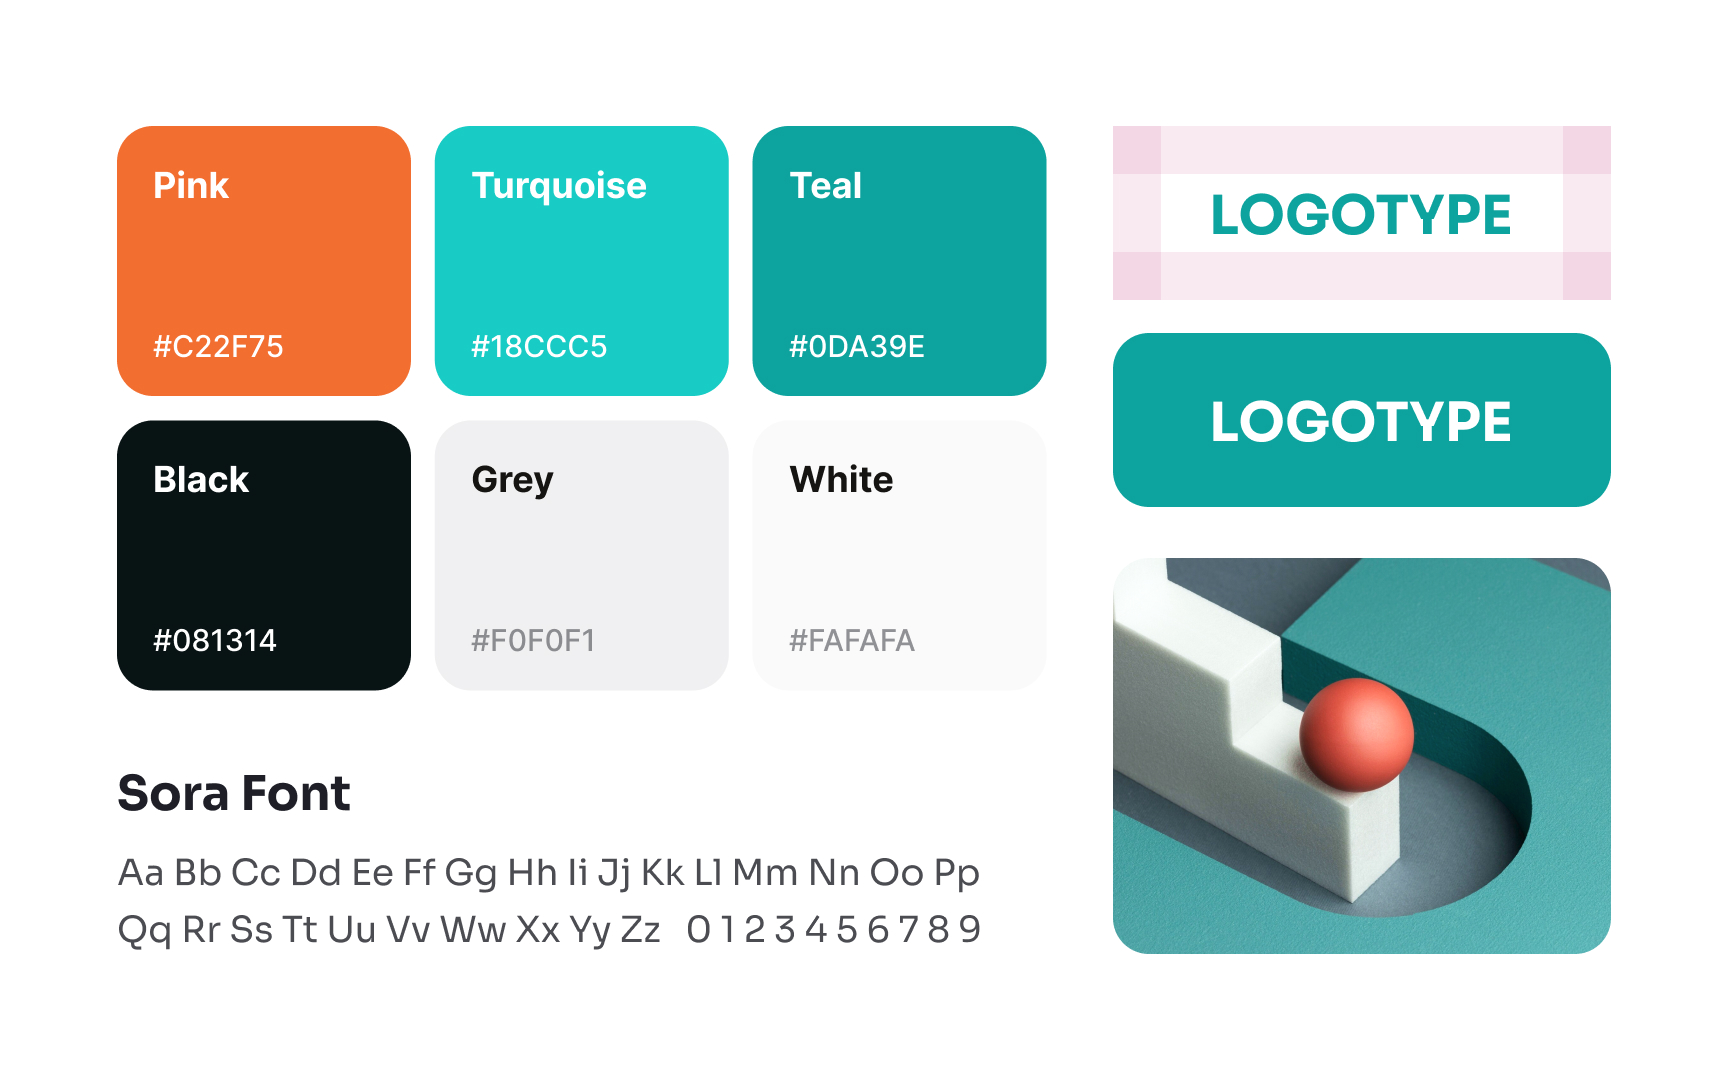
A comprehensive brand audit
- Brand values expression: Recording how interface choices reflect core brand attributes through tone,
interaction style, and visual metaphors - Visual language adherence: Monitoring consistency in
color usage, typography implementation, spacing systems, and imagery style - Component brand alignment: Tracking how
UI elements maintain brand character across different states and contexts - Content voice conformity: Documenting adherence to brand tone, terminology preferences, and communication patterns
- Experience consistency: Evaluating how well user flows and interactions align with brand personality
Pro Tip: Create a simple 3-point scale (aligned, partially aligned, misaligned) for quick brand consistency checks before diving into detailed evaluations.
Performance tracking
A thorough performance tracking system monitors crucial behavioral patterns and technical metrics:
- Core metrics: Recording First Contentful Paint, Time to Interactive, Cumulative Layout Shift, and other vital web performance signals
- Interactive elements: Measuring response times, animation smoothness, state transition delays, and
input latency - Resource efficiency: Tracking asset loading patterns, memory usage, battery impact, and network payload sizes
- Context variations: Documenting performance across different devices, network conditions, and user scenarios
- User perception: Monitoring perceived performance through
interaction success rates and user satisfaction signals
Pro Tip: Start with user-centric performance metrics (Web Vitals) as your baseline, then add specific interaction timing measurements based on your interface needs.
Effective feedback collection systems track multiple dimensions of user
- Direct communication: Gathering in-app feedback, support conversations, feature requests, and user interviews data
- Behavioral indicators: Monitoring rage clicks, hesitation patterns, repeated attempts, and alternative paths taken
- Session insights: Recording task completion rates, bounce patterns, exit points, and feature adoption trends
- Emotional signals: Capturing satisfaction ratings, frustration indicators, confidence levels, and loyalty metrics
- Contextual factors: Documenting user segments, interaction scenarios, environmental conditions, and usage patterns
Pro Tip: Combine quantitative metrics with qualitative feedback by attaching relevant user quotes to specific interface elements and interactions.
Every
A comprehensive measurement framework tracks key signals:
- Adoption metrics: Tracking how widely and correctly teams use design system components across products
- Quality indicators: Monitoring issues like
accessibility problems, performance bottlenecks, and reported bugs - Team efficiency: Measuring how the design system affects development speed and team collaboration
- System evolution: Recording how components change and improve based on real usage
- Business impact: Tracking concrete benefits like faster development and fewer inconsistencies
Pro Tip: Create composite health scores by combining related metrics. For example, merge adoption rate, implementation accuracy, and bug frequency into a component health index.
Pattern libraries go beyond simple component catalogs by documenting not just what exists, but how interface elements work together. Without proper
A thorough pattern library documentation captures essential
- Pattern relationships: Mapping component combinations,
layout principles, and common interface compositions - Interaction rules: Documenting behavior logic, state changes, transition effects, and event handling
- Context guidelines: Recording where patterns should and shouldn't be used, along with edge cases
- Responsive behavior: Tracking how patterns adapt across different screen sizes, devices, and orientations
- Nested patterns: Describing hierarchies between patterns, from basic elements to complex compositions
Pro Tip: Document not just successful pattern implementations but also common misuse cases to avoid repeated mistakes.
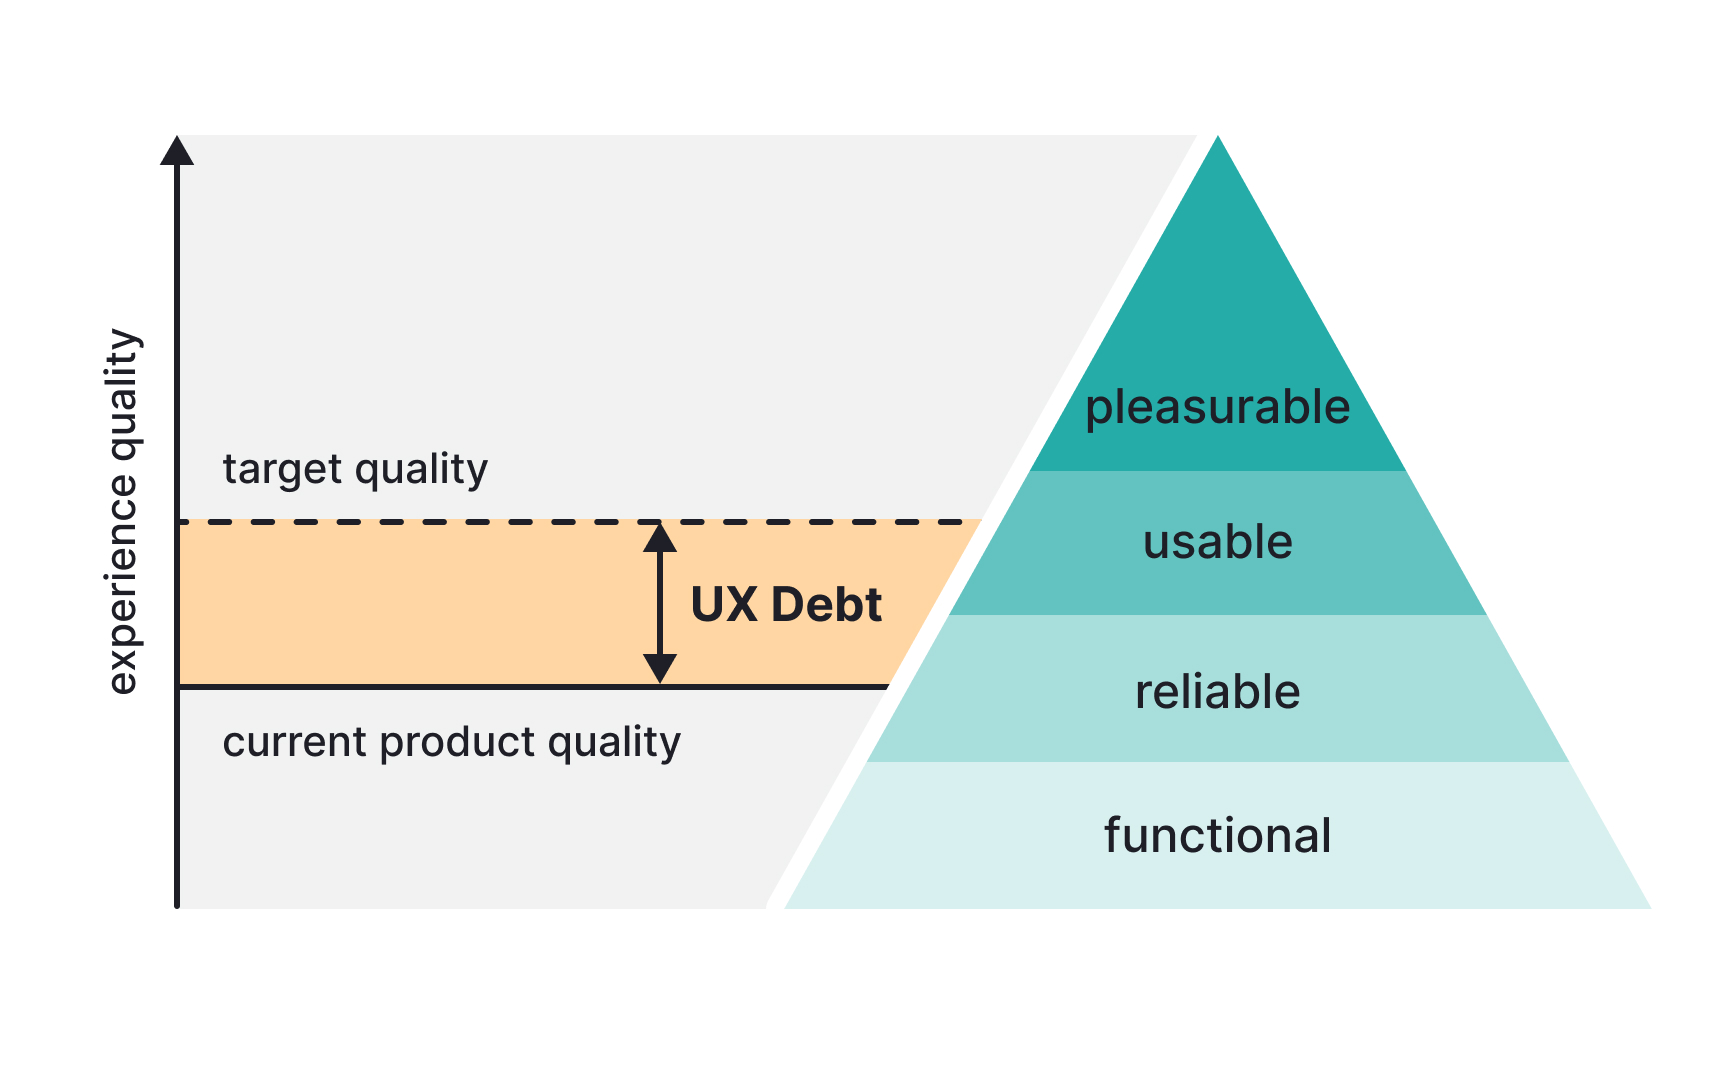
Design debt accumulates when teams make quick fixes or compromises that deviate from system standards. Without proper tracking, these small inconsistencies grow into significant maintenance challenges that affect both user experience and development efficiency.
Design debt tracking systems monitor several critical areas:
- Component variations: Documenting unofficial modifications, unplanned customizations, and divergent implementations
- Legacy patterns: Tracking outdated components, deprecated styles, and inconsistent interface solutions
- Technical impact: Measuring performance implications, maintenance overhead, and implementation complexities
- User experience: Recording inconsistent behaviors, confusing patterns, and fragmented
interactions - Migration needs: Identifying high-priority areas for cleanup, standardization opportunities, and systematic improvements
Pro Tip: Create a simple "debt score" for each deviation, combining factors like usage frequency, maintenance cost, and user impact to prioritize fixes.


Similar lessons

Introduction to Design Audits

Assumption Testing
