I = Inputs
Learn how to transform raw customer data into actionable journey insights that drive product improvements
Quality inputs determine the accuracy and usefulness of your final customer journey map. This means collecting data from multiple sources to understand what customers actually do, think, and feel at each stage of their experience. Customer interviews reveal personal stories and pain points that numbers alone can't capture. Analytics show behavioral patterns across thousands of users. Support logs highlight recurring issues. Online reviews expose unfiltered opinions.
The challenge lies in combining these diverse data types into coherent insights. Smart teams know that emotional insights matter as much as behavioral data. Understanding customer frustrations, moments of delight, and unmet needs helps create journey maps that drive meaningful improvements. The best maps balance hard data with human stories, creating a foundation for better product decisions.
Customer
Effective interviews focus on understanding experiences rather than validating assumptions:
- Prepare open-ended questions that encourage storytelling. Ask about specific situations, like "Tell me about the last time you tried to solve this problem."
- Listen for emotional cues and unexpected details. The best insights come from follow-up questions that dig deeper into initial responses.[1]
- Create a comfortable environment where customers feel heard.
- Record interviews when possible to capture exact words and emotions.
- Take notes on body language and tone. Remember that what customers don't say can be as revealing as what they do say.
These authentic stories become the foundation of meaningful
Surveys capture feedback at scale, revealing patterns across your entire customer base. While
Design surveys with journey mapping in mind:
- Time surveys to capture fresh experiences; send them within 24 hours of key customer interactions.
- Ask about satisfaction at specific touchpoints, effort required for key tasks, and emotional states during interactions.
- Mix rating scales with optional comment fields to capture both measurable data and context. Keep surveys focused and respect respondents' time.
Transform survey results into
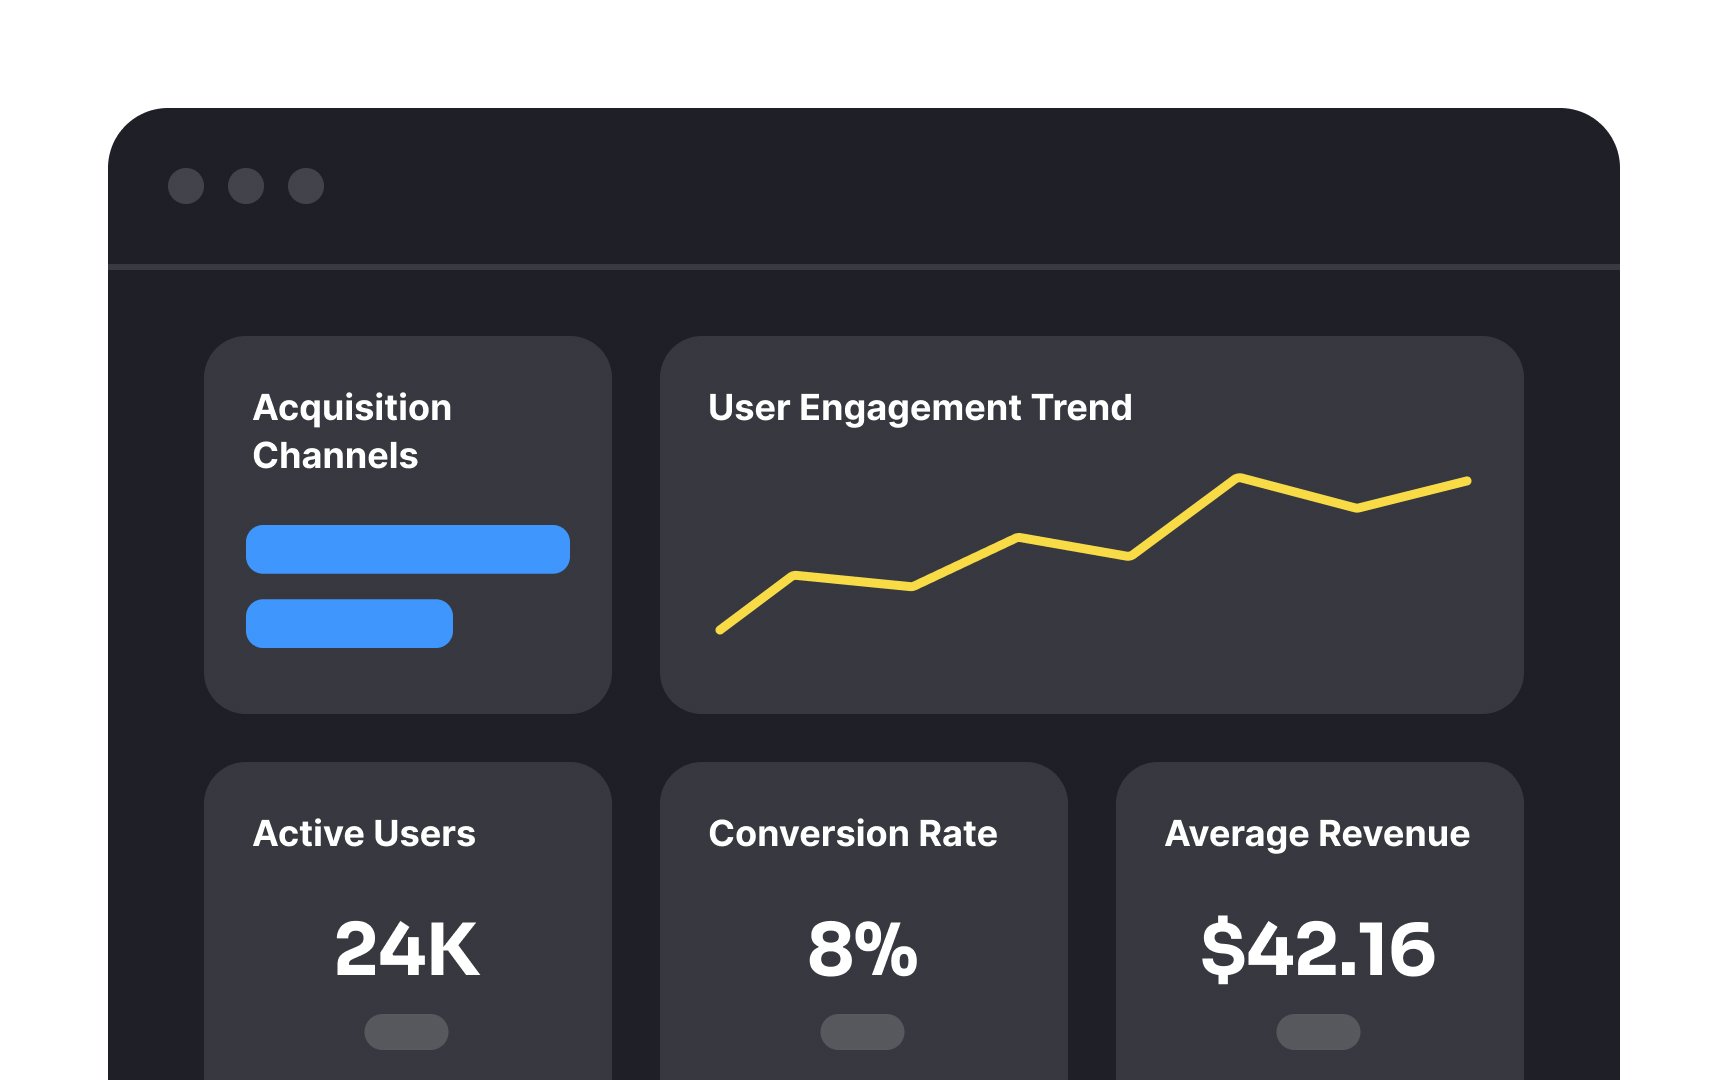
Analytics data reveals what customers actually do versus what they say they do.[3] This behavioral data shows real paths through your product, time spent on tasks, and where customers drop off. Web analytics, product usage data, and conversion funnels provide objective insights into customer journeys.
Focus on metrics that map to journey stages. Track entry points, navigation patterns, task completion rates, and exit behaviors. Look for unexpected paths that differ from your assumed journey. Pay attention to segments with notably different behaviors, as these may represent distinct journey types. It’s also important to track metrics at all moments that matter, the high-impact steps that influence whether a customer continues or drops out.
Raw analytics need interpretation to become journey insights. High bounce rates might indicate confusion or success, depending on context. Combine analytics with qualitative data to understand the why behind the numbers. Use analytics to validate
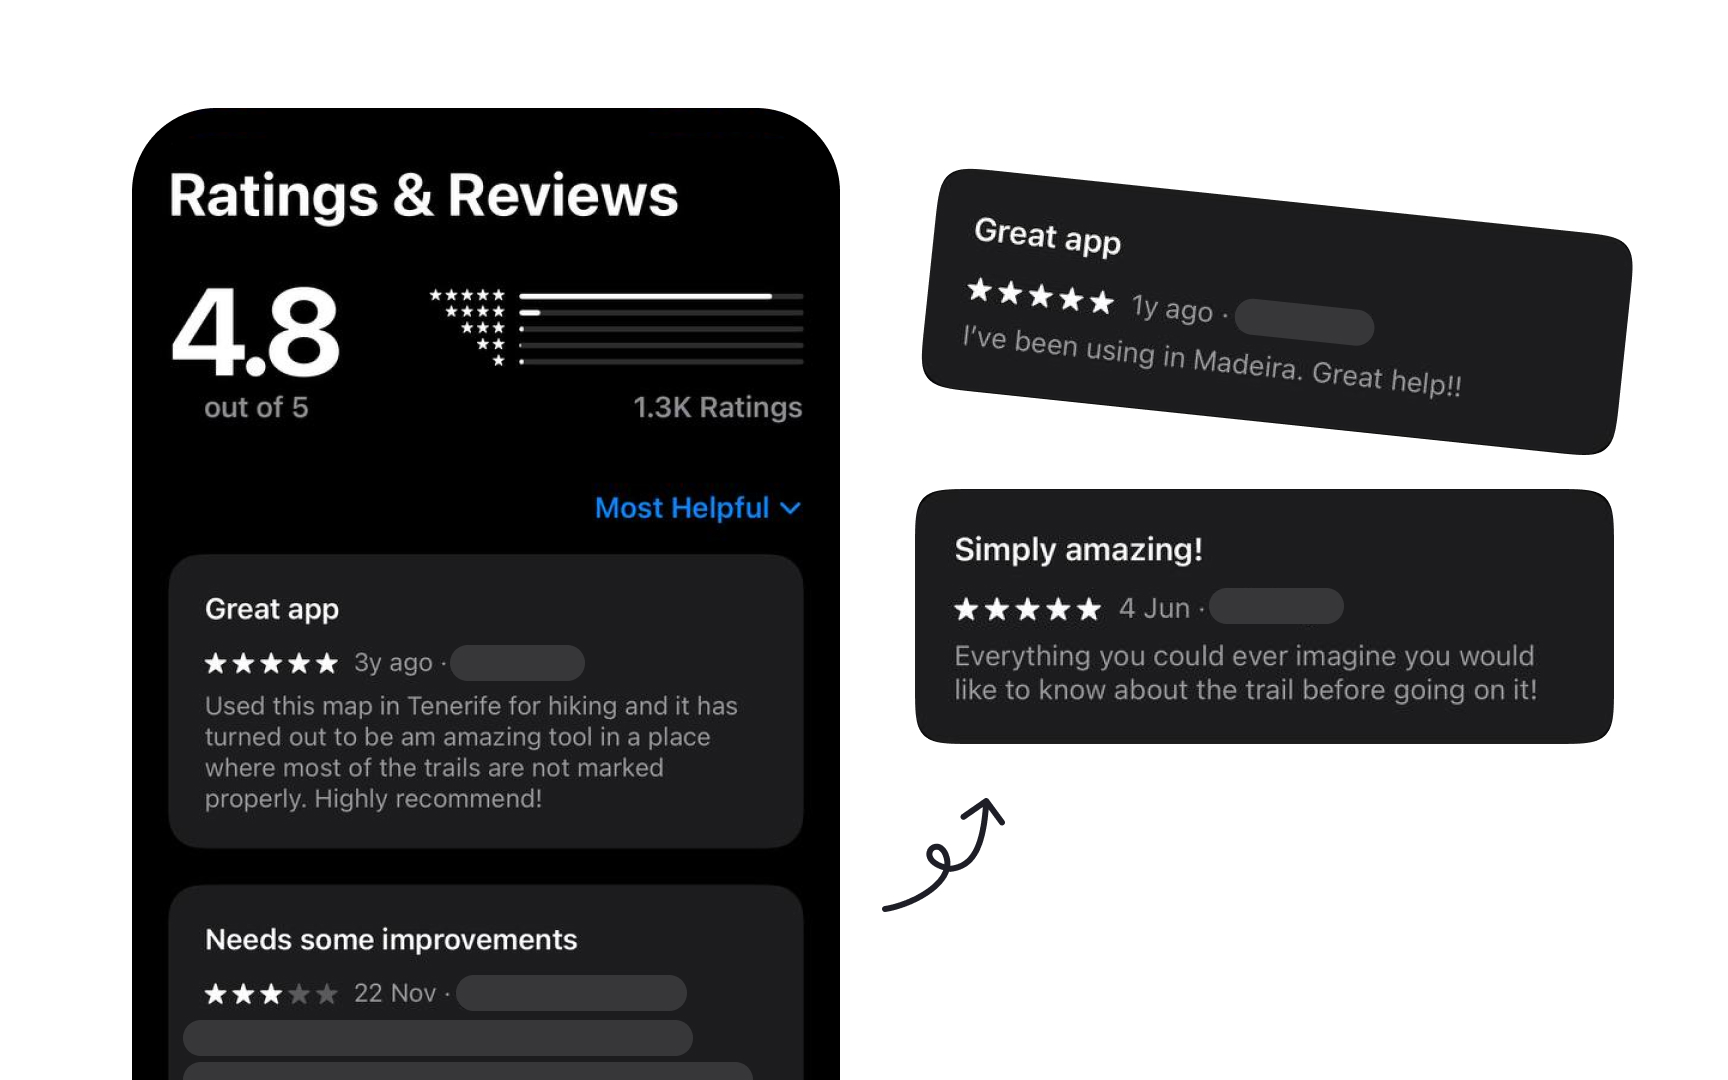
Online reviews and feedback contain unfiltered customer voices. These public comments reveal authentic experiences, both positive and negative, without the influence of direct questioning. Customers often share detailed stories about their journeys, highlighting moments that matter most to them.
Mine reviews systematically across platforms like Google, social media, app stores, and industry-specific sites. Look for recurring themes, emotional language, and specific touchpoint mentions. Pay attention to what triggers customers to leave reviews, as these represent peak moments in their journeys.
Categorize feedback by journey stage and sentiment. Extract verbatim quotes that capture key patterns. Notice gaps between your intended experience and what customers actually encounter. Reviews often expose blindspots in your understanding of the customer journey, making them invaluable for creating accurate maps.
Support logs document where customers struggle most in their journeys. These records capture real problems, questions, and frustrations at specific touchpoints. Unlike reviews, support
Analyze ticket categories, resolution times, and repeat contact rates. Look for patterns in customer language and emotional states. Track which journey stages generate the most support requests. Pay attention to problems that require multiple contacts to resolve, as these indicate significant journey friction.
Support teams possess deep customer knowledge often overlooked in
Meaningful
Start by mapping quantitative metrics to qualitative themes. If analytics show 40% cart abandonment,
Create a unified view by visualizing both data types together. Place satisfaction scores alongside customer quotes. Show conversion rates with reasons for drop-offs. This integrated approach ensures your map reflects both measurable outcomes and human experiences, leading to more actionable insights.
Not all data deserves equal weight in your
Evaluate each source for relevance, reliability, and recency:
- Check sample sizes for statistical significance. Ten customer
interviews might reveal themes, but you'd need hundreds of survey responses for reliable percentages. - Verify data collection methods for bias. For example, online reviews tend to overrepresent extremely happy or angry customers.
- Ensure temporal relevance by using recent data that reflects current customer experiences.
- Question whether your data represents all customer segments.
- When sources contradict each other, dig deeper rather than picking favorites. For example, data from power users differs from new customer experiences.These contradictions often reveal important nuances about different customer segments or journey variations.
Document data limitations openly. Note which journey stages have strong evidence versus assumptions. Identify where small samples or outdated information weakens confidence. This transparency helps teams make informed decisions and prioritizes areas needing better research. Quality beats quantity when creating actionable journey maps.
References
Topics
From Course

Share


Similar lessons

What is Journey Mapping?

Types of Journey Maps
