Analytics Strategy & Planning
Learn how to build a comprehensive analytics framework to drive data-informed product decisions
Analytics strategy transforms raw data into actionable product insights through systematic planning and execution. At its core, having a strategy aligns business objectives with measurable metrics, creating a framework for data-driven decision-making. Product teams can leverage this structured approach to define key performance indicators, establish measurement priorities, and implement tracking mechanisms that capture user behavior effectively.
A well-crafted analytics strategy identifies critical user journeys, sets clear success metrics, and anticipates future data needs while maintaining data quality and governance standards. By focusing on both quantitative and qualitative metrics, teams can gain a comprehensive view of product performance and user engagement patterns. This foundation enables organizations to move beyond basic vanity metrics, fostering a culture of continuous improvement based on reliable data insights that directly impact product development and business growth.
Analytics helps teams understand how people use their products and make better decisions based on real evidence rather than hunches. Every click, scroll, and interaction tells a story about how people experience your product. Analytics helps decode these stories by answering simple but powerful questions: What are users doing? Why are they doing it? What might they do next? This understanding helps teams focus on what matters most to users.
Analytics functions as both a diagnostic and predictive tool, helping teams identify current pain points while forecasting future trends and user needs. By systematically collecting and analyzing user data, product teams can reduce uncertainty, minimize risks, and make informed decisions about feature development and product strategy.[1]
The strategic implementation of analytics creates a feedback loop between user needs and product development, ensuring resources are allocated effectively. This data-driven approach helps organizations move beyond gut feelings and assumptions, creating products that genuinely resonate with user needs while driving business growth.
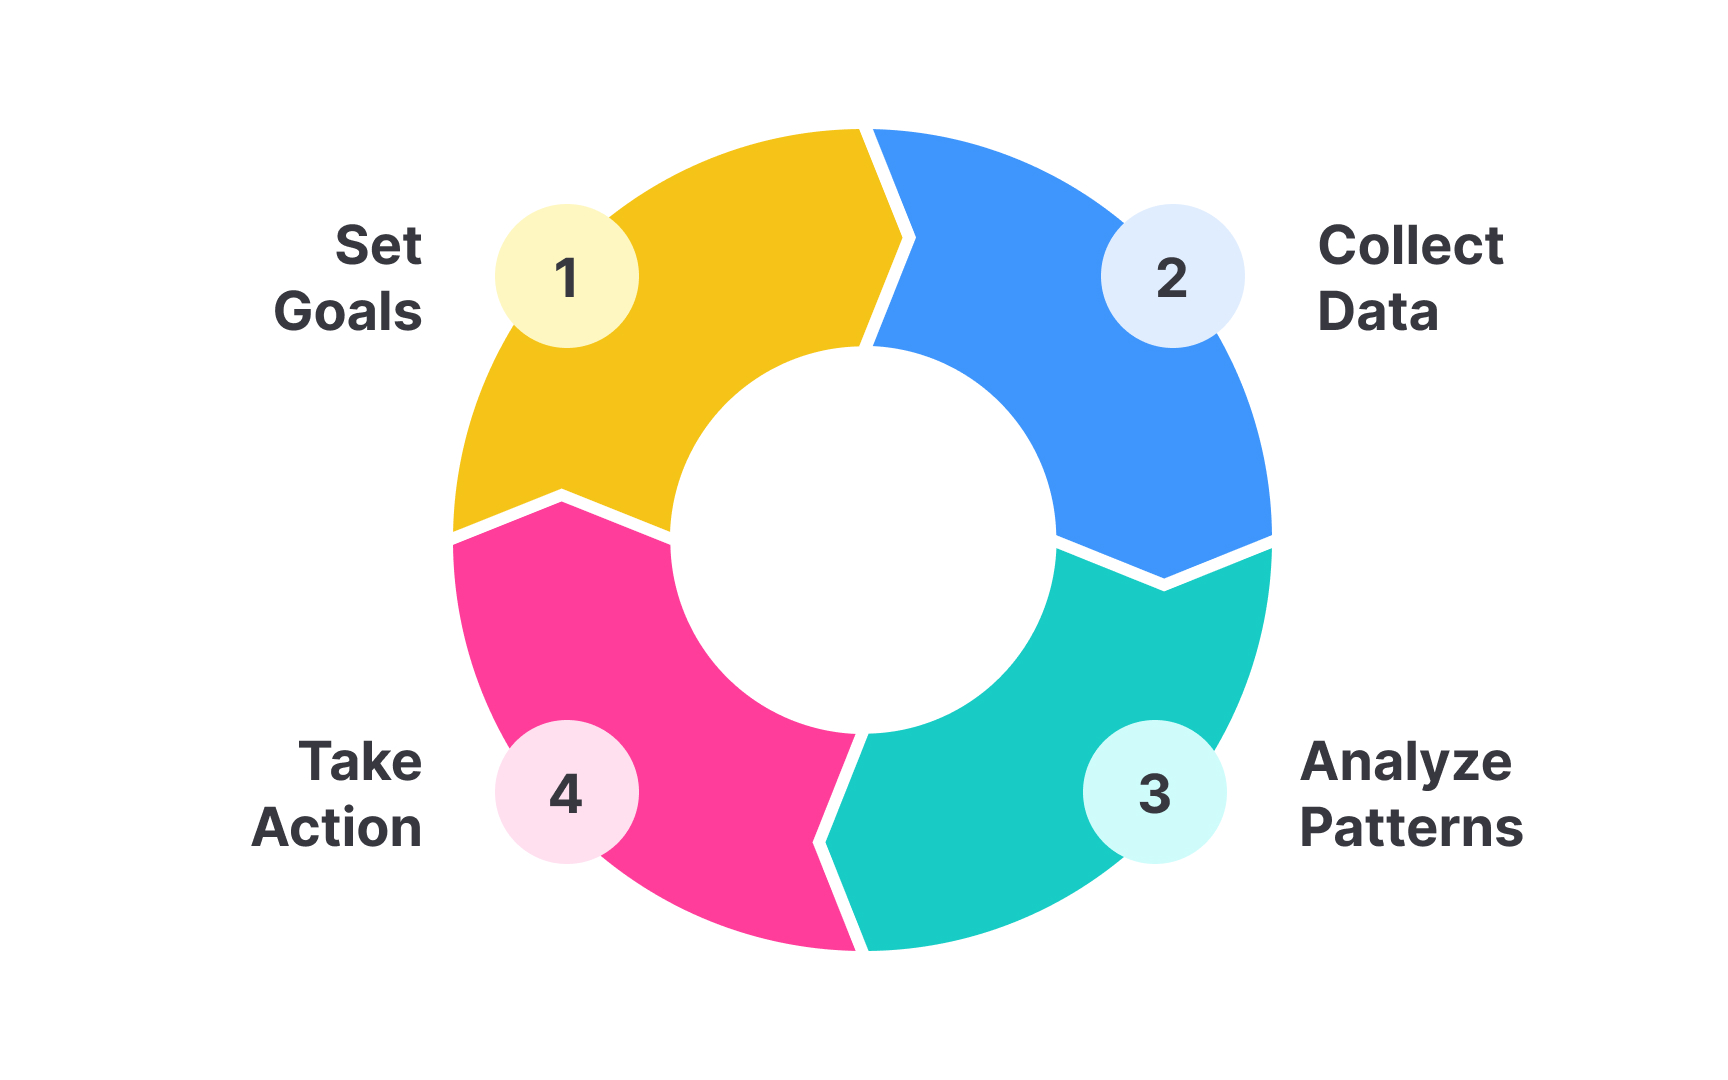
The analytics lifecycle creates a structured path from raw data to meaningful action in product development:
- It begins with establishing clear measurement goals that align with business objectives and user needs. For example, an e-commerce site might set goals to increase checkout completion rates or reduce cart abandonment.
- Data collection and processing form the next stage, where teams gather relevant user behavior data while ensuring data quality and privacy compliance. For instance, tracking user click patterns, session duration, and conversion funnels.
- The analysis phase transforms this data into insights through visualization, pattern recognition, and statistical analysis. A team might discover that users drop off at a specific form field, or that mobile users have significantly lower conversion rates.
- The final and most crucial stage involves turning insights into action through clear recommendations and measurable outcomes. For example, if analysis shows high drop-off rates during checkout, the team might simplify the payment process or add progress indicators.
Teams use these insights to make product improvements, validate decisions, and set new goals. This creates a continuous cycle where each insight feeds back into goal setting, creating an evolving understanding of user needs and product performance.
Actionable metrics directly connect to user behavior and business outcomes, enabling teams to make informed product decisions. These metrics answer specific questions about user engagement, retention, and product value. For example, instead of total signups, measuring the percentage of new users who complete key actions within their first week provides clear insight into product adoption.
The key to choosing effective metrics lies in their ability to drive action. Good metrics should help teams identify problems, validate solutions, and measure genuine product success. They create a clear connection between user behavior and business goals, making it obvious when changes are needed and whether improvements are working. For each metric you track, ask yourself: "If this number changes significantly, do I know exactly what action to take?”
Leading indicators predict future product performance by measuring current user behaviors that typically result in desired outcomes. These early warning signals, like feature adoption rates or user engagement patterns, help teams proactively address issues before they impact business results. They act as forward-looking gauges that enable teams to make timely adjustments to their product strategy.
Lagging indicators measure the final results of past actions, showing whether previous product decisions were effective. These metrics, such as monthly recurring revenue or customer lifetime value, provide concrete evidence of success or failure but offer limited guidance for future actions. While essential for validating strategy, they're less helpful for day-to-day decision making.[3]
A balanced analytics strategy combines both types of indicators to create a complete picture of product health. Leading indicators guide immediate actions and help teams stay ahead of problems, while lagging indicators validate whether those actions achieved the desired results. This dual approach enables teams to both predict and verify product success.
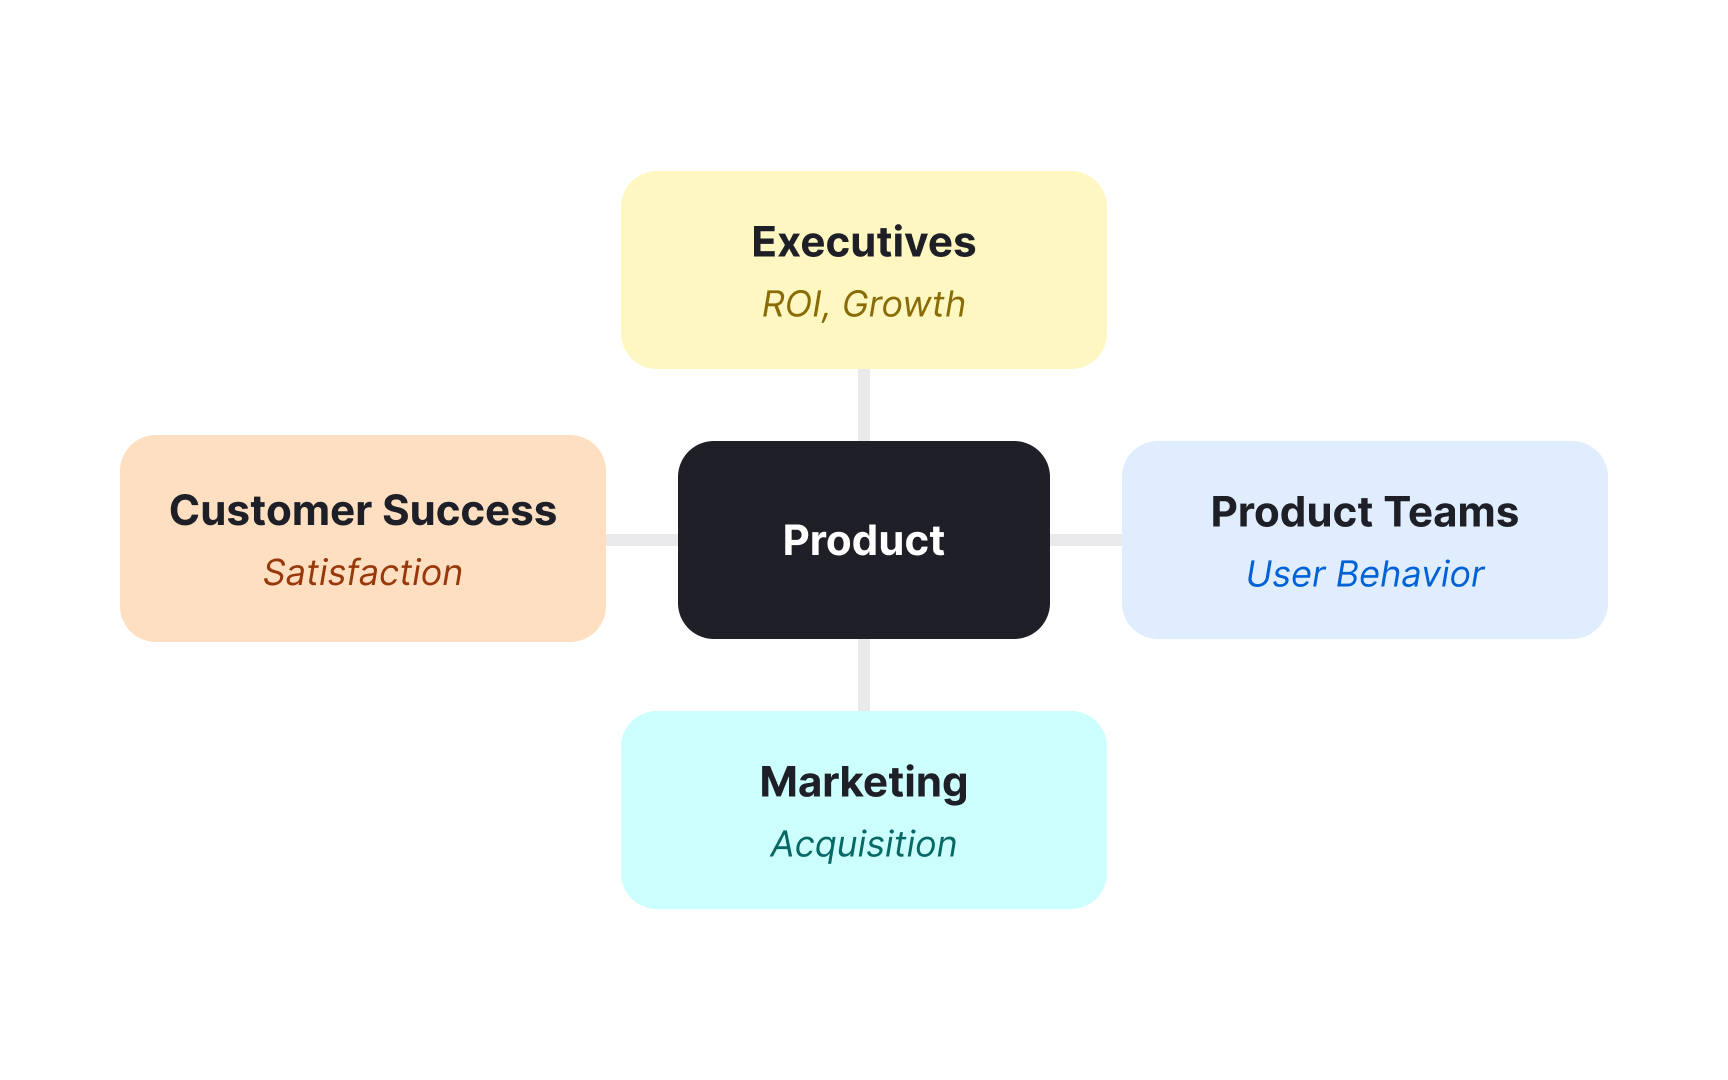
Product stakeholders shape how data transforms into product decisions across an organization. Each stakeholder group brings unique perspectives and needs. For example, top-level executives needs metrics that show overall product health and business impact, while product teams need granular data about feature usage and user journeys. Marketing teams focus on acquisition metrics, while customer success teams prioritize engagement and satisfaction indicators. Each group's needs influence what data to collect and how to present it.
Strong stakeholder alignment creates a shared understanding of product success. When all stakeholders agree on key metrics and measurement approaches, teams can move faster and make more confident decisions. This alignment prevents conflicting priorities and ensures analytics efforts support everyone's goals while maintaining focus on user needs.
Create a simple matrix mapping each stakeholder group to their most important metrics — it helps prioritize analytics efforts and report creation.
When analytics and business goals align, teams measure what truly matters rather than what's merely convenient to track. This focused approach helps teams avoid collecting data that doesn't contribute to decision-making or growth.
Each business goal needs corresponding metrics that accurately measure progress toward its achievement. High-level objectives like "increase user engagement" must break down into specific, measurable indicators such as session duration or feature adoption rates. This translation process ensures teams can track actual progress rather than making assumptions about success.
The connection between analytics and business goals must remain dynamic, evolving as company priorities shift. Regular reviews of analytics strategies against business objectives help teams stay focused on meaningful metrics. This ongoing alignment ensures analytics continues to provide actionable insights that drive business success rather than creating noise.
A healthy product analytics mindset transforms data from mere numbers into a powerful tool for product decisions. This approach treats every user
This mindset emphasizes asking the right questions before seeking answers in data. Teams start with clear hypotheses about user behavior and product performance, then use data to validate or disprove these theories. This scientific approach helps avoid common pitfalls like cherry-picking data to support predetermined conclusions or misinterpreting statistical patterns.
Developing this mindset means embracing both success and failure as valuable sources of insight. When features succeed, teams analyze why to replicate that success. When initiatives fall short, the focus shifts to understanding root causes rather than assigning blame. This balanced perspective helps teams build better products through continuous, data-informed learning.
Product analytics teams combine diverse skills to turn data into product improvements:
- Data engineers ensure proper event tracking and data collection
- Data analysts transform raw data into meaningful insights, working closely with data engineers
- UX researchers complement quantitative data with qualitative user insights
- Product managers act as bridges, translating analytics insights into actionable product decisions and ensuring data drives the product roadmap
Each role brings unique perspectives to analytics interpretation. This diversity of viewpoints creates a more complete understanding of product performance.
Pro Tip: Document which team member is responsible for each analytics task — clear ownership prevents gaps in data collection and analysis.
Analytics success criteria establish clear benchmarks for measuring the effectiveness of data collection and analysis efforts. These criteria focus on how well analytics insights drive actual product improvements and business outcomes, helping teams evaluate whether their implementation delivers meaningful value.
Success criteria should span both technical and business dimensions. Technical criteria cover key data quality metrics including accuracy (ensuring data reflects actual user behavior), completeness (capturing all relevant
As products evolve and business priorities shift, the metrics that matter most may change. To maintain effective analytics practices, teams must regularly revisit and refine their success criteria.
References
- Vanity Metrics vs Actionable Metrics: What’s the Difference and What To Track in SaaS? | Thoughts about Product Adoption, User Onboarding and Good UX | Userpilot Blog
Top contributors


Topics
From Course

Share


Similar lessons
Data Collection & Tracking

Analytics Tools & Platforms
