E = Extract
Uncover hidden opportunities by analyzing friction points and emotional peaks in customer experiences
Customer journey maps reveal far more than touchpoints and user paths. They expose the hidden friction points where customers struggle, the emotional peaks and valleys that define their experience, and the gaps between what businesses think they deliver and what customers actually receive. Extracting meaningful insights from journey maps requires looking beyond surface-level observations to uncover patterns that signal real opportunities.
When product teams, support staff, and marketing professionals collaborate to analyze these maps, they transform raw data into strategic intelligence. The most valuable insights often emerge from unexpected places: a support ticket trend that reveals a navigation issue, a drop-off point that indicates unclear messaging, or a moment of delight that could be amplified across other touchpoints. The real power of extraction lies in translating these discoveries into recommendations that resonate with stakeholders and drive meaningful change.
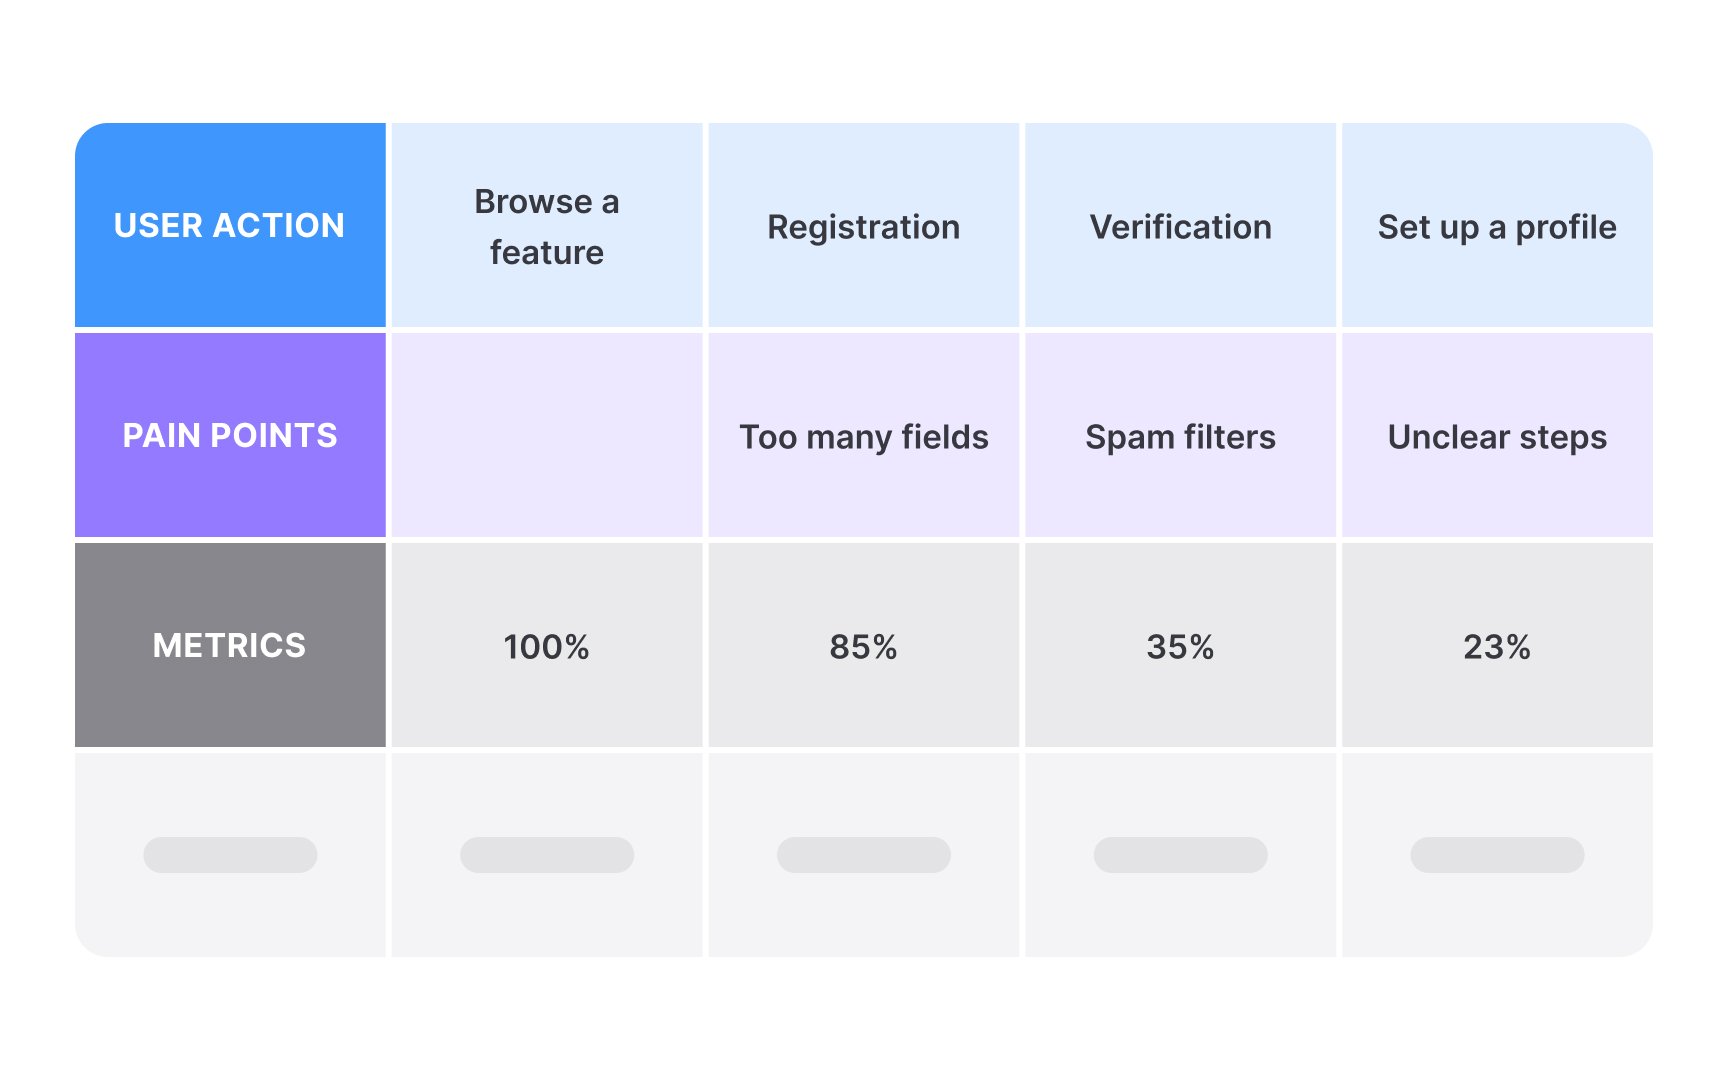
Bottlenecks in customer journeys act like traffic jams, slowing progress and frustrating users. These congestion points often appear where processes require multiple steps, systems don't integrate smoothly, or users must provide extensive information. Critical bottlenecks have the highest impact on user satisfaction and business outcomes.[1]
Look for telltale signs: sudden drops in completion rates, spikes in support contacts, or extended time spent on specific steps. Analytics data, heatmaps, and user session recordings help pinpoint exactly where users struggle. Compare intended user flows with actual behavior patterns to reveal unexpected obstacles.
Prioritize bottlenecks based on their impact and frequency. A bottleneck affecting 80% of users deserves immediate attention, even if the friction seems minor. Calculate the potential improvement in conversion or satisfaction rates to build a compelling case for addressing each issue.
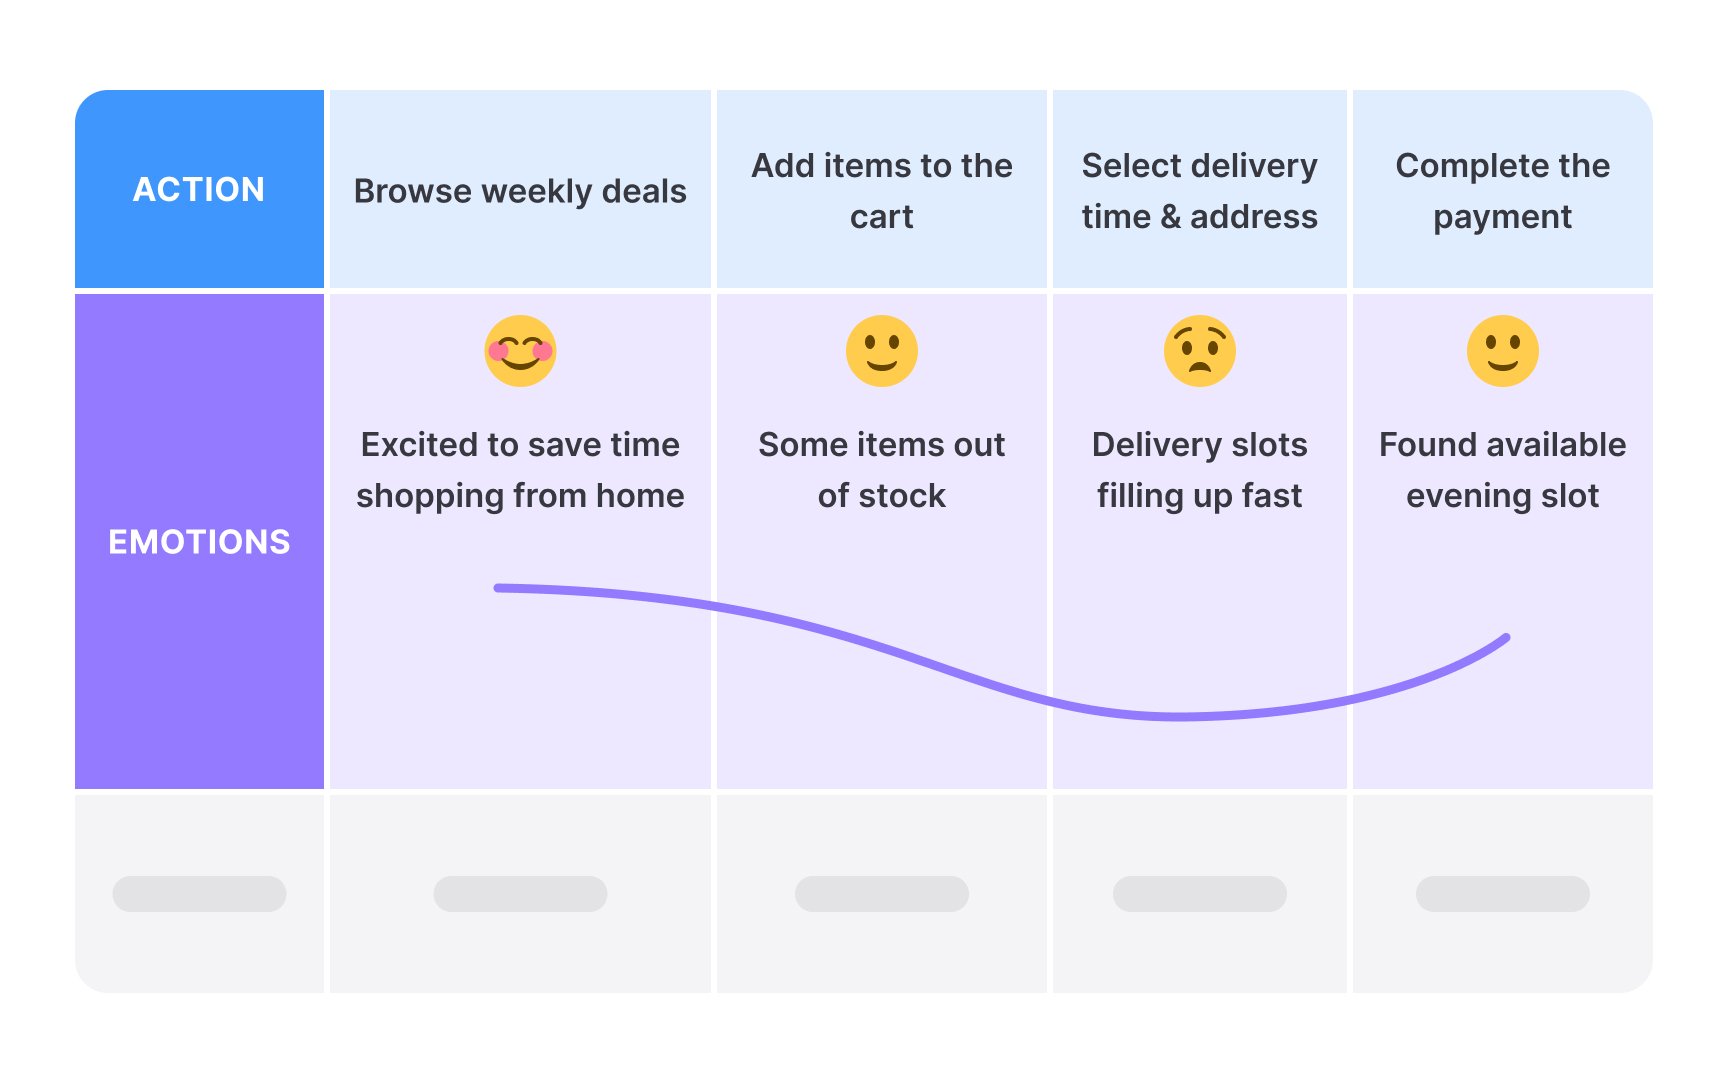
Emotional friction occurs when user expectations clash with reality, creating frustration, confusion, or disappointment. These moments damage trust and loyalty more than functional issues because they affect how users feel about your brand. Identifying emotional friction requires understanding both what users expect and what they actually experience.
Map emotional states throughout the journey using primary research and data analysis. Plot user emotions on a scale from delighted to frustrated, noting triggers for emotional shifts. This emotional layer adds crucial context that pure behavioral data misses.
Common emotional friction points include unclear error messages, lack of progress indicators, or incorrect/outdated instructions. Users might complete tasks successfully but still feel frustrated by the experience. Customer support tickets, sentiment analysis of user feedback, and user interviews reveal these hidden pain points.
Moments that matter are high-stakes touchpoints where customers make crucial decisions about continuing or abandoning their journey. These decision points, like choosing a pricing plan or completing sign-up, determine whether users progress or drop off. Finding these moments requires analyzing where customers hesitate, abandon, or enthusiastically move forward.
Emotional peaks and valleys reveal critical moments through customer memories. Users remember how they felt more than what they did. Review feedback for emotional language indicating frustration or delight. For example, a confusing sign-up process creates lasting negative impressions, while seamless onboarding builds loyalty. Map these emotional extremes to identify transformation opportunities.
Friction points and repeated interactions signal importance. If customers struggle with
Customer journey mapping insights gain power when diverse perspectives contribute to their interpretation. Product teams spot feature opportunities, support teams explain recurring issues, and
Schedule structured workshops where each team examines the
Patterns emerge when you analyze multiple
Document patterns using a consistent taxonomy to make analysis systematic. Create categories like: Technology Limitations (slow loading, system
When similar issues appear across multiple journeys, you've found strategic opportunities. For example, if "confusing error messages" appear in new user
An insight is a deeper understanding that connects multiple
Different stakeholders need differently framed insights: executives want ROI, engineers want specifications, and designers want user context.
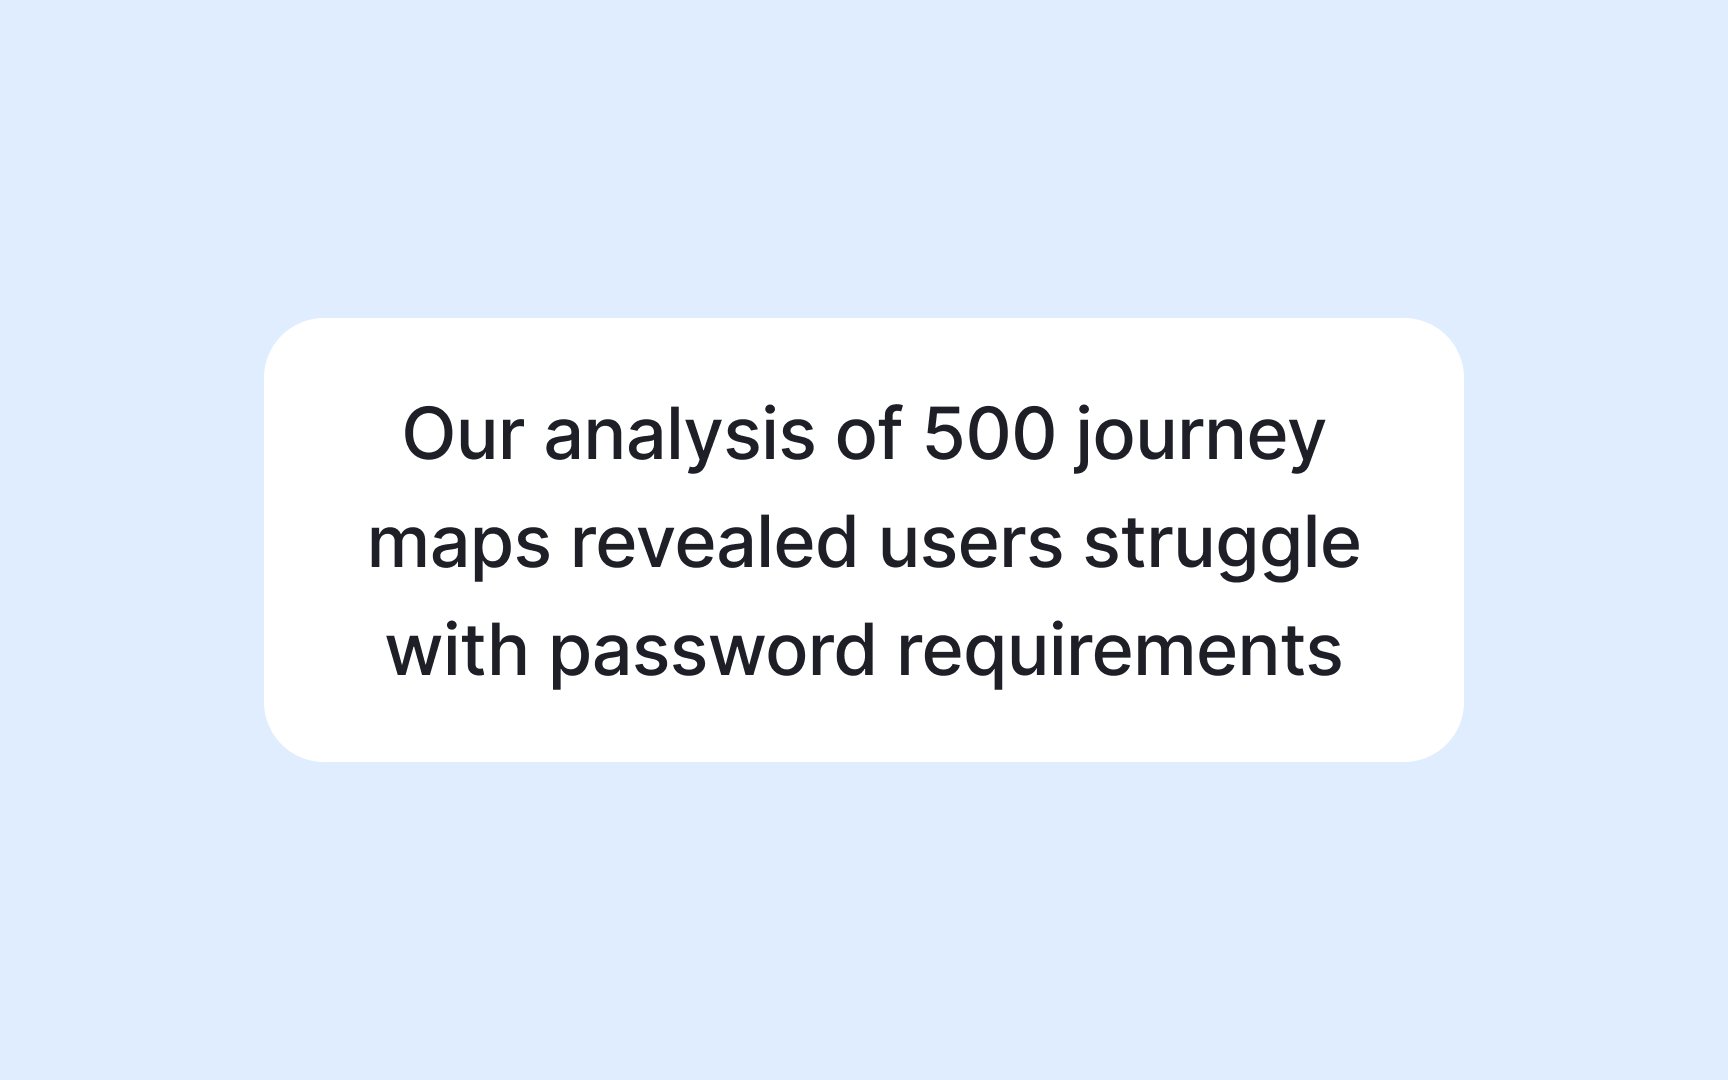
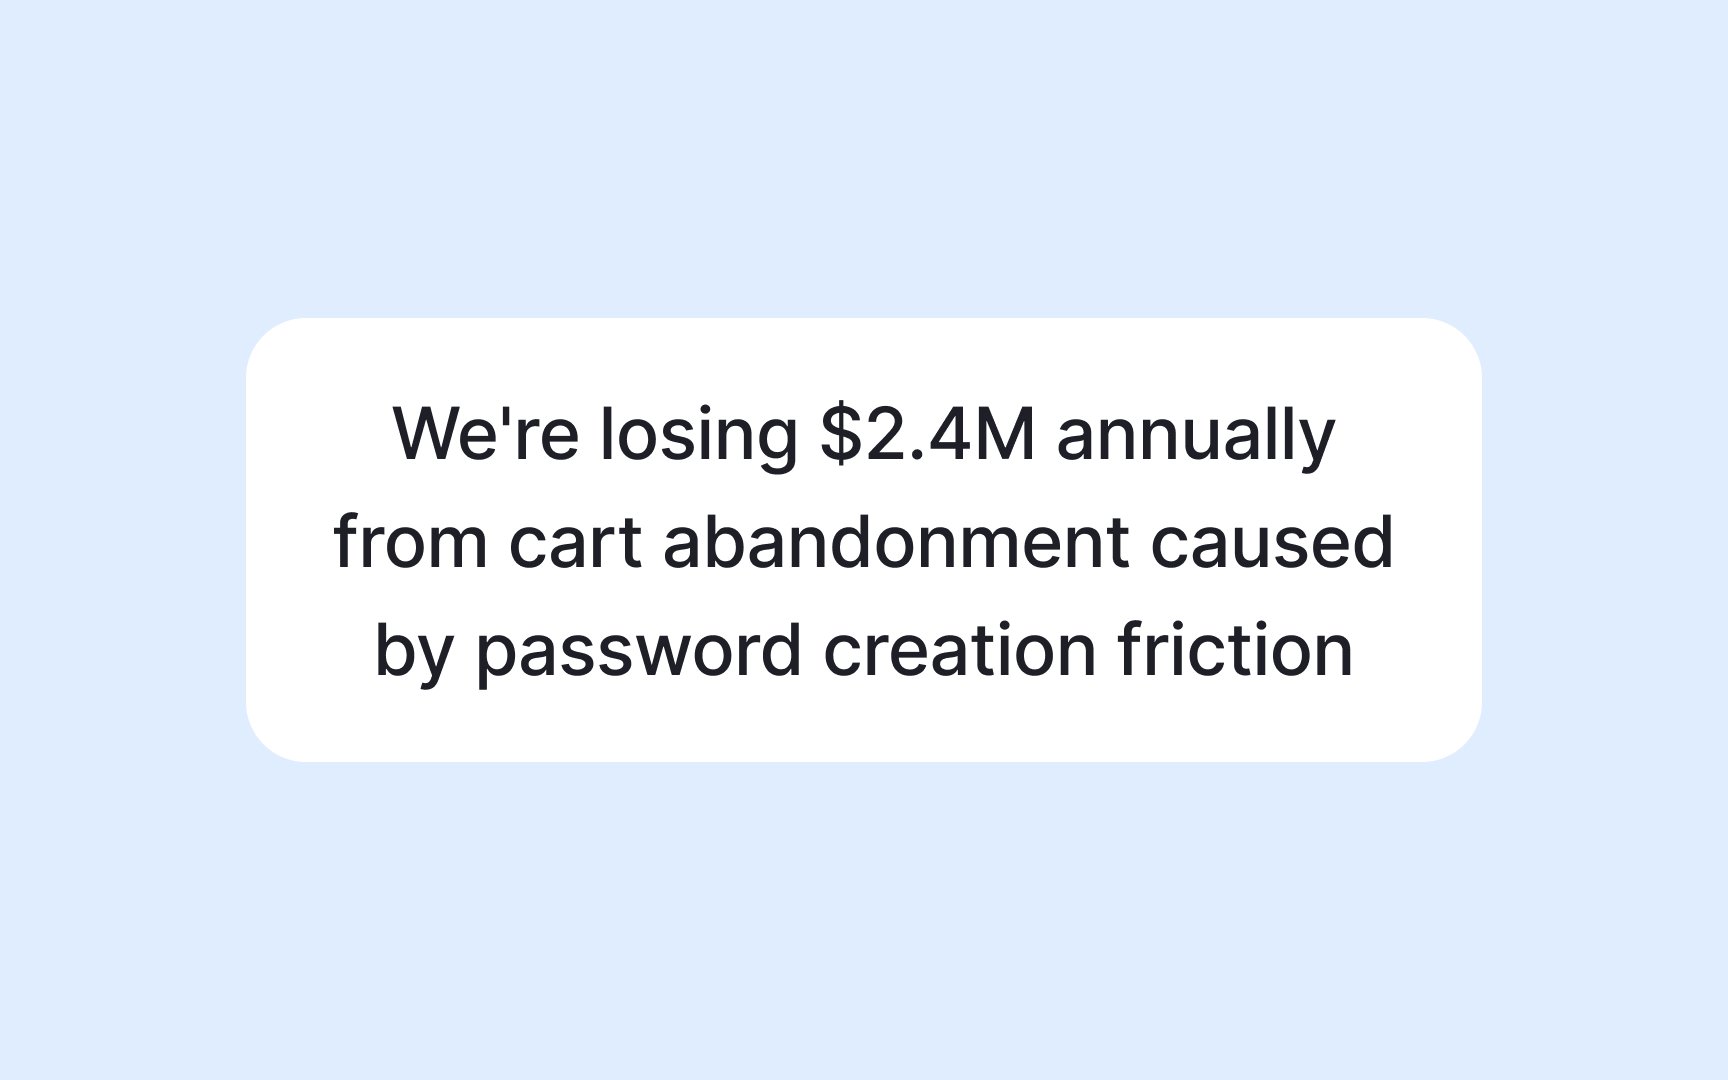
In any case, lead with the impact and not the process. Instead of saying "Our analysis of 500
Actionable recommendations specify what to change, why it matters, and how to measure success. They connect user pain points to business outcomes, making the case for investment clear. Avoid vague suggestions like "improve user experience." Instead, specify exact changes: "Replace
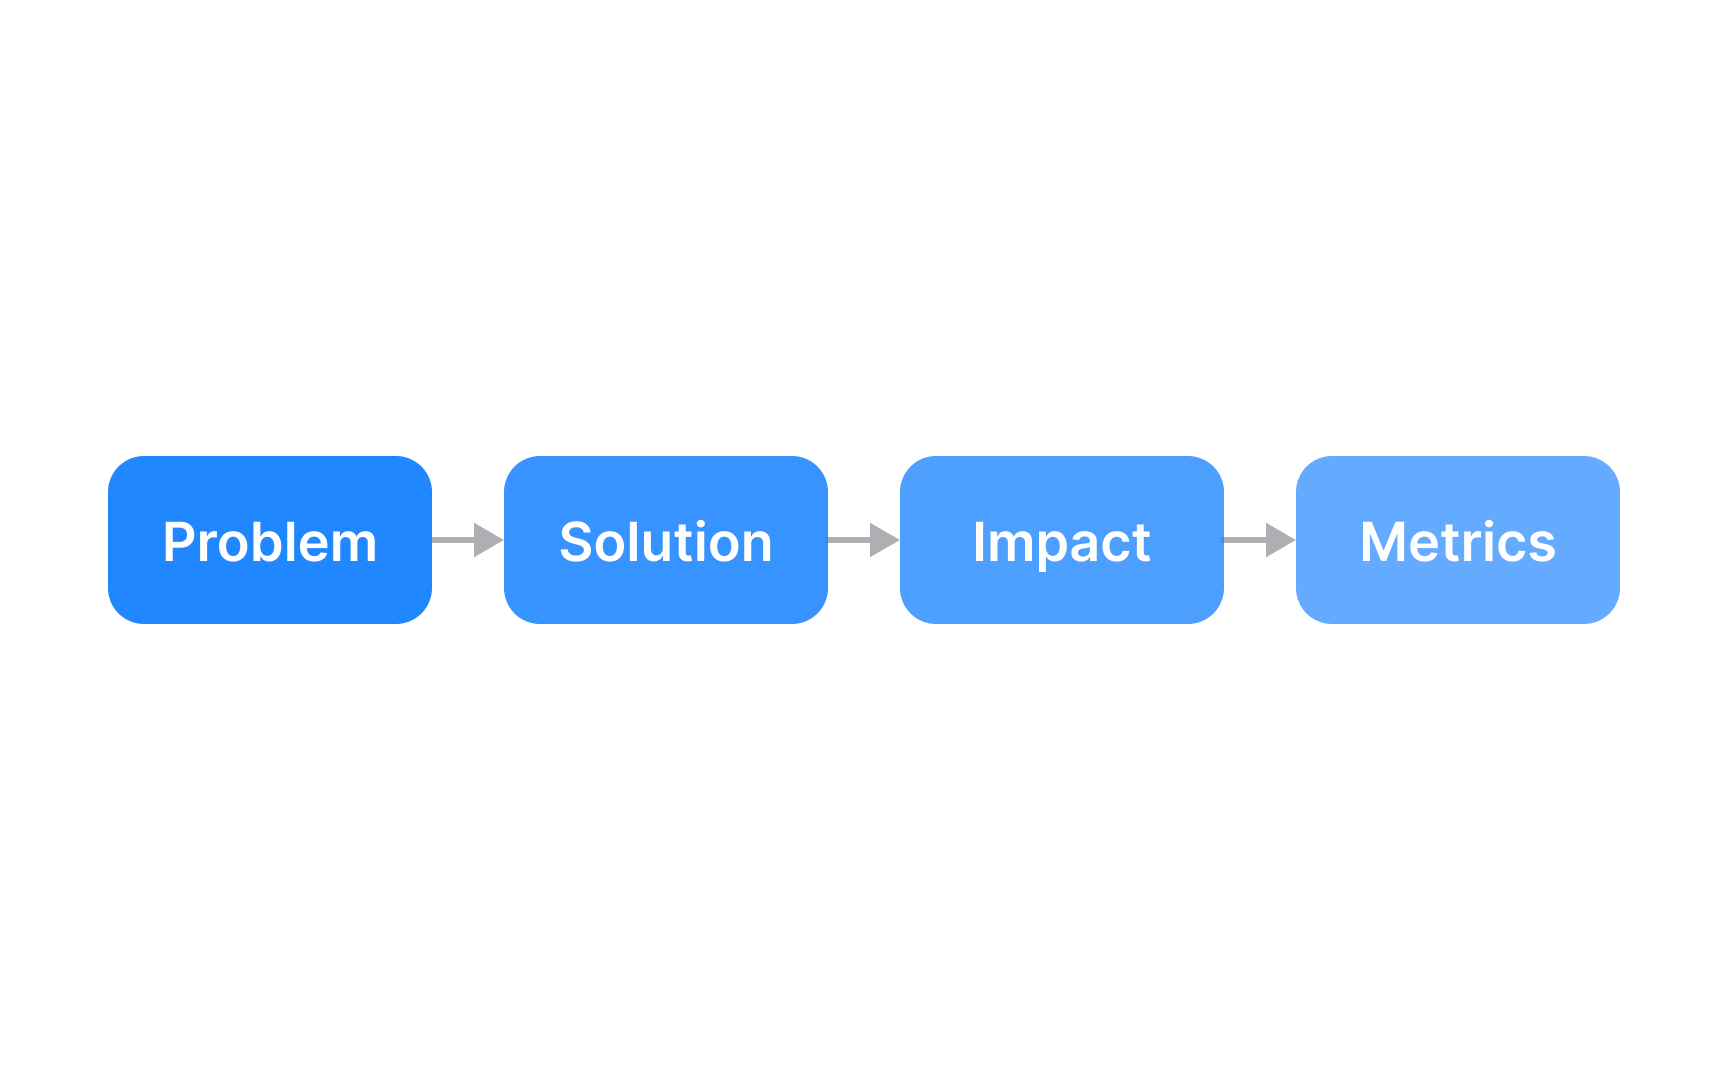
Structure recommendations using a consistent format: problem statement, proposed solution, expected impact, and success metrics. For example:
- Problem: 42% of users abandon at
email verification - Solution: Implement instant in-app verification with SMS backup option
- Impact: Reduce abandonment to 15%, retaining 2,700 additional users monthly
- Metrics: Track verification completion rates and time-to-verify
This format gives teams everything needed to prioritize and implement.
References
- Customer Journey Mapping for Business Growth | Oliver West
Top contributors

Topics
From Course

Share


Similar lessons

What is Journey Mapping?

Types of Journey Maps
