E-Commerce Analytics Dashboard UI | SaaS Web App


Hi everyone👋!
Excited to share my latest UX/UI design — a modern and data-driven E-Commerce Analytics Dashboard UI for a SaaS web app, built to help businesses monitor sales, track performance, and make smarter decisions.
This concept focuses on clean data visualization, intuitive layout, and a professional look that empowers users to gain insights at a glance.
Check below another version! 👇


Reviews
4 reviews

Hello Yuni Safitri,
First of all, I really like how clean and easy to follow the overall structure is. It's clear that you put effort into making the information accessible, and that's a great foundation to build on. Nice work!
I have a few suggestions that could help make the design even stronger:
- Icon Consistency: Right now, it feels like the icons are from different sets or styles. To create a more cohesive look, it would be great to stick to one consistent icon style — for example, all outline or all filled. This small change can make a big difference in the overall polish.
- Color Contrast: Some sections, especially where there’s text over a light background, could use a bit more contrast for better readability. Following basic accessibility contrast guidelines will not only make the design look sharper but also improve usability.
- Spacing Between Cards: The space between the statistic cards seems a bit too wide, which slightly breaks the visual flow. Reducing the gap a little could help the cards feel more connected while keeping the layout clean.
- White Space Management: Overall, the white space is used well,🚀 but in certain areas (like under the graph), it feels a little too generous. Tightening these gaps slightly would help the layout feel more balanced and focused.
- Typography Hierarchy: The text sizes and weights could use a little more hierarchy. Making key figures a bit bolder or slightly larger would make it easier for users to scan and find the most important information quickly.
- Visual Harmony: Some of the color tones between cards and graphs feel a little disconnected. Building a small, unified color palette and applying it consistently across elements would make the dashboard feel even more professional.
You're definitely on the right track with this design — the layout is intuitive and the structure is clear. With just a few tweaks around consistency and spacing, you can really take it to the next level. Great effort overall! Looking forward to seeing how you develop it further.🫰
You have done a great work with the visual design. Berivan Yusifova's comments are to the point. I agree with her.
Another issue I spotted is about the design brief requirement. The request is to design for a health care service platform, instead of random e-commerce dashboard.

Hey there! I've taken a look at your e-commerce dashboard and want to share some thoughts.
What works well:
✅ Information hierarchy is well-thought-out - key metrics (orders, revenue, profit) are clearly highlighted at the top
✅ Aesthetics and consistency - the dashboard has a clean, modern look with cohesive color scheme
✅ Data visualizations are readable - the trend chart and heat map add context to the numbers
✅ Navigation is simple and intuitive, with a well-organized sidebar menu
Worth reconsidering:
- Responsiveness - how does this dashboard scale on smaller screens?
- Data filtering - beyond date selection, more filtering/segmentation options would be useful
- User actions - what can I do with this data? Export is visible, but other interactions are limited
- Visual hierarchy - some elements compete for attention; consider stronger emphasis on the most important metrics
Overall impression:
You've done a solid job creating a readable and aesthetically pleasing dashboard! Without knowing the full business context, it's difficult to assess whether it meets all user needs, but from a UI perspective, it's qute good. 👍
The strongest aspect of the design is the balance between data density and readability - the dashboard provides valuable information without overwhelming the user. If I had to point out one area for improvement, it would be expanding the data interaction capabilities.
Great work! 👏

Excellent improvement curve!
You might also like
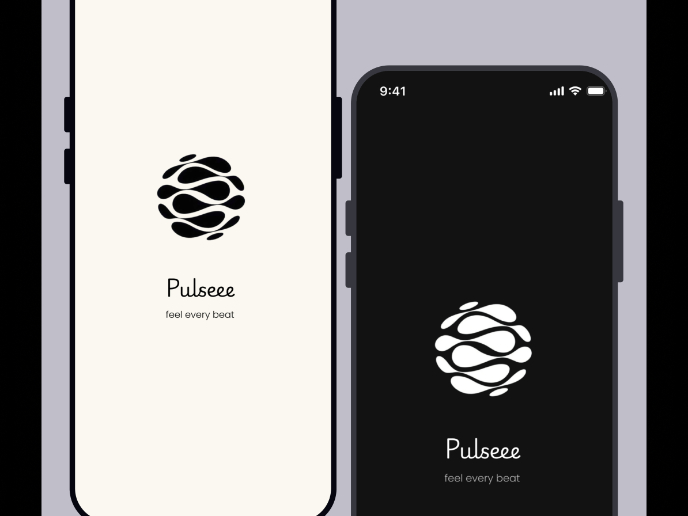
Pulse — Music Streaming App with Accessible Light & Dark Mode

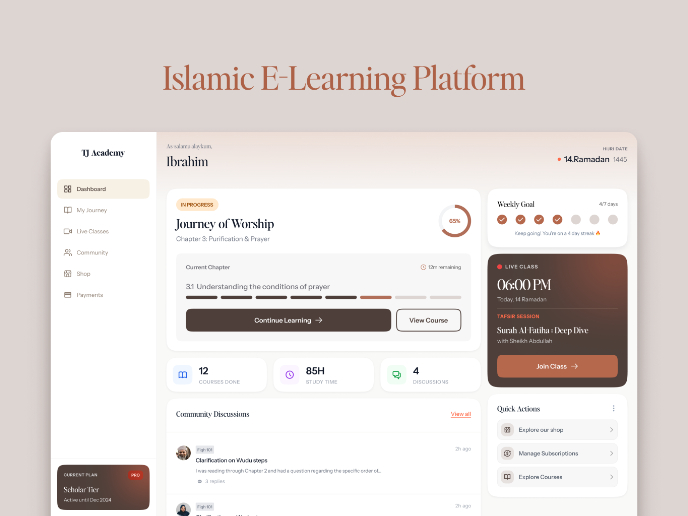
Islamic E-Learning Platfrom Dashboard

SiteScope - Progress Tracking App

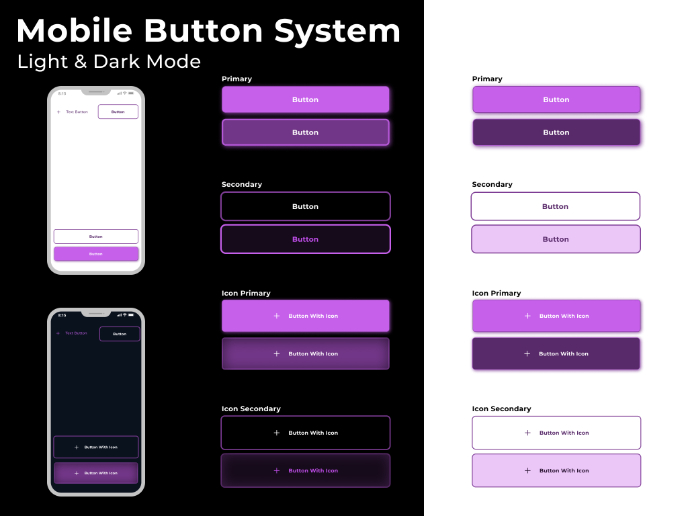
Mobile Button System

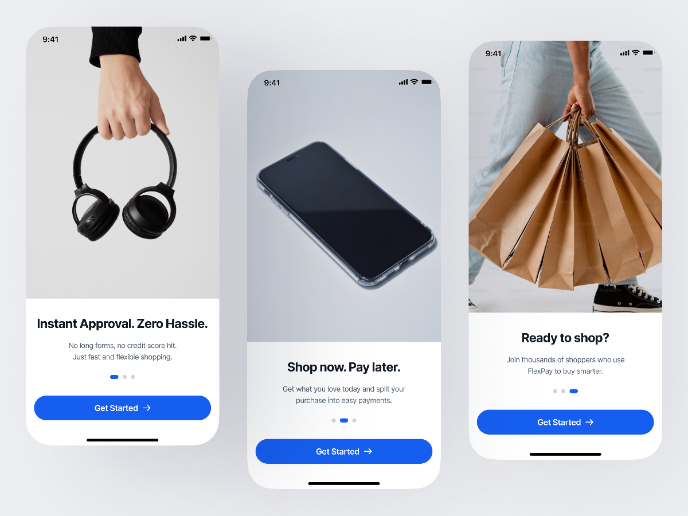
FlexPay

CJM for Co-Working Space - WeWork

Visual Design Courses

UX Design Foundations


Introduction to Figma

Design Terminology
