Berkeley Bowl Online Grocery Store


Supporting a local business.
I decided to focus on Berkeley Bowl because it's a neighborhood favorite of mine, and I have ordered delivery through their online store. However, because their system is directly through their website and not through a third party specializing in delivery, it has limited features and is harder to navigate than some of their competitors.

Every question has a purpose.
To ensure that I did not ask more questions than necessary, I started by setting specific research goals that all would lead to anticipated insights.

Developing the survey.
I drafted questions after browsing Berkeley Bowls' exiting online store and reviewing competitors (Safeway, Costco, and Uber Eats). I did not include questions that Berkeley Bowl may be able to answer directly through data from customer purchases, such as where customers are located, what items are purchased, or delivery vs. pickup comparisons.
The following section goes through each question and my rationale. I used section breaks aligned with my research goals.


Next Steps
If this survey were to be distributed to customers, Berkeley Bowl could decide if it wanted to provide an incentive for completing the survey, and what would be a minimum number of completed surveys to be considered valid and meaningful. It would also need to make revisions based on what is feasible to develop and implement, to avoid customers getting excited about features that aren't possible yet.
Exercise Reflection
I found this exercise meaningful as I could really see the ways that UX design could support a local business that is important in my community. I tried building prototypes of the survey in Figma to be able to display completing the survey on mobile, but I have a lot more to learn about the visual design and UI aspects of this work. Eventually, I decided to take screenshots that I know are not all the same aspect ratio, to avoid perfect getting in the way of good. I hope to continue to build the visual design skills needed to make the survey and presentation as effective as possible.
Tools used
From brief

Topics
Share
Reviews
2 reviews

Perfect

Appreciate the effort you put into compiling the survey responses—it covers all the key information!
Suggestion:
To make it more engaging, consider using color-coded sections or visual highlights. Right now, it feels a bit text-heavy, and adding some structure or visual hierarchy could really help the reader stay interested and absorb the insights more easily.
You might also like
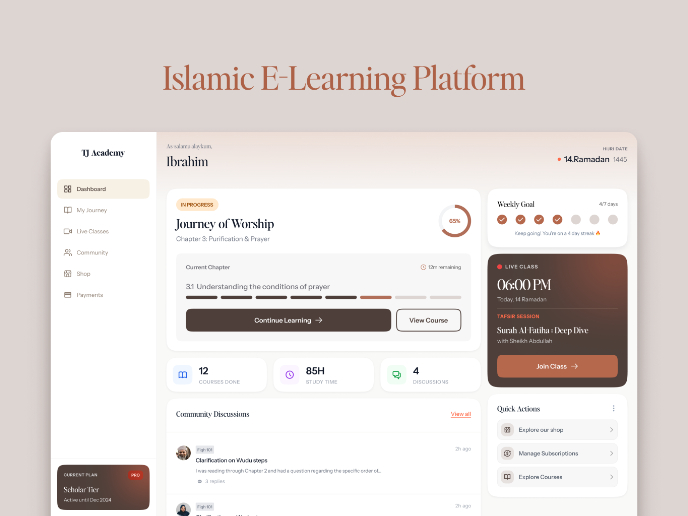
Islamic E-Learning Platfrom Dashboard

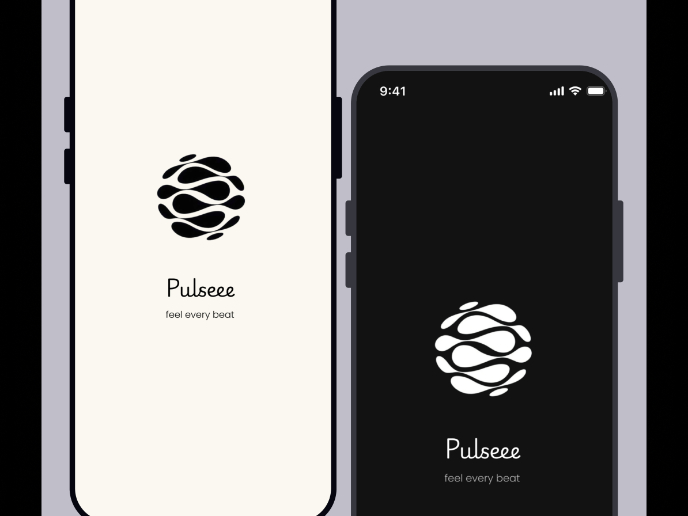
Pulse — Music Streaming App with Accessible Light & Dark Mode

SiteScope - Progress Tracking App

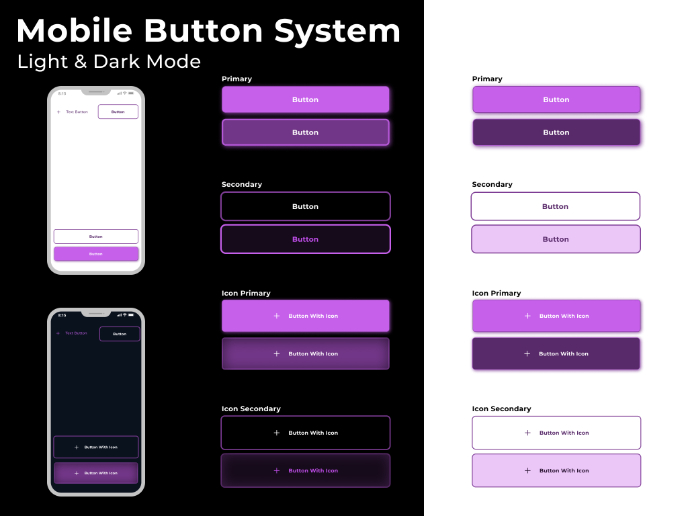
Mobile Button System

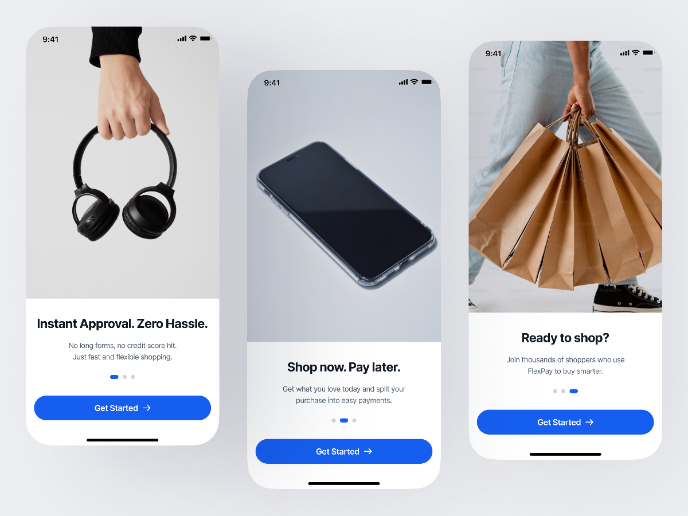
FlexPay

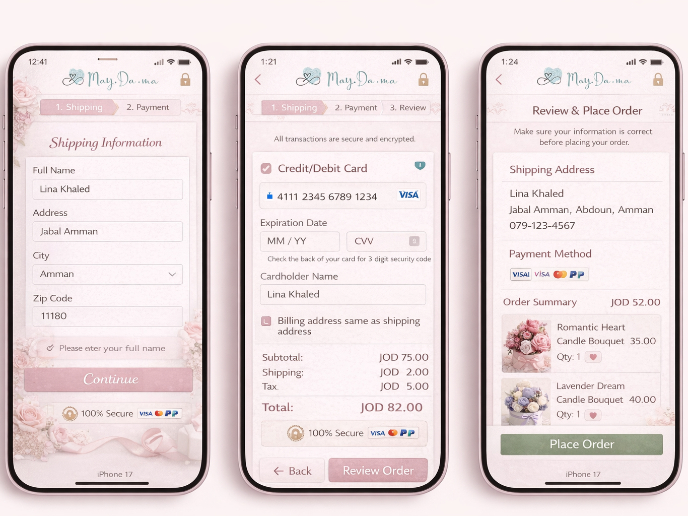
May.Da.Ma Candles & more

User Research Courses

Ethical & Responsible Product Design


The Product Development Lifecycle & Methodologies


Writing Effective Product Specs