Analytical Dashboard - Mobile


Reviews
5 reviews

Neat layout with good zoning and spacing.
Needs improvement: The search box is disproportionately large compared to the overall design, and the icons and text are uneven.
Sorry, I can't offer much advice due to the quality of the uploaded file.

The mockup design shows promise, but there are several key areas where improvements are needed.
From a user interface perspective, there are some notable deficiencies. Each graph box should ideally include a clear title to provide context. For instance, the presence of a "2017" box without an accompanying explanation leaves users wondering what data the graph represents. Similarly, the box labeled "Top retail sales locations" lacks visible location details underneath, making it unclear which locations are being referenced.
Additionally, there are alignment issues evident in the mockup, such as the misalignment of the "2017-2018" date next to the "Sales report" title. These inconsistencies detract from the overall professional appearance and usability of the design.
Furthermore, the mockup would benefit from a higher resolution to showcase finer details more effectively.
Upon first glance, your analytical dashboard appears detailed and straightforward, promising a robust user experience. Unfortunately, the zoomed-in image is a bit blurry due to resolution issues, making it hard to discern details. However, your work shows great potential, and I encourage you to resubmit with a clearer image to fully showcase your design.
Additionally, providing an explanation of your design rationale would add valuable context to your submission, helping us understand your decisions better. Keep up the great work!

You must submit only your own work Faith, this is cut and pasted from other peoples work.
https://dribbble.com/shots/20888456-Chart-for-dashboard-pages

I like your overall concept, but it's crucial to consider Color Accessibility guidelines, especially given that some fonts, colors, and the design system.
I recommend starting by creating a solid design system. This will help establish the foundation for choosing appropriate call-to-action colors and brand colors. Addressing inconsistencies in visual data presentation is also important. For instance, in the maps, the highest percentage is represented by blue, yet at a glance, yellow seems more prominent. Harmonizing these visual elements will enhance clarity and comprehension for users.
Despite these considerations, I must commend your thoughtful design decisions. I particularly appreciate the clear grouping under the sales figures and the effective separation of each section. Your efforts are evident, and I encourage you to continue refining and iterating on your designs. Great job, and keep up the good work!
You might also like

Islamic E-Learning Platfrom Dashboard

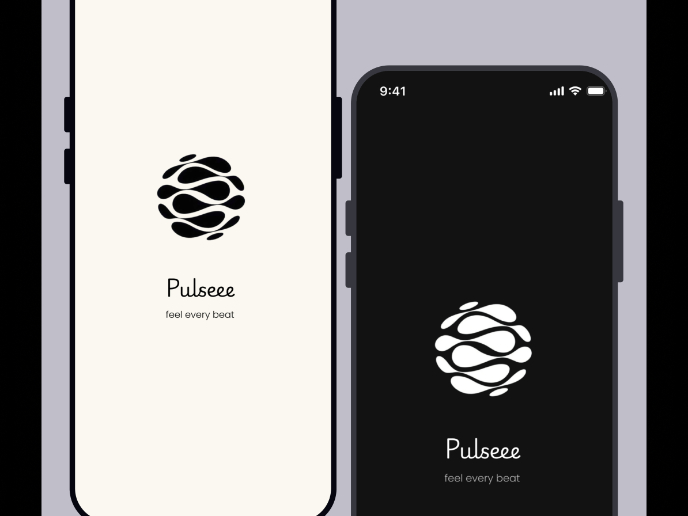
Pulse — Music Streaming App with Accessible Light & Dark Mode

SiteScope - Progress Tracking App

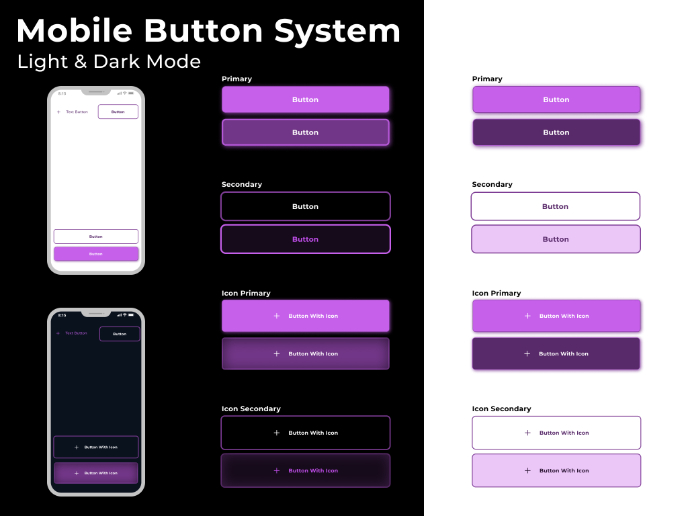
Mobile Button System

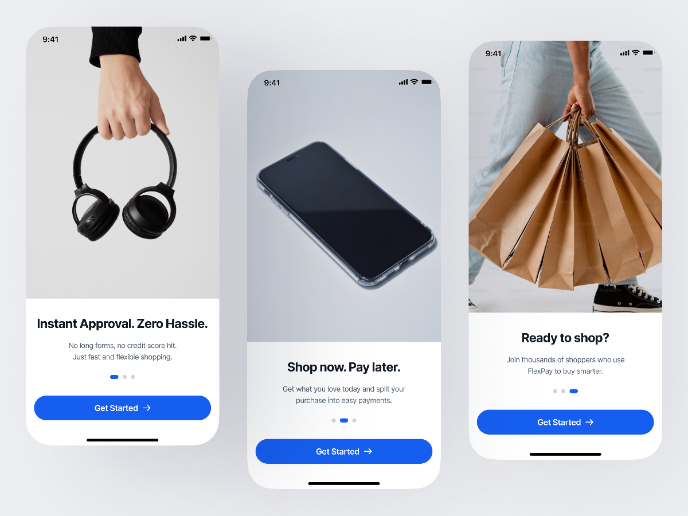
FlexPay

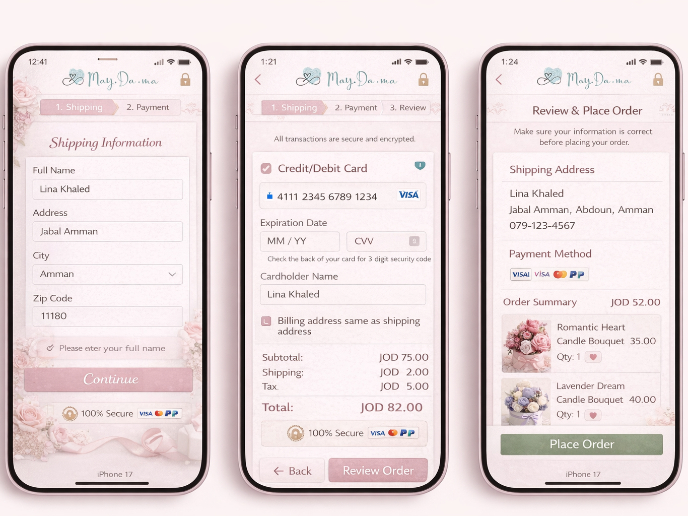
May.Da.Ma Candles & more

Visual Design Courses

UX Design Foundations


Introduction to Figma

Design Terminology
