Flowchart
Flowcharts visually represent processes, decisions, and workflows, helping teams design, analyze, and communicate complex systems with clarity and efficiency.


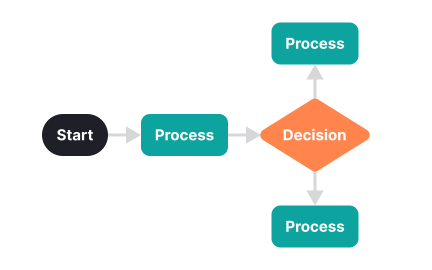
A flowchart is a diagram that uses symbols, arrows, and connectors to represent processes, steps, and decisions. It provides a visual language for mapping how actions progress, how decisions branch, and how tasks connect within a system. Flowcharts are used widely across UX, product management, engineering, and business analysis because they simplify complexity into a format that is easier to discuss, refine, and optimize.
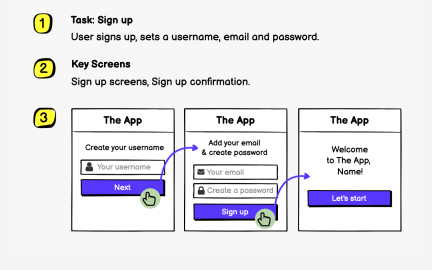
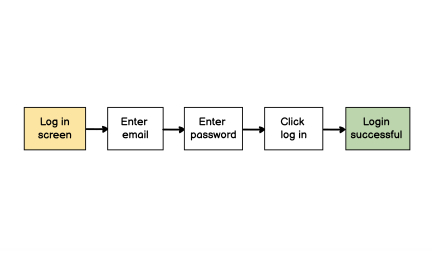
For UX designers, flowcharts are particularly useful when planning user journeys and interaction flows. Instead of jumping directly into wireframes, a flowchart offers a high-level overview of how users will move through a product. For example, an onboarding flow can be mapped to show every possible user path, including successful completions, drop-offs, or error recovery. This clarity ensures that no critical paths are overlooked before interface design begins.
Real-world use cases span industries. In healthcare, flowcharts document patient intake processes, ensuring consistency and reducing errors. In e-commerce, checkout flowcharts help visualize all possible outcomes, from successful purchase to payment failure, ensuring that contingency paths are accounted for. In education technology, flowcharts show student progress through adaptive learning modules, clarifying branching conditions that personalize content delivery.
Flowcharts also support iteration. As products evolve, teams update flowcharts to reflect new steps, integrations, or simplifications. This living documentation becomes a valuable knowledge base that outlasts individual projects or team members, preserving organizational learning. For complex systems, maintaining accurate flowcharts saves time and reduces confusion when onboarding new employees or revisiting past designs.
Learn more about this in the Flowchart Exercise, taken from the What are Wireflows? Lesson, a part of the Wireframing Course.
Key Takeaways
- Flowcharts use symbols and arrows to map processes and decisions.
- UX designers use them to plan user journeys and interaction flows.
- Product managers rely on them for alignment and communication.
- Accessibility benefits from mapping alternative user paths.
- Industries like healthcare, retail, and education apply them widely.
- They serve as living documentation for evolving systems.
Flowcharts create a shared visual language that all stakeholders can understand, regardless of background. Designers, developers, and managers can align around the same diagram, reducing the risk of miscommunication. For example, a flowchart of the onboarding journey ensures that designers know where to place screens, developers know what logic to implement, and managers know how success is defined.
This alignment accelerates decision-making. Instead of debating abstract ideas, teams can point directly to a diagram, confirm what works, and adjust what does not. By serving as a neutral artifact, flowcharts help teams move from conversation to consensus more efficiently.
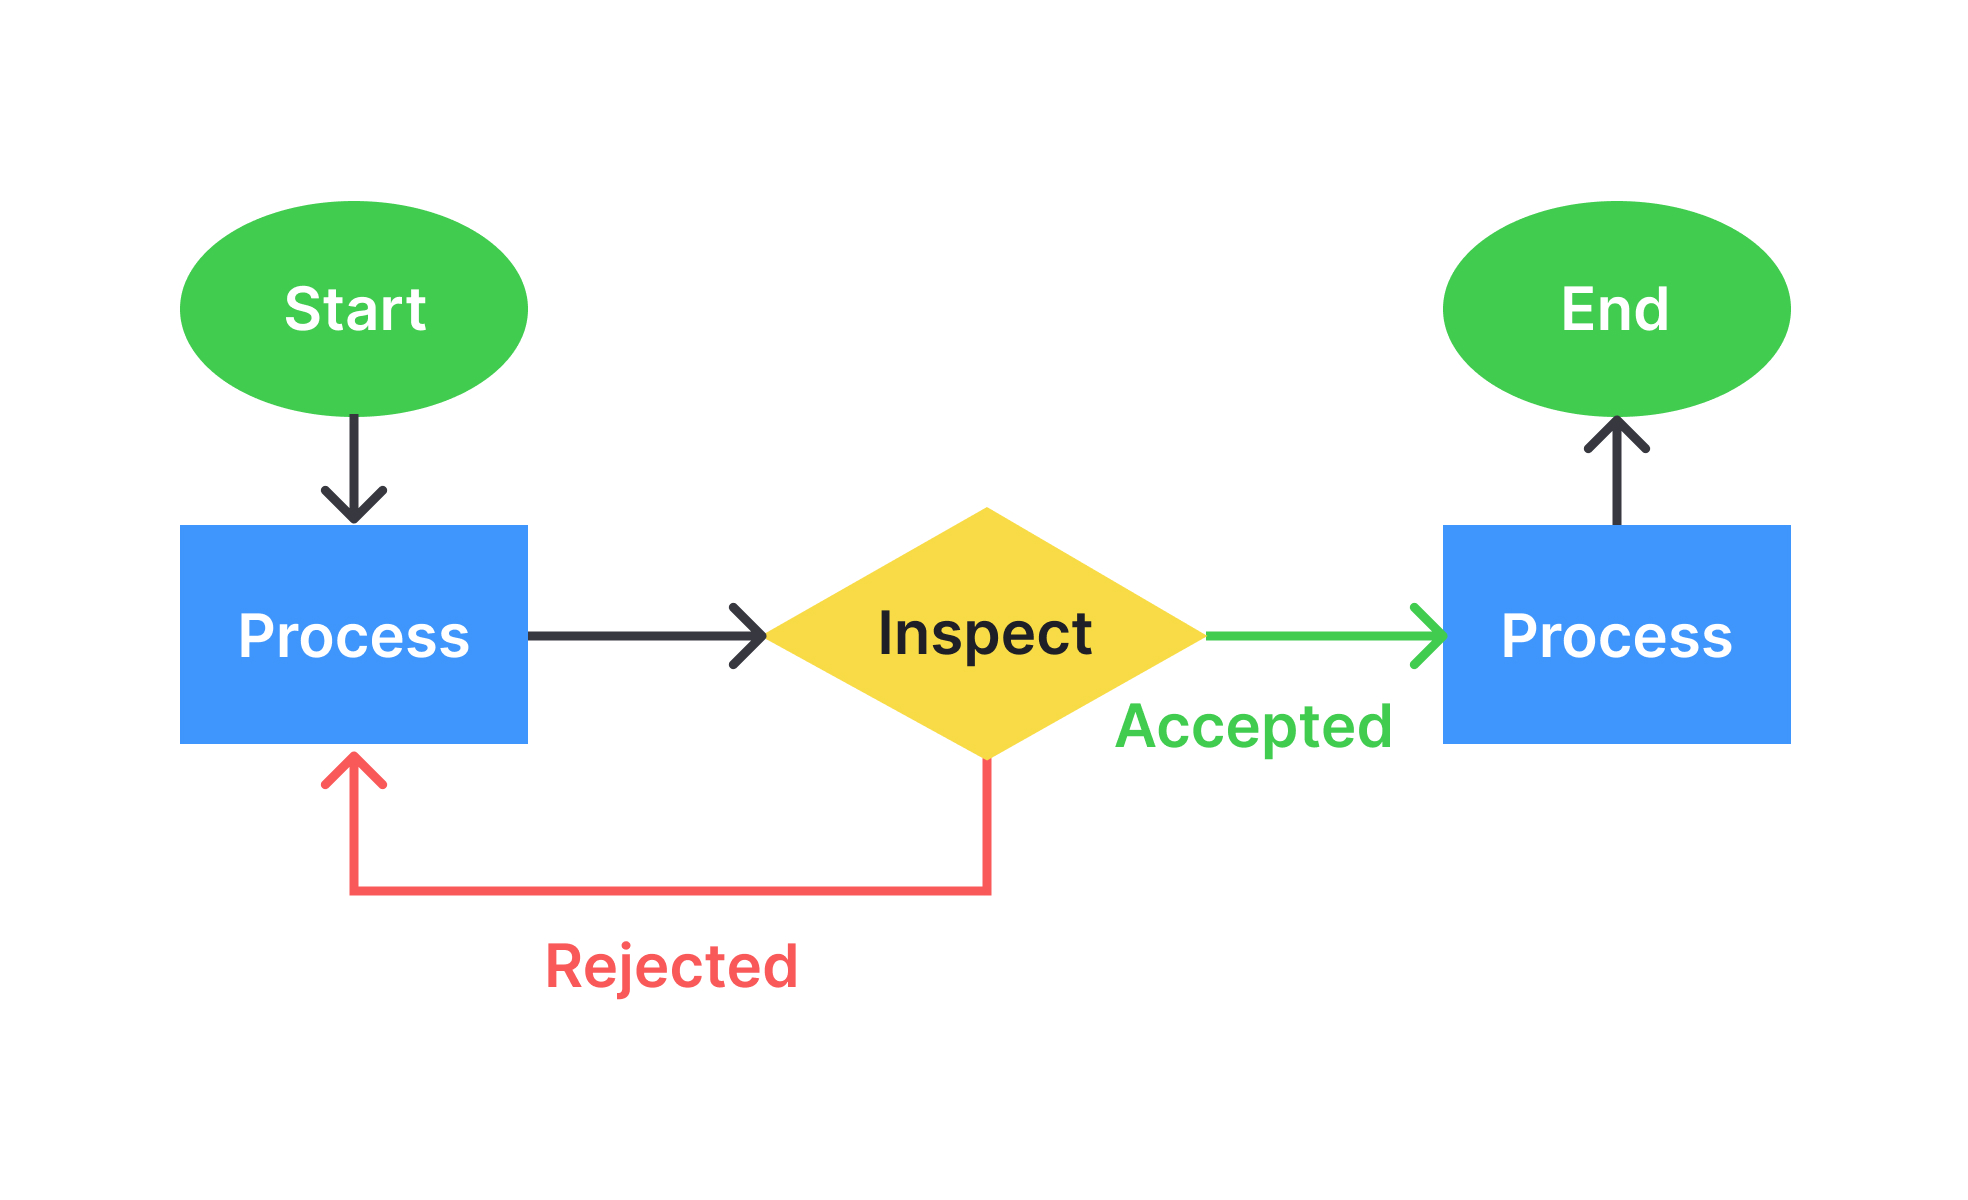
Effective flowcharts are clear, consistent, and concise. Designers use standardized symbols—such as ovals for start and end points, rectangles for processes, and diamonds for decisions—so that diagrams are easy to interpret. Labels must be short but precise, guiding readers without overwhelming them with detail. Arrows should flow logically, avoiding unnecessary crossing or clutter.
Iterative review is also essential. Flowcharts should be tested with team members who were not involved in creating them, ensuring they are easy to follow for fresh eyes. This helps confirm that the chart communicates effectively across the organization.
By mapping user flows before building interfaces, flowcharts allow teams to identify friction points early. For instance, a checkout process might reveal too many decision points, leading to abandonment. Adjusting the flow before development reduces wasted effort and results in a smoother user experience.
Flowcharts also encourage holistic thinking. Instead of focusing narrowly on individual screens, teams step back and consider the entire journey. This broader perspective ensures that transitions between steps feel natural and that no critical paths are overlooked, improving usability and satisfaction once the product launches.
Recommended resources
Courses

Wireframing


UX Design Foundations


Design Terminology

Lessons


Projects

Polifinity


SELECT YOUR VILLA //


How Simplicity Scaled a $1B Revenue Platform