User Journey & Experience Maps
Discover how to create user journey and experience maps to visualize the user's end-to-end experience, including touchpoints, emotions, pain points, and opportunities for improvement
Mapping is a convenient visualization method for representing user experience. Depending on the type of map you use, it can help build empathy among team members, display user needs, feelings, behaviors, or expectations, set goals, identify pain points, and help find solutions. We use maps to display what users go through to achieve their goals from their perspectives.
Well-designed maps also visualize business interests and contain competitor evaluations. With this method, UX practitioners can evaluate the current state of user experience or plan a desired one.
The downside of mapping is its cost. User journey maps or experience maps require resources for conducting user research and comprehensive analysis. The results, however, can provide fascinating insights about your users that you can use to improve your product/service and boost profits.
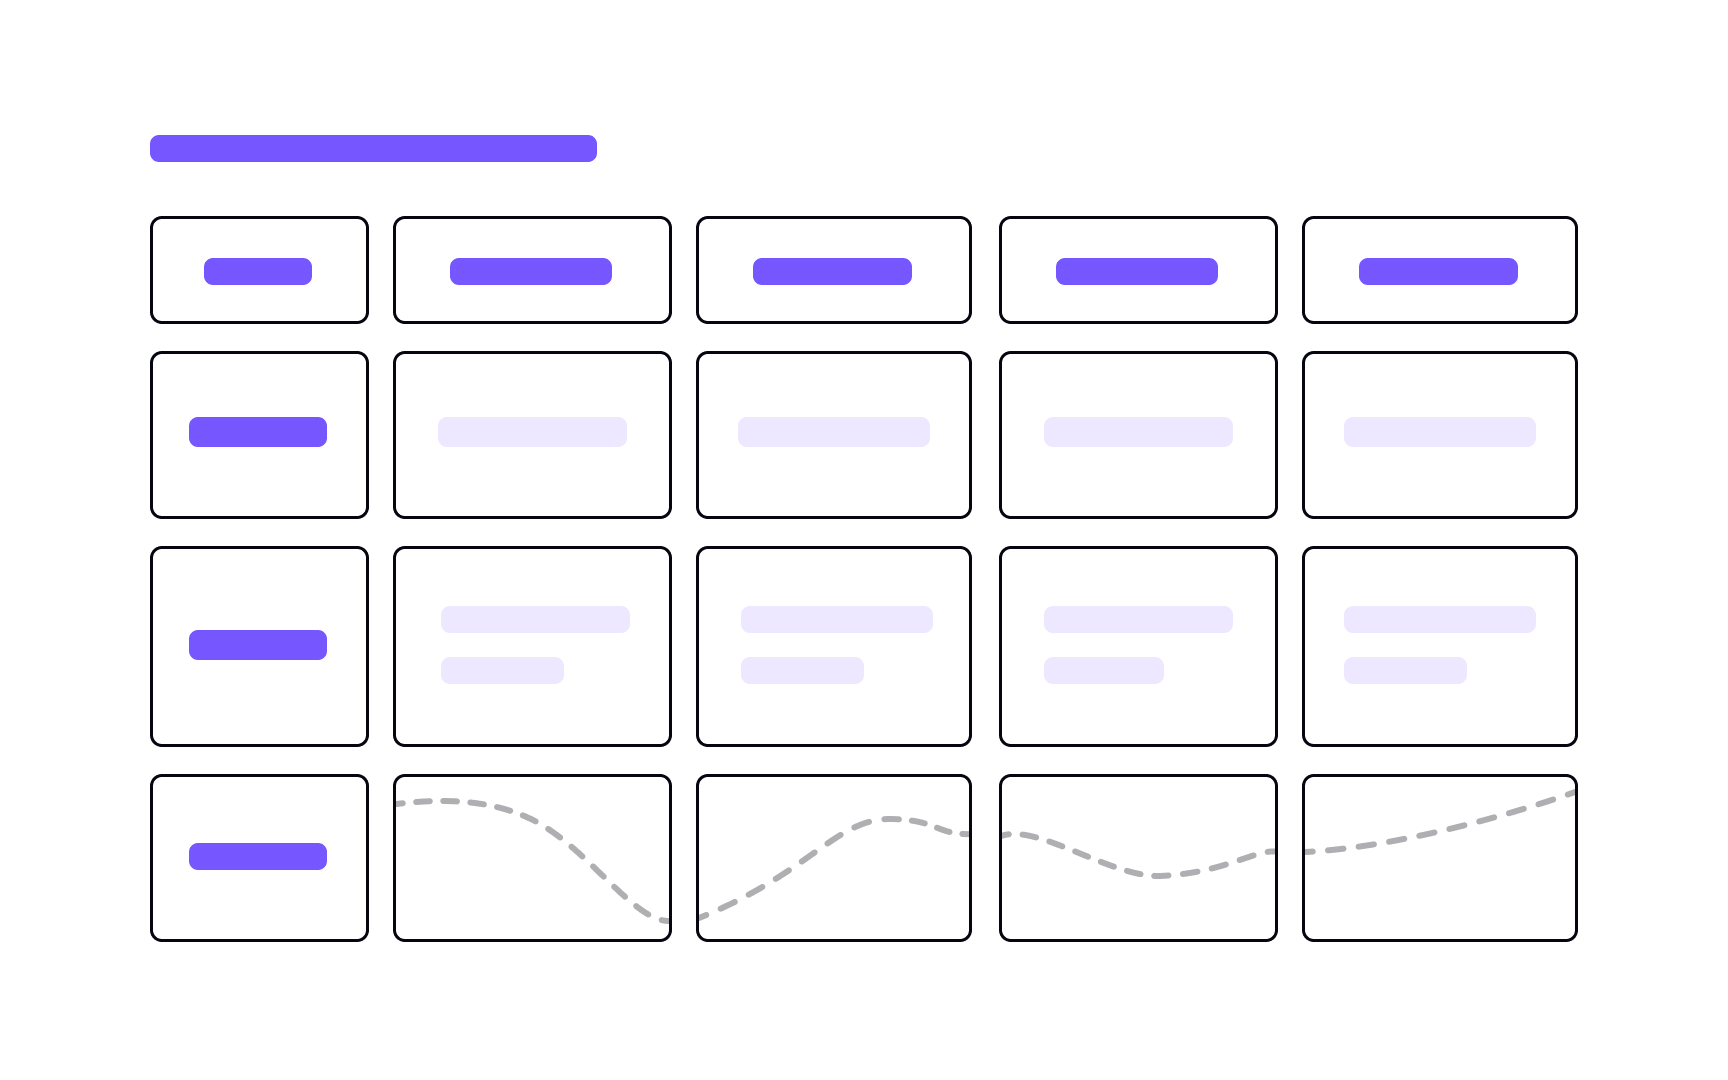
An experience map is a visualization of the end-to-end
In other words,
Pro Tip: Use experience maps to determine whether a problem exists and whether users need your solution in the first place.
A customer or
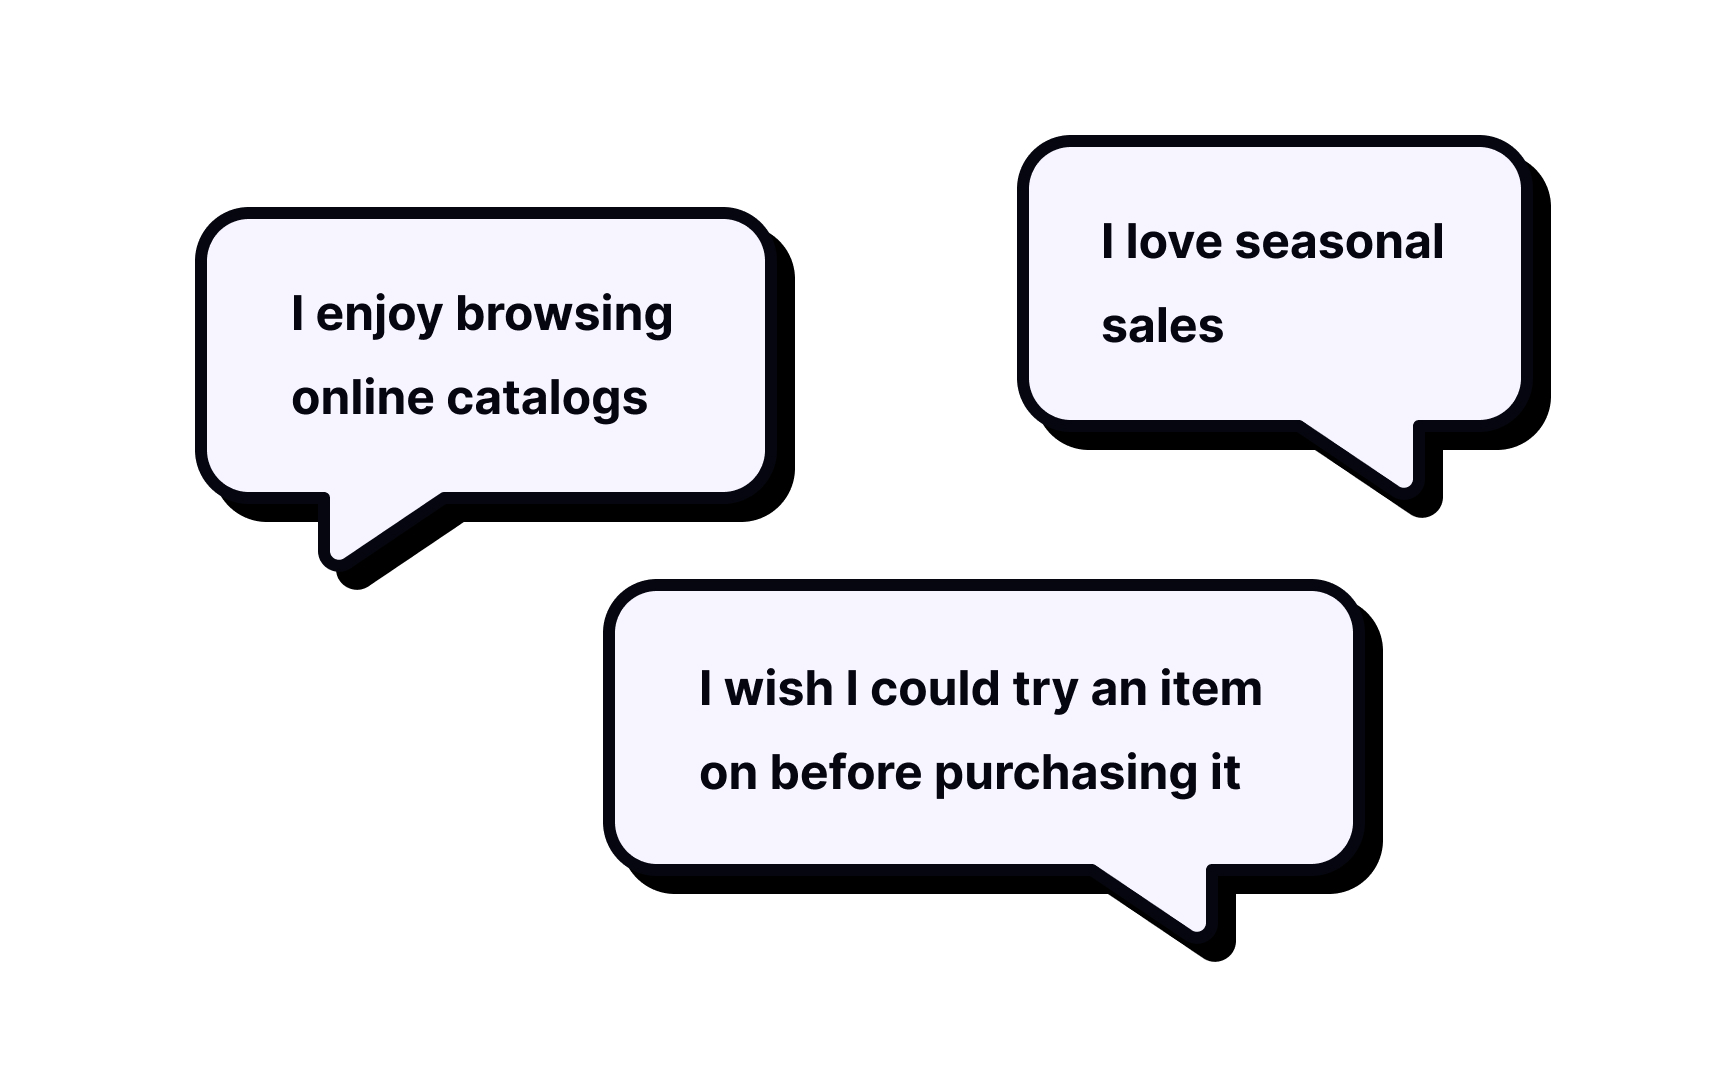
An experience map has a broader scope — it depicts generic users having a general human experience. For example, an experience map can describe how people buy clothes at offline stores and what difficulties they face, such as long lines to the fitting rooms, wrong price tags, or a limited number of choices and item sizes.
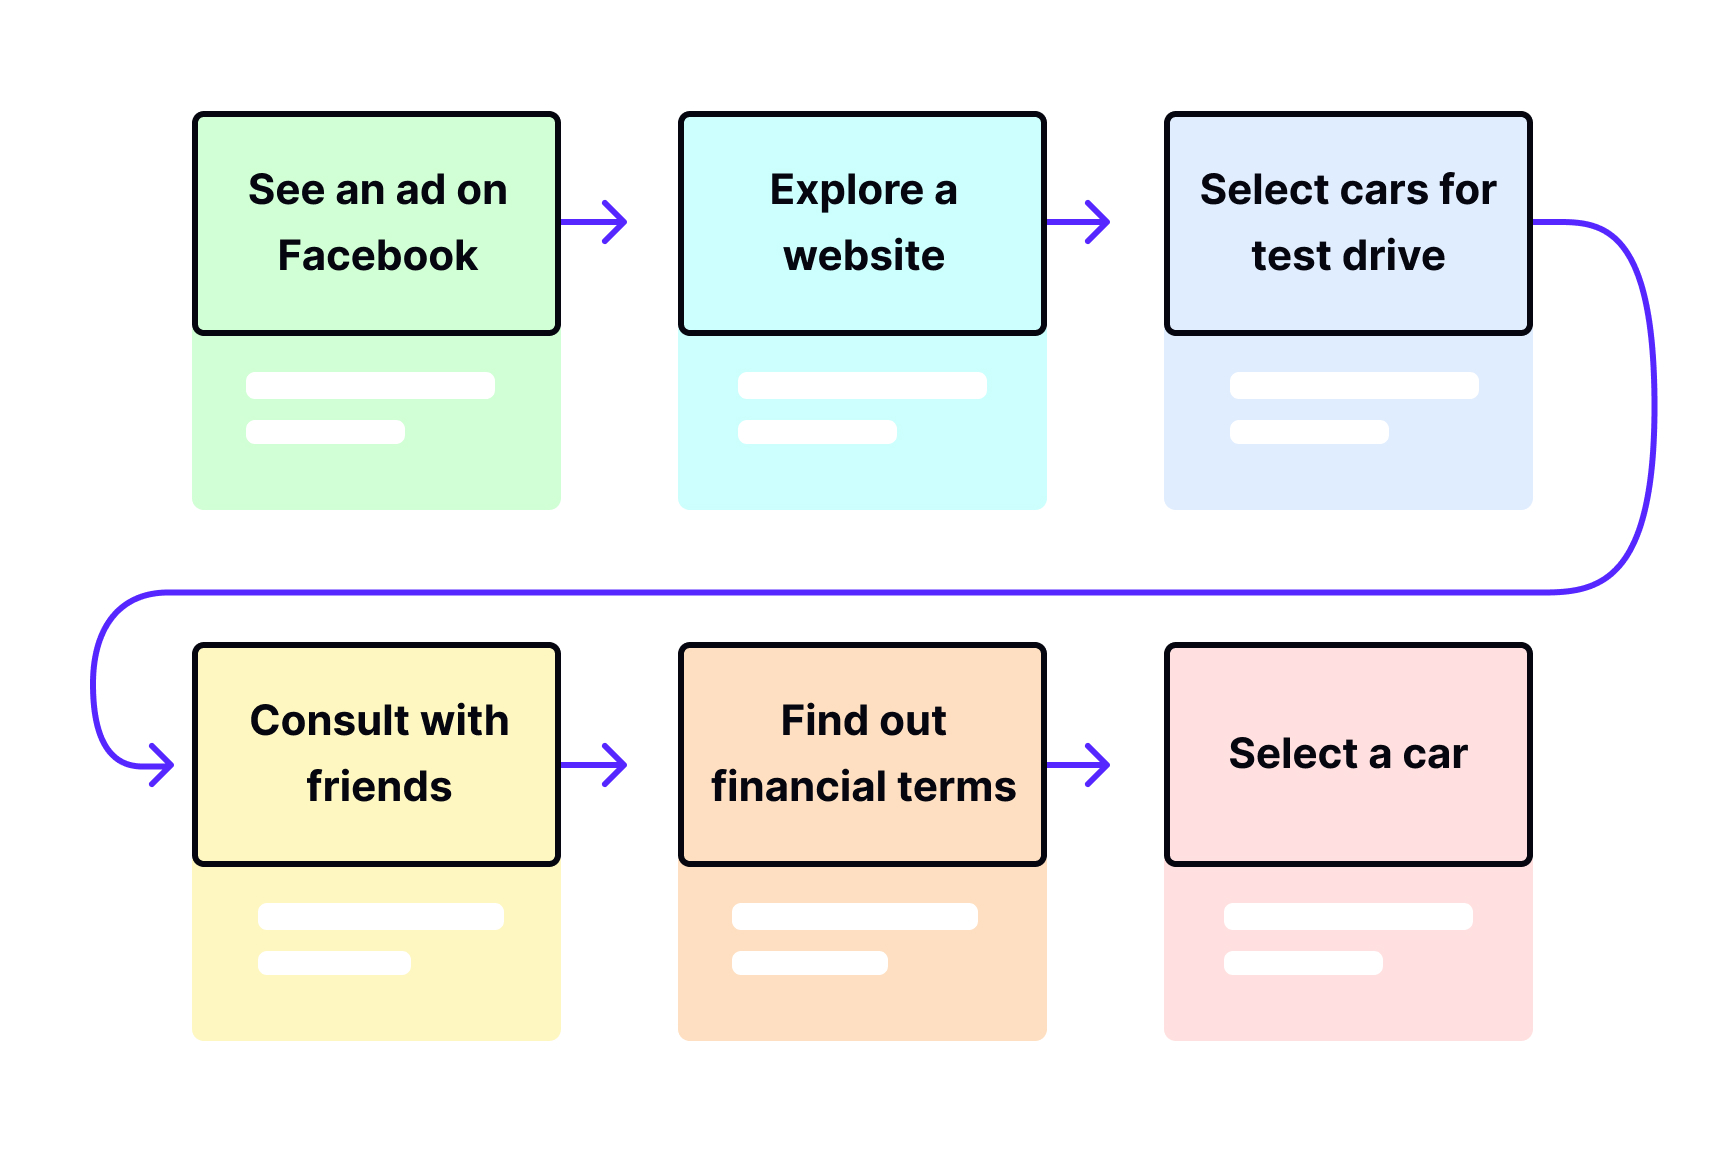
A journey map, however, is about specific factors in specific scenarios. For example, a journey map for an online shopping app would demonstrate what steps users take to buy a necessary item online on a given app and identify problems like doubts about product quality, trust issues, delivery time, complex navigation of a website, or blurry images.[2]
Journey maps reflect the experience of users fulfilling their goals when using your product, service, or
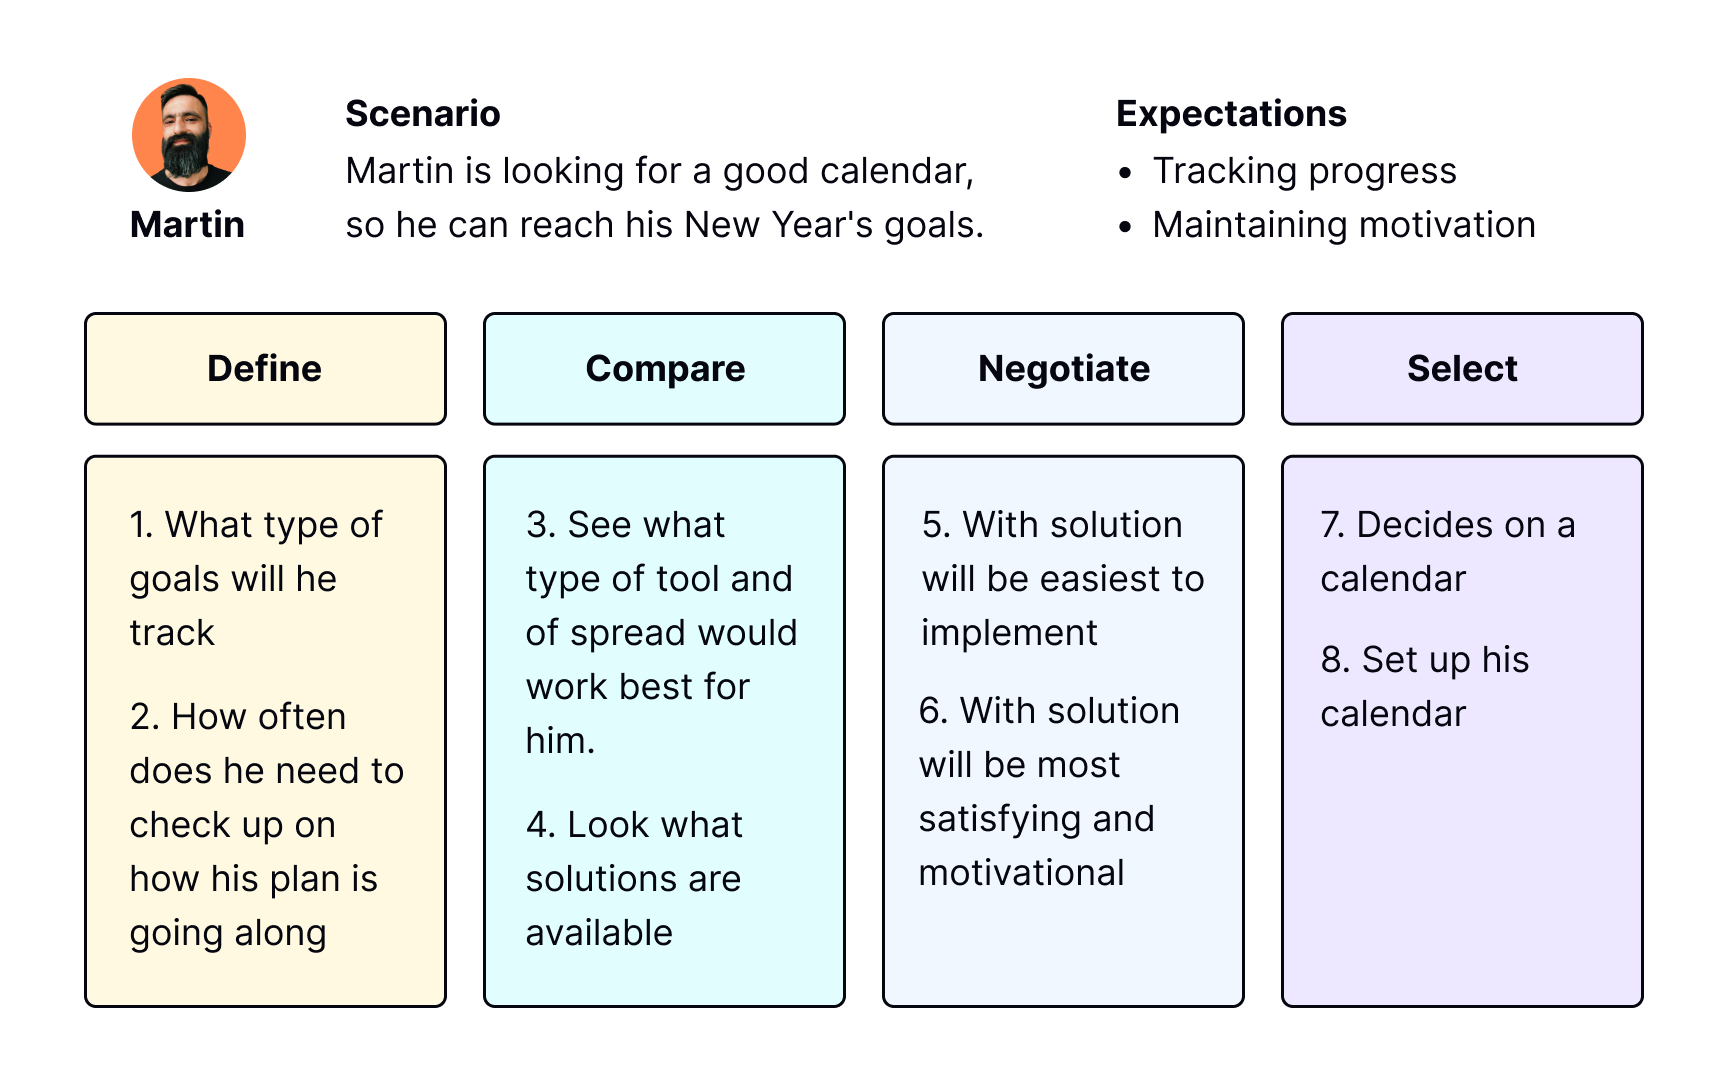
There are 3 critical elements of a
- Actor: This is the persona/user who experiences the journey.
- Scenario and expectations: A scenario describes the situation that occurs when an actor takes certain actions to achieve their goal and has certain thoughts and expectations about it. The scenario can be real (for existing products or services) or anticipated (for products or services at the design stage).
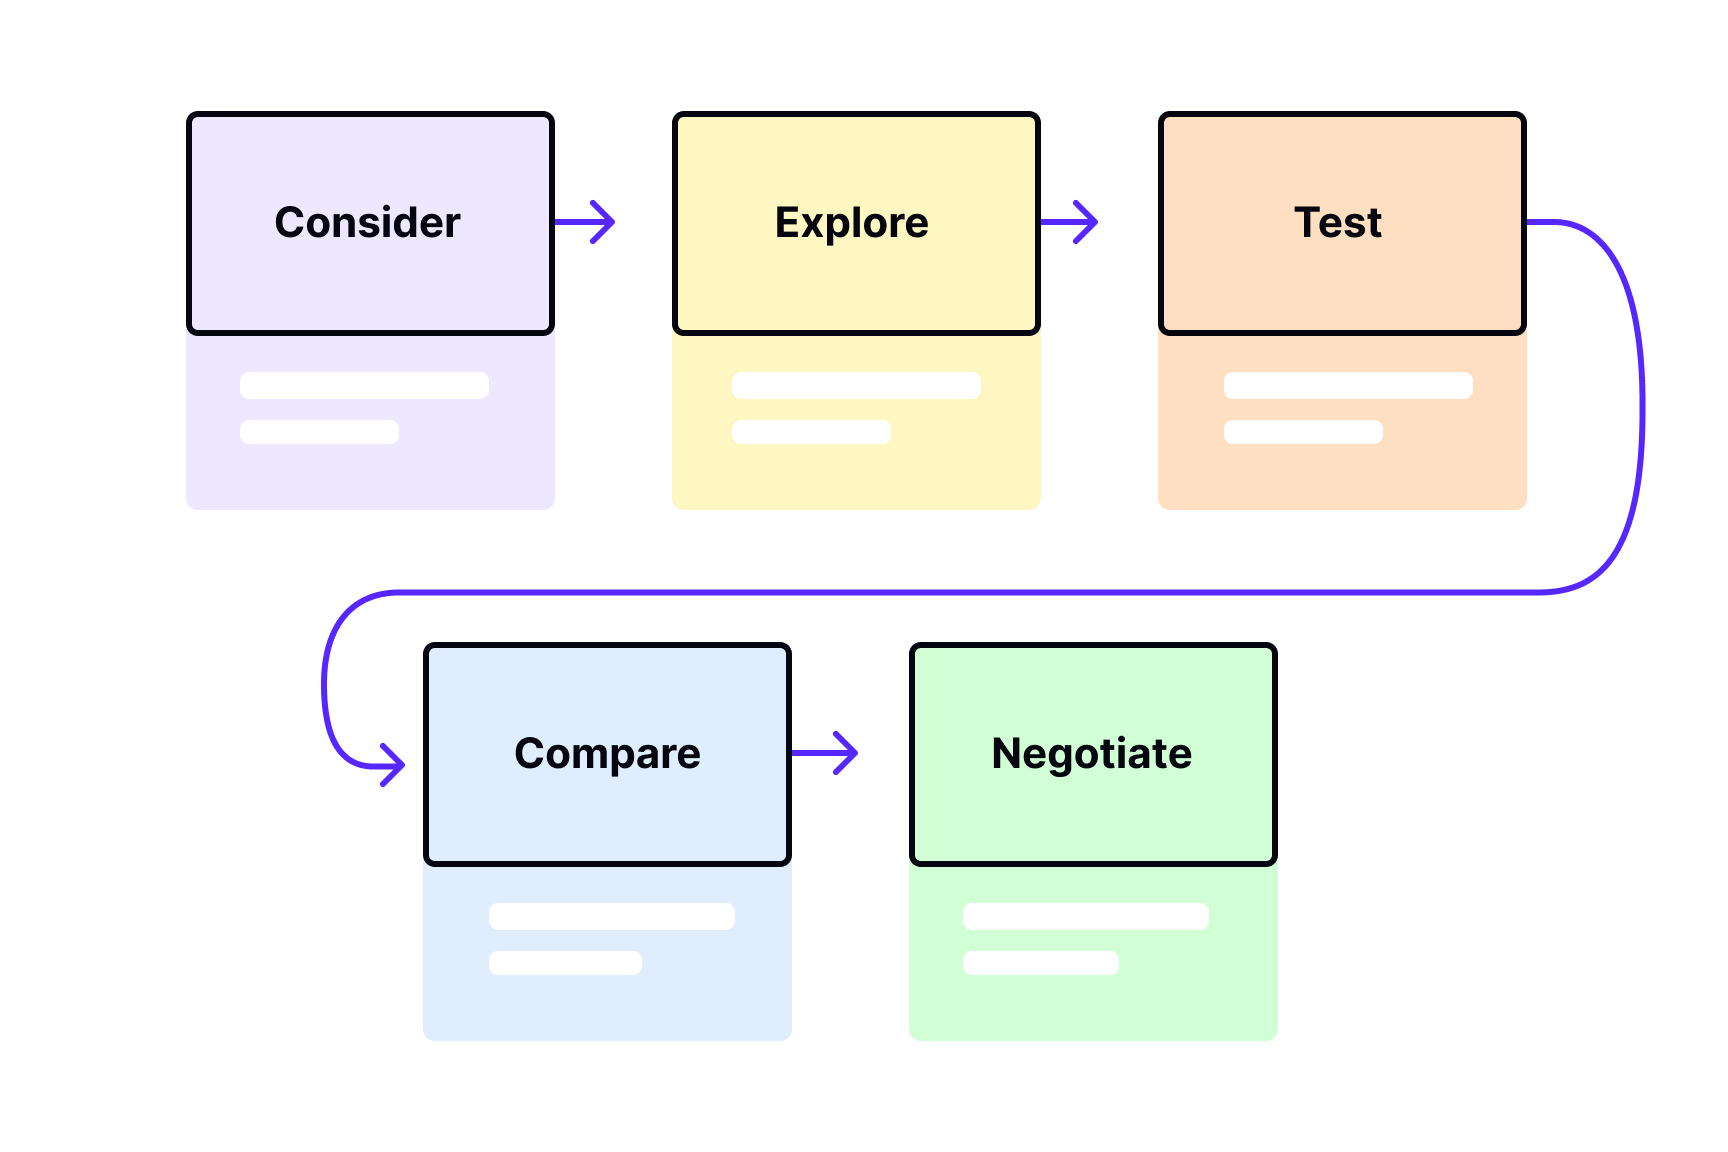
- Journey phases: Journey phases are the different high-level stages in the user journey.
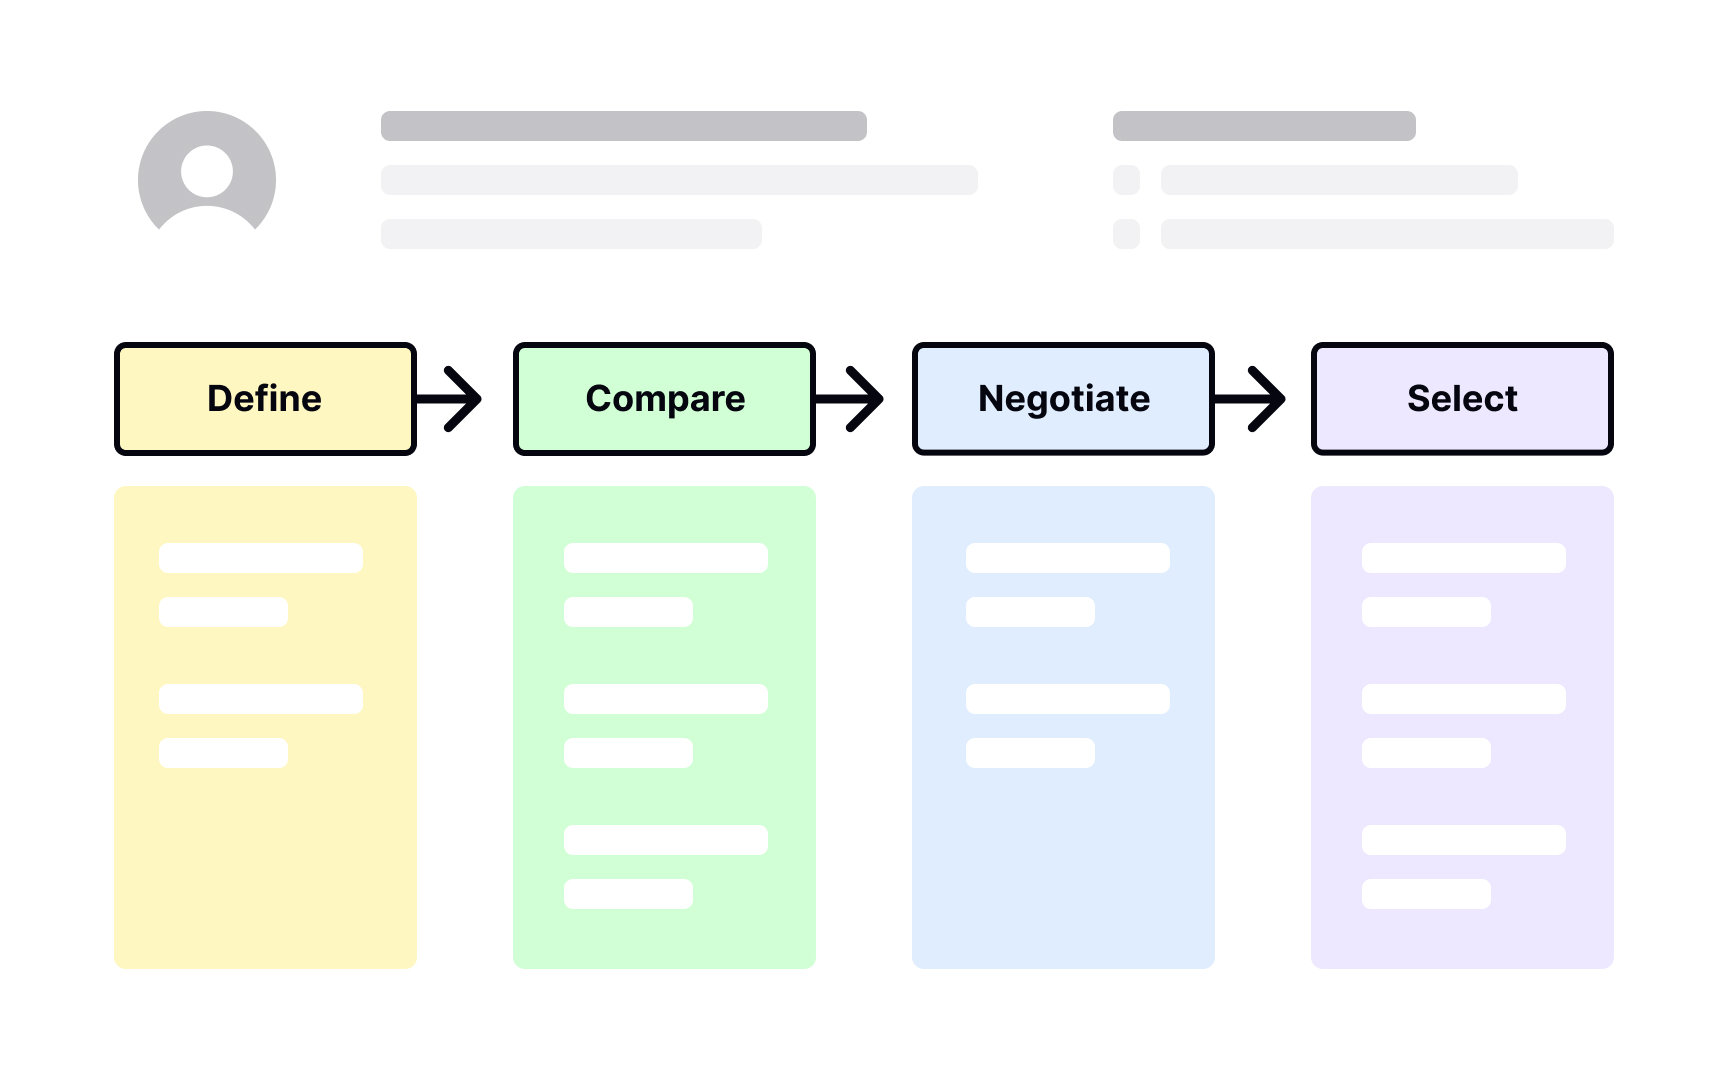
Journey phases help organize thoughts, mindsets, and feelings in the journey map. Each scenario usually has different journey phases. For example, the phases for a scenario about changing a mobile plan could be: define, compare, negotiate, and select. A scenario of ordering a takeaway from a restaurant could include phases of: awareness, consideration, conversation, customer service, and loyalty.
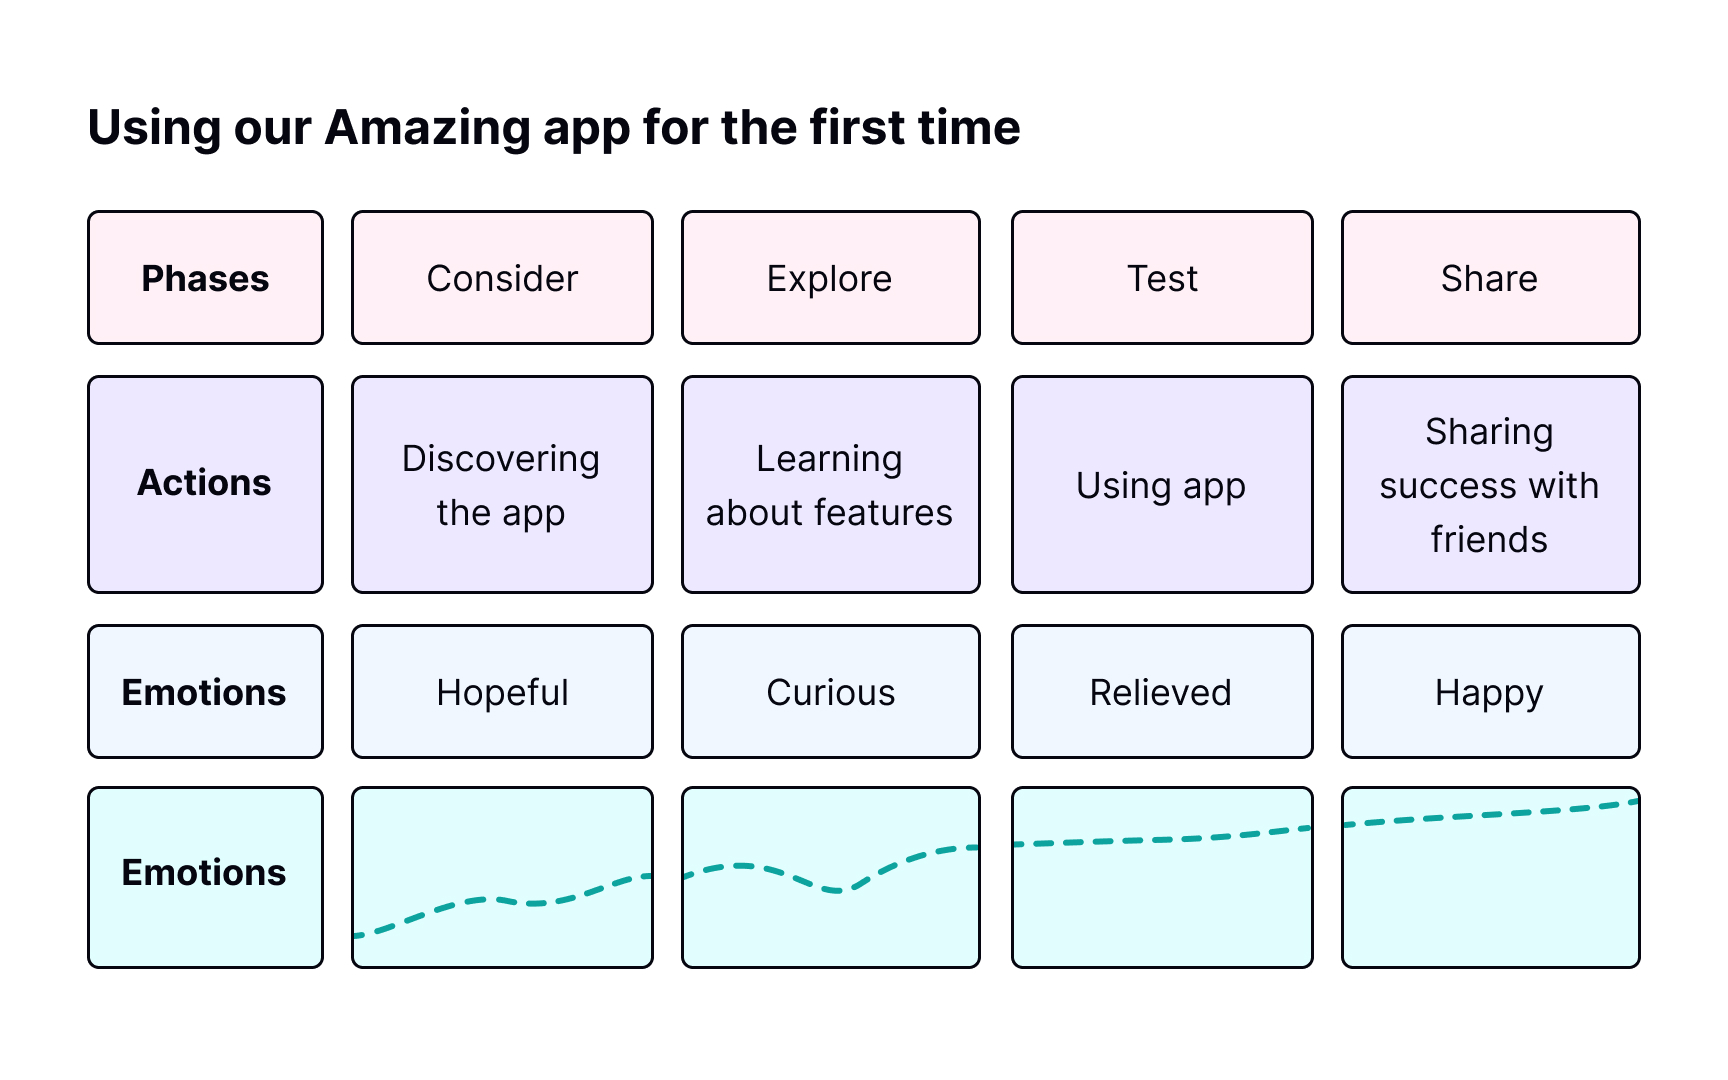
Instead of focusing on a single user or persona's journey,
Like
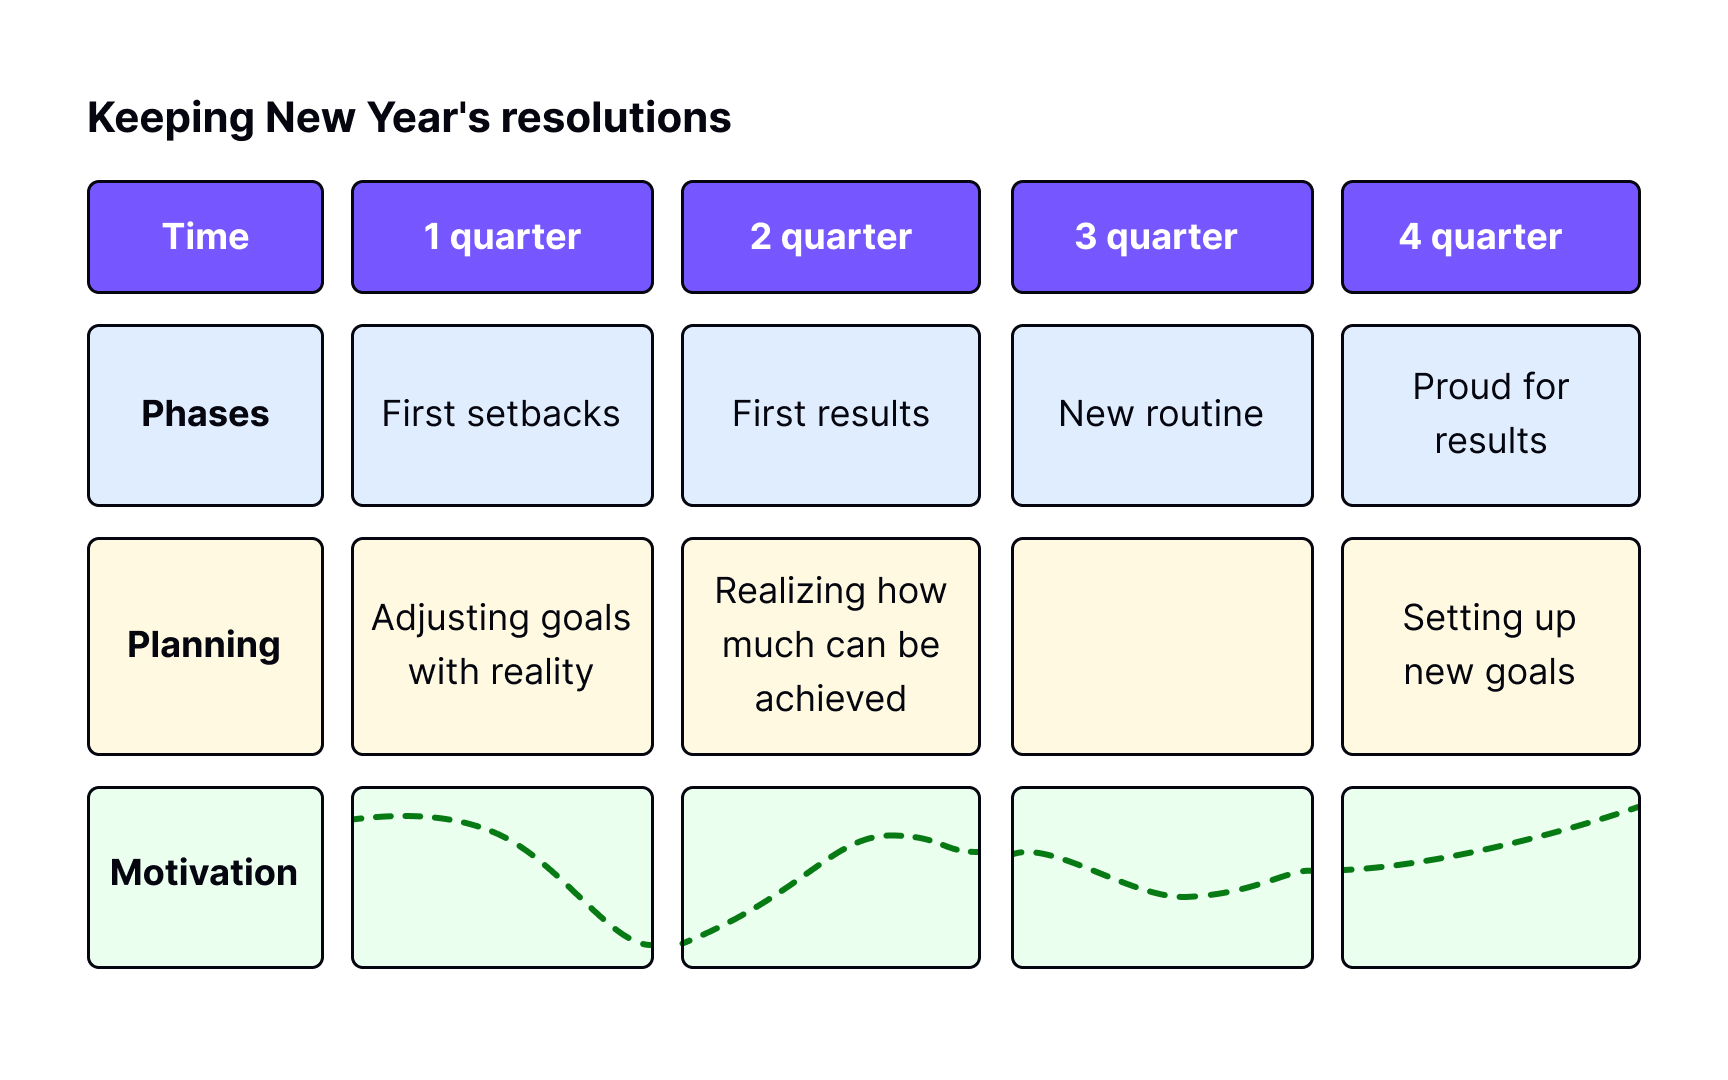
- Phases: Phases define major goals that users want to achieve on their journey.
- Actions: Actions refer to actual steps people take to achieve their goals.
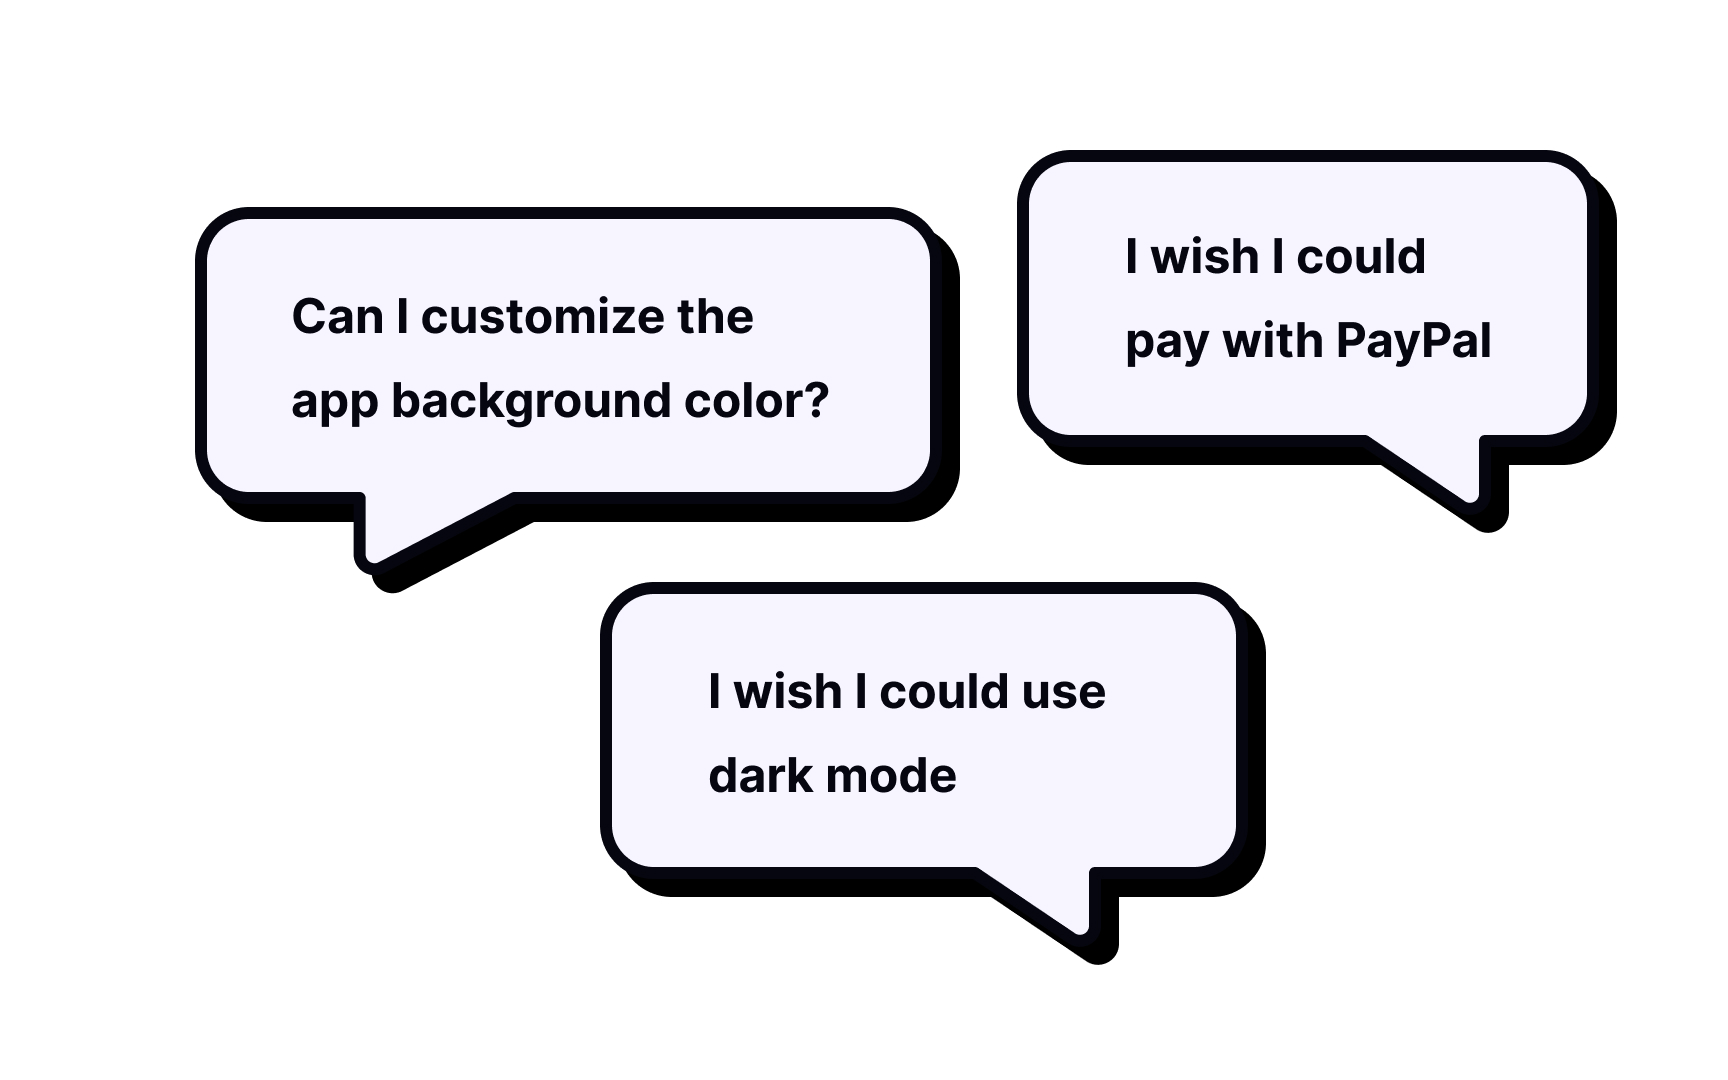
- Thoughts, mindsets, emotions: The map should reflect what emotions and thoughts arise while users go through an experience.
In the end, scan each phase of the
The definition of phases is the first step for both experience and
Deciding the number of phases depends on your users' goals. Phases should demonstrate the entire experience or scenario, so you can easily identify where users drop off and what keeps them from going all the way to the end. Keep in mind that phases are not actions that users take to achieve a certain goal.
Also, remember that the map should be easy to navigate and read when you share it with your stakeholders. So, make sure it doesn't require horizontal scrolling.
Pro Tip: Most maps should be based on real user data so the first step in mapping is to conduct user research.
Once the phases of the journey are defined, start mapping out the user's actions, thoughts, and emotions at each step. Focus on common patterns found during research rather than including every detail.
When deciding what to show, aim for behaviors that repeat across journeys, thoughts, and feelings that reflect user motivations or concerns, and anything that reveals friction or unmet needs.
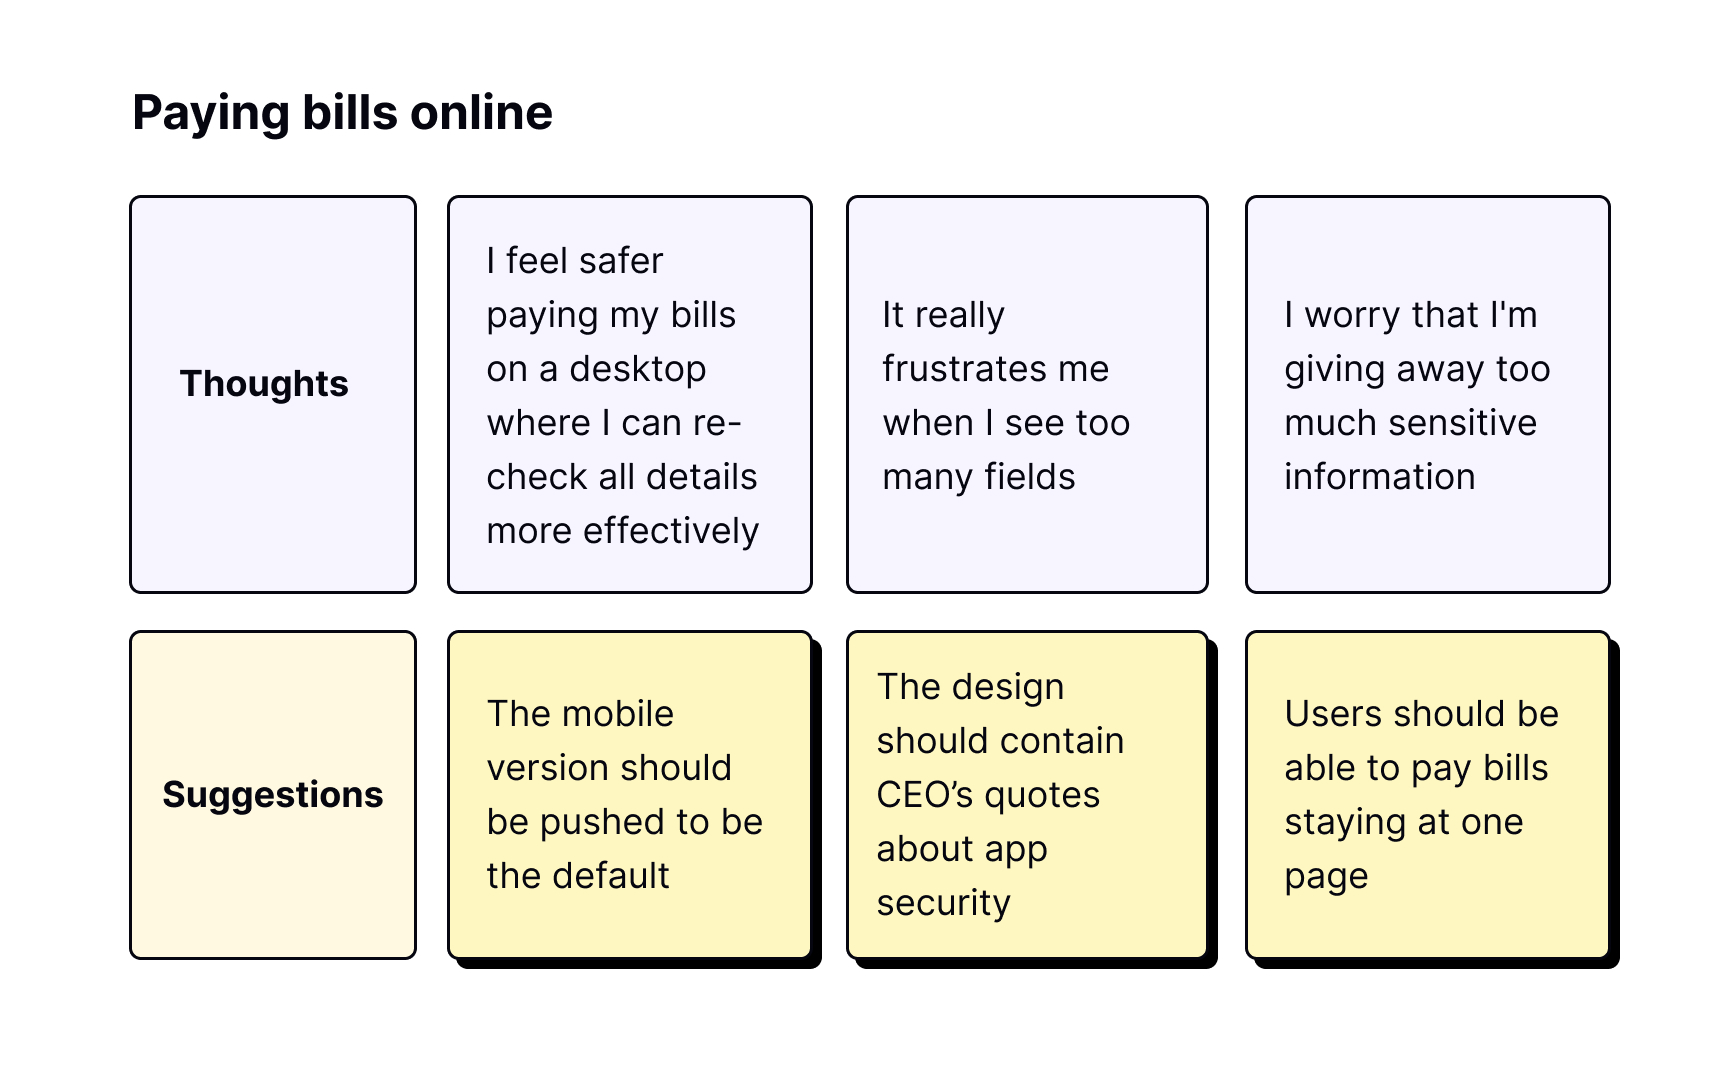
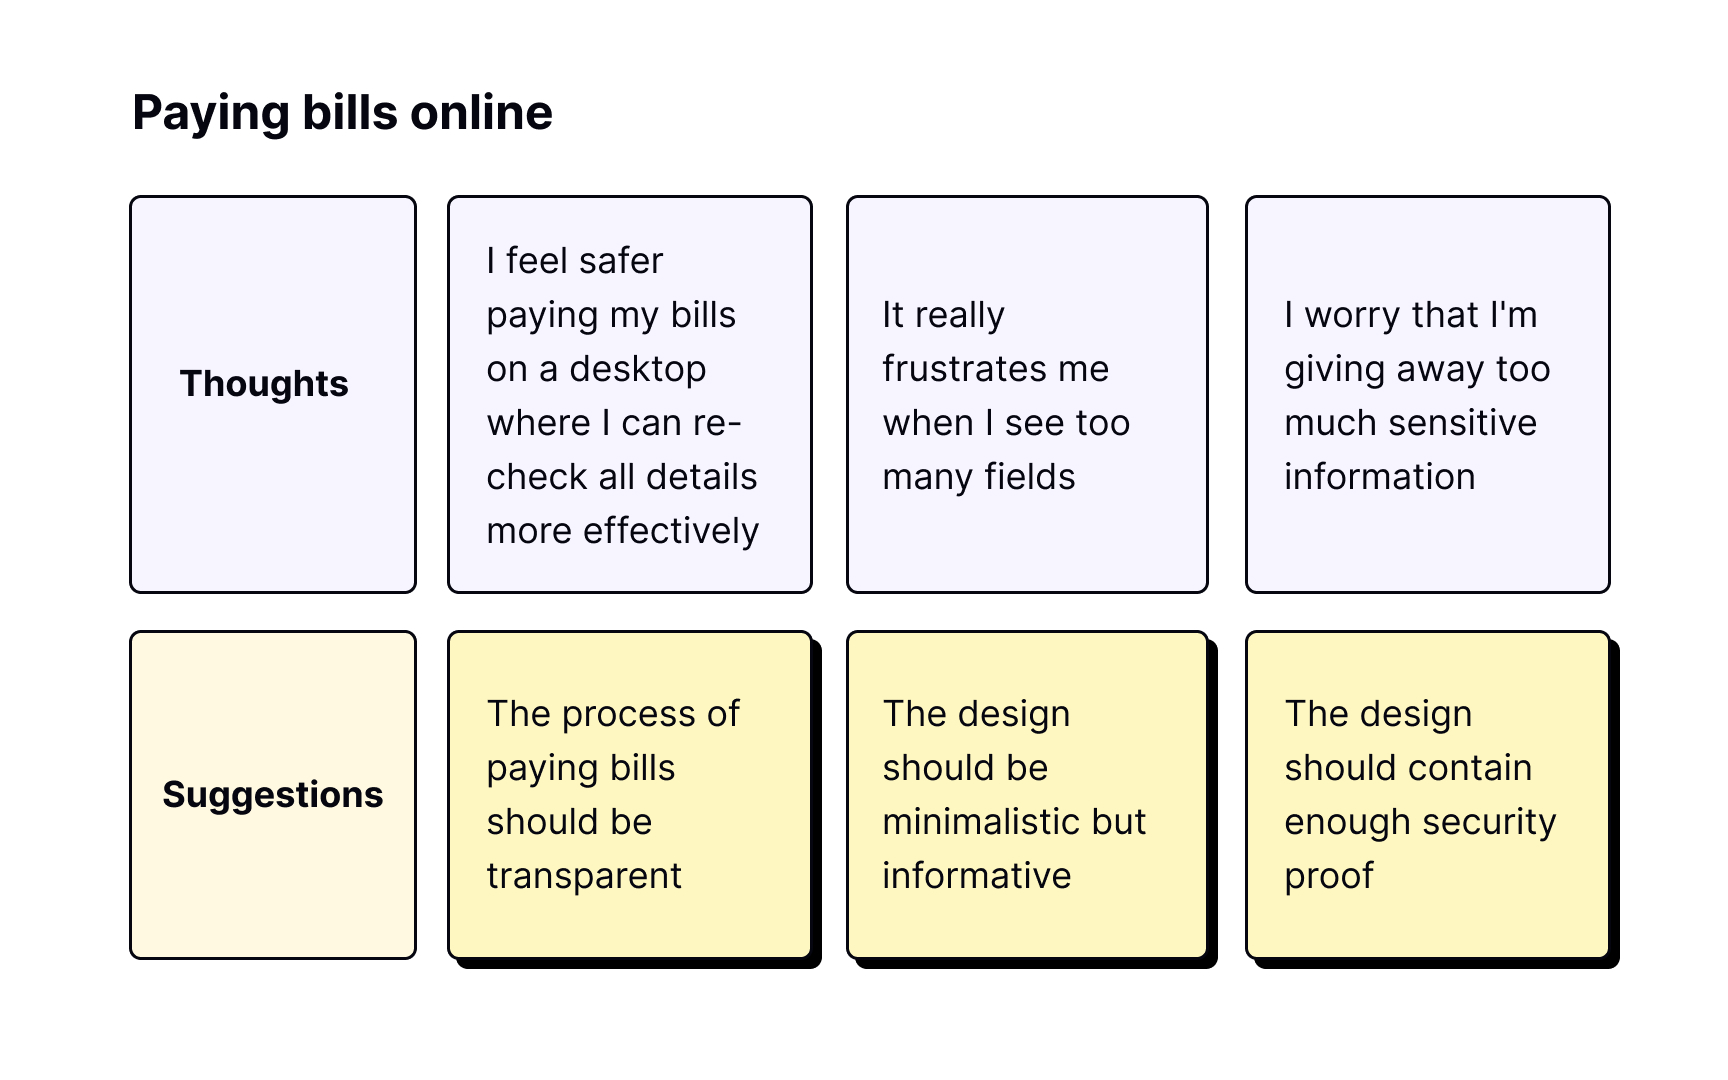
It's essential to involve stakeholders in the creation of experience/journey maps. Once each phase is filled with data, you and your teammates can evaluate the map, identify any points of friction, and offer opportunities. Opportunities stand for insights into what can be improved in the journey.[4]
When working on a
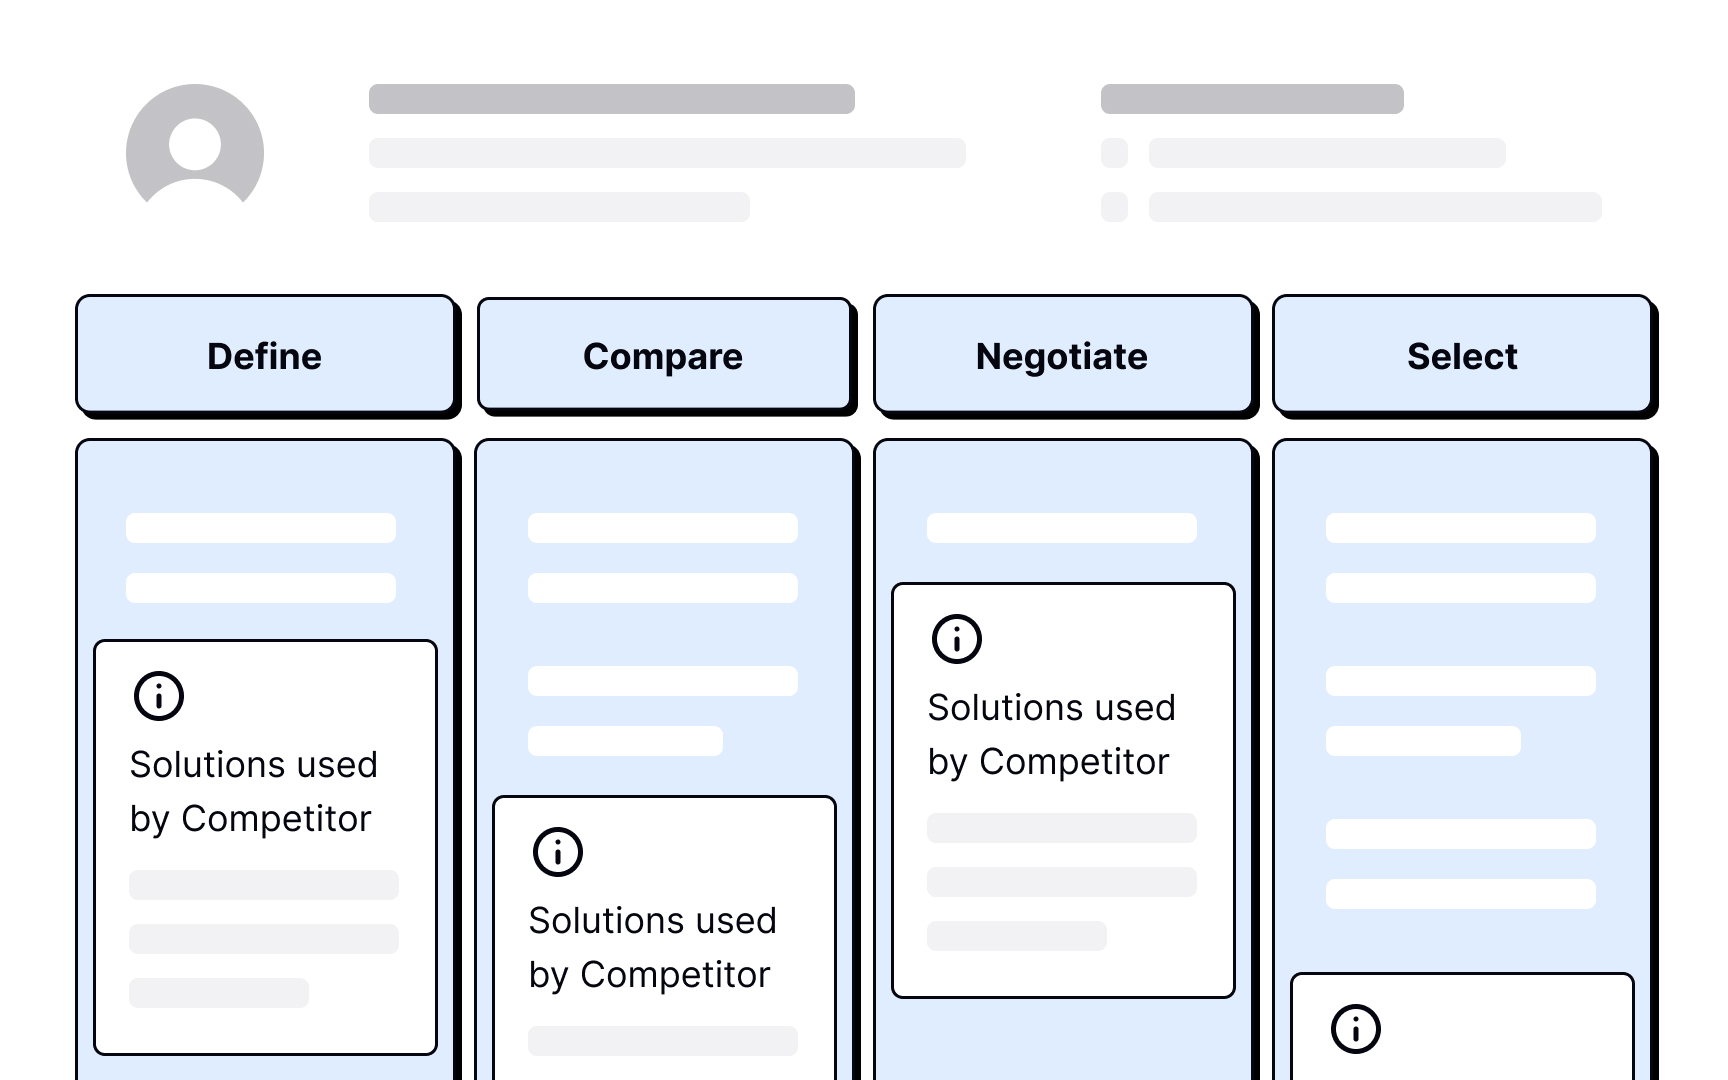
Competition sparks progress. Don't miss the opportunity to map what competitors do at each stage of the user/persona journey. This may require prior
Your map's phases and user goals help define the main comparison criteria before you start. You can always add more criteria along the way if necessary.
What are the benefits of evaluating your competitors?
- Prevent failures and learn how to avoid them
- Discover how competitors solve similar usability issues
- Discover competitors' strengths and weaknesses
- Learn about trends and innovations in your product field
The most effective ways to evaluate your competitors include:
- Using competitors' products and evaluating all the customer touchpoints and channels — the medium of interaction between a customer and an organization[5]
- Read reviews about competitors' products on social media, mobile app stores, marketplaces, or similar resources
- Conduct usability testing of competitors’ products[6]
Pro Tip: Start mapping the competition with 3-5 main competitors.
The beauty of any type of map is that you can display the way things are right now or the desired state of things.
Current mappings show the actual state of
Future mappings represent the desired state of user experience. They help set goals for creating a product or service that will be tailored to user needs.[7]
Make sure you don't confuse the idealistic visualization of future maps with how things really are. You can use future maps for building and checking hypotheses during
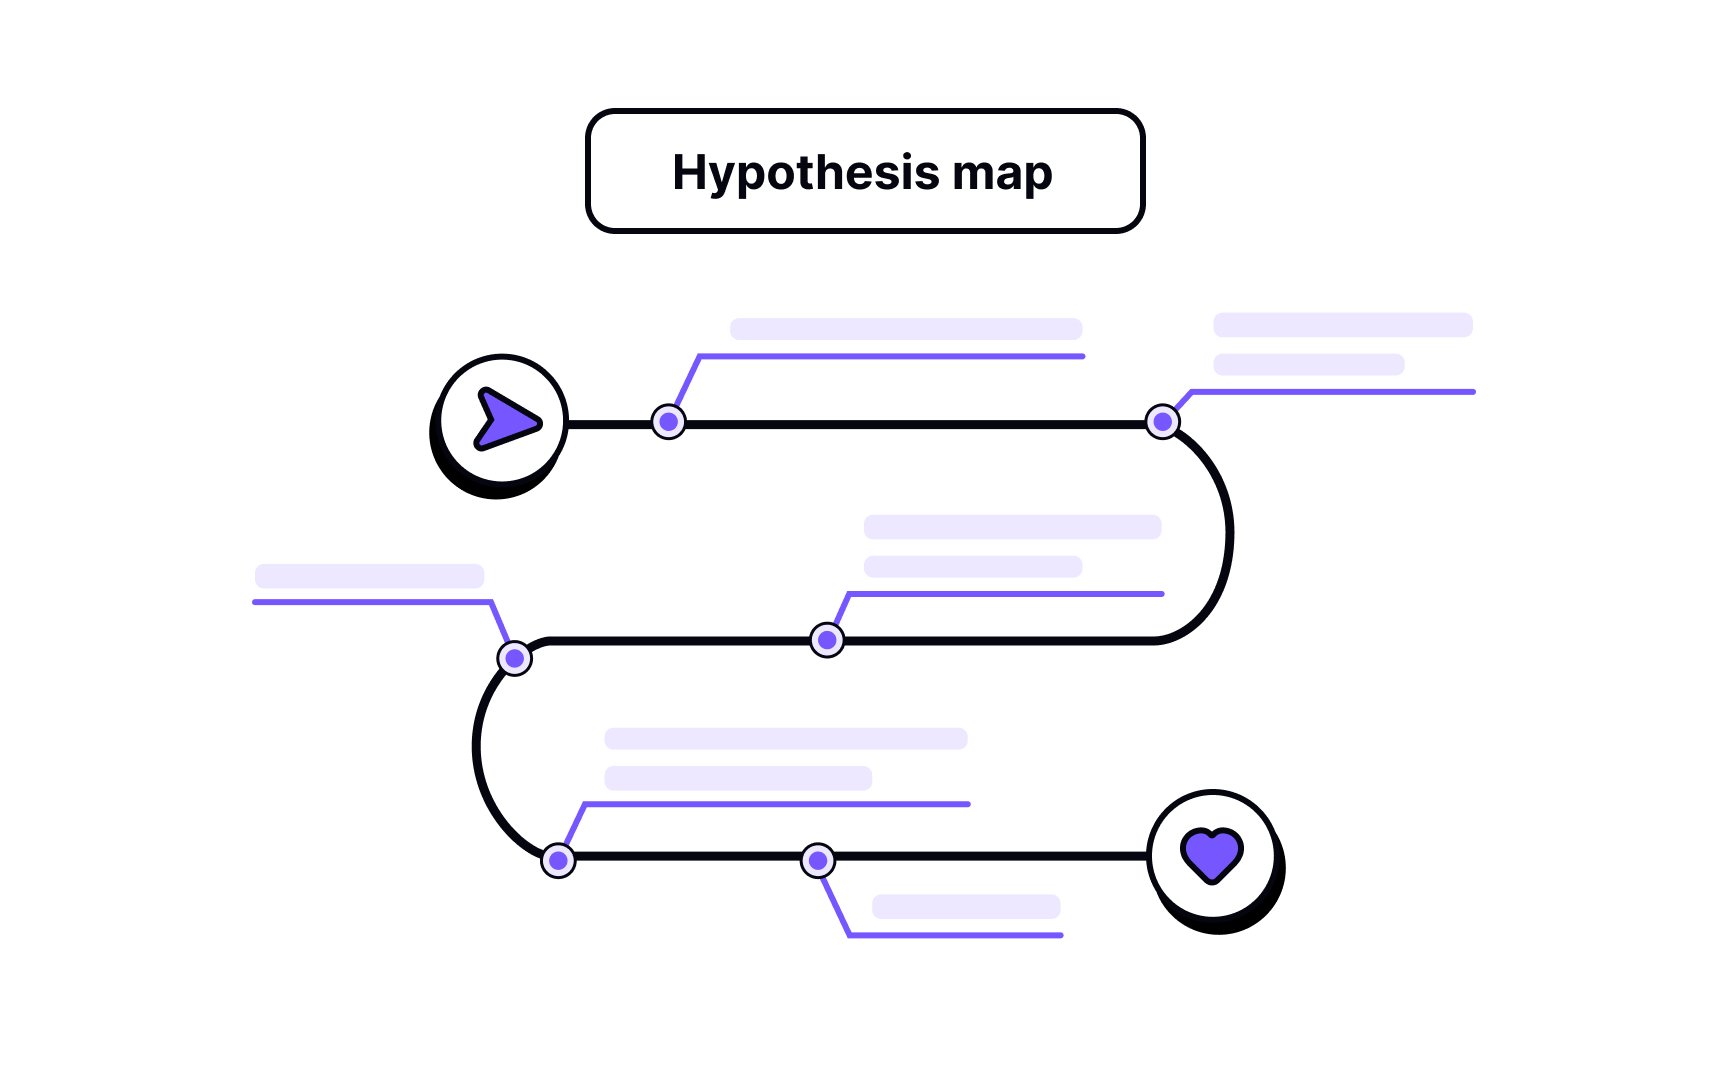
When planning an experience or
- Hypothesis maps are based on the team's expectations and assumptions about how things are. This approach allows compiling the perspectives of all team members, formulating a
research plan, and creating a user research-based map. - Research maps are based on the research data gained for building the map. While this method is time-consuming and costly, it yields the most intriguing and useful insights into user behavior, needs, pain points, and preferences.
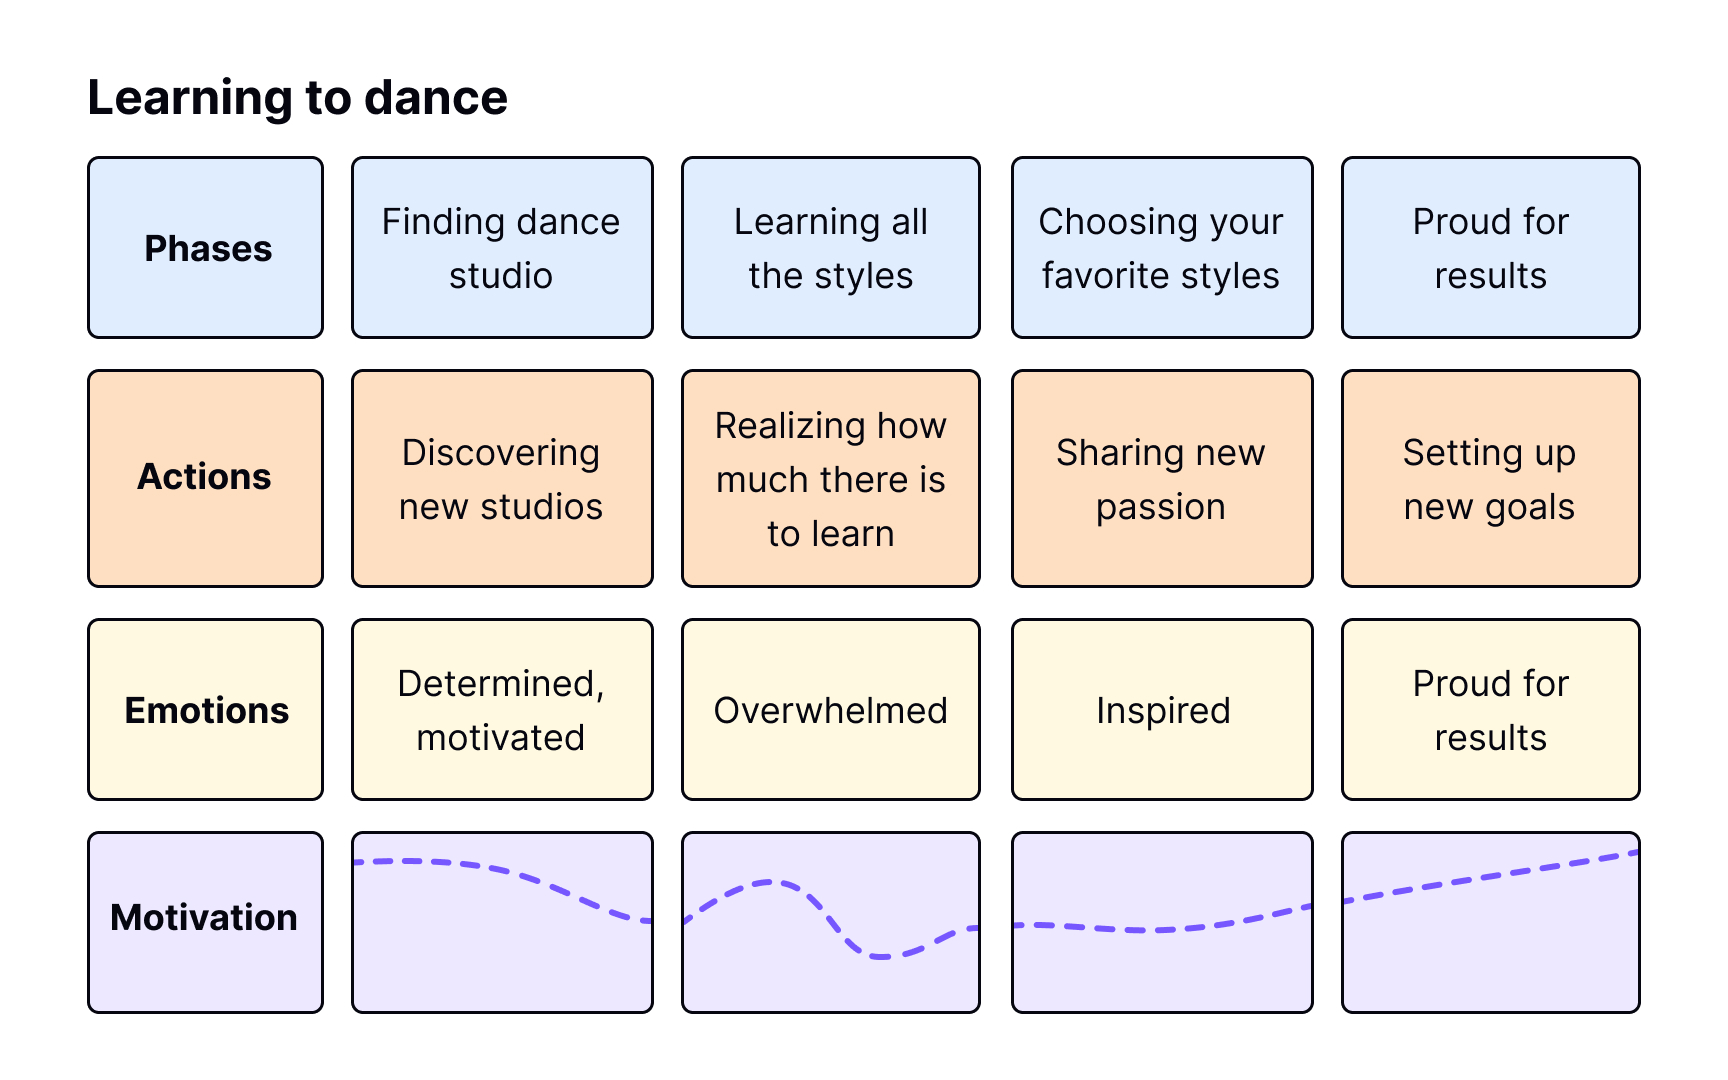
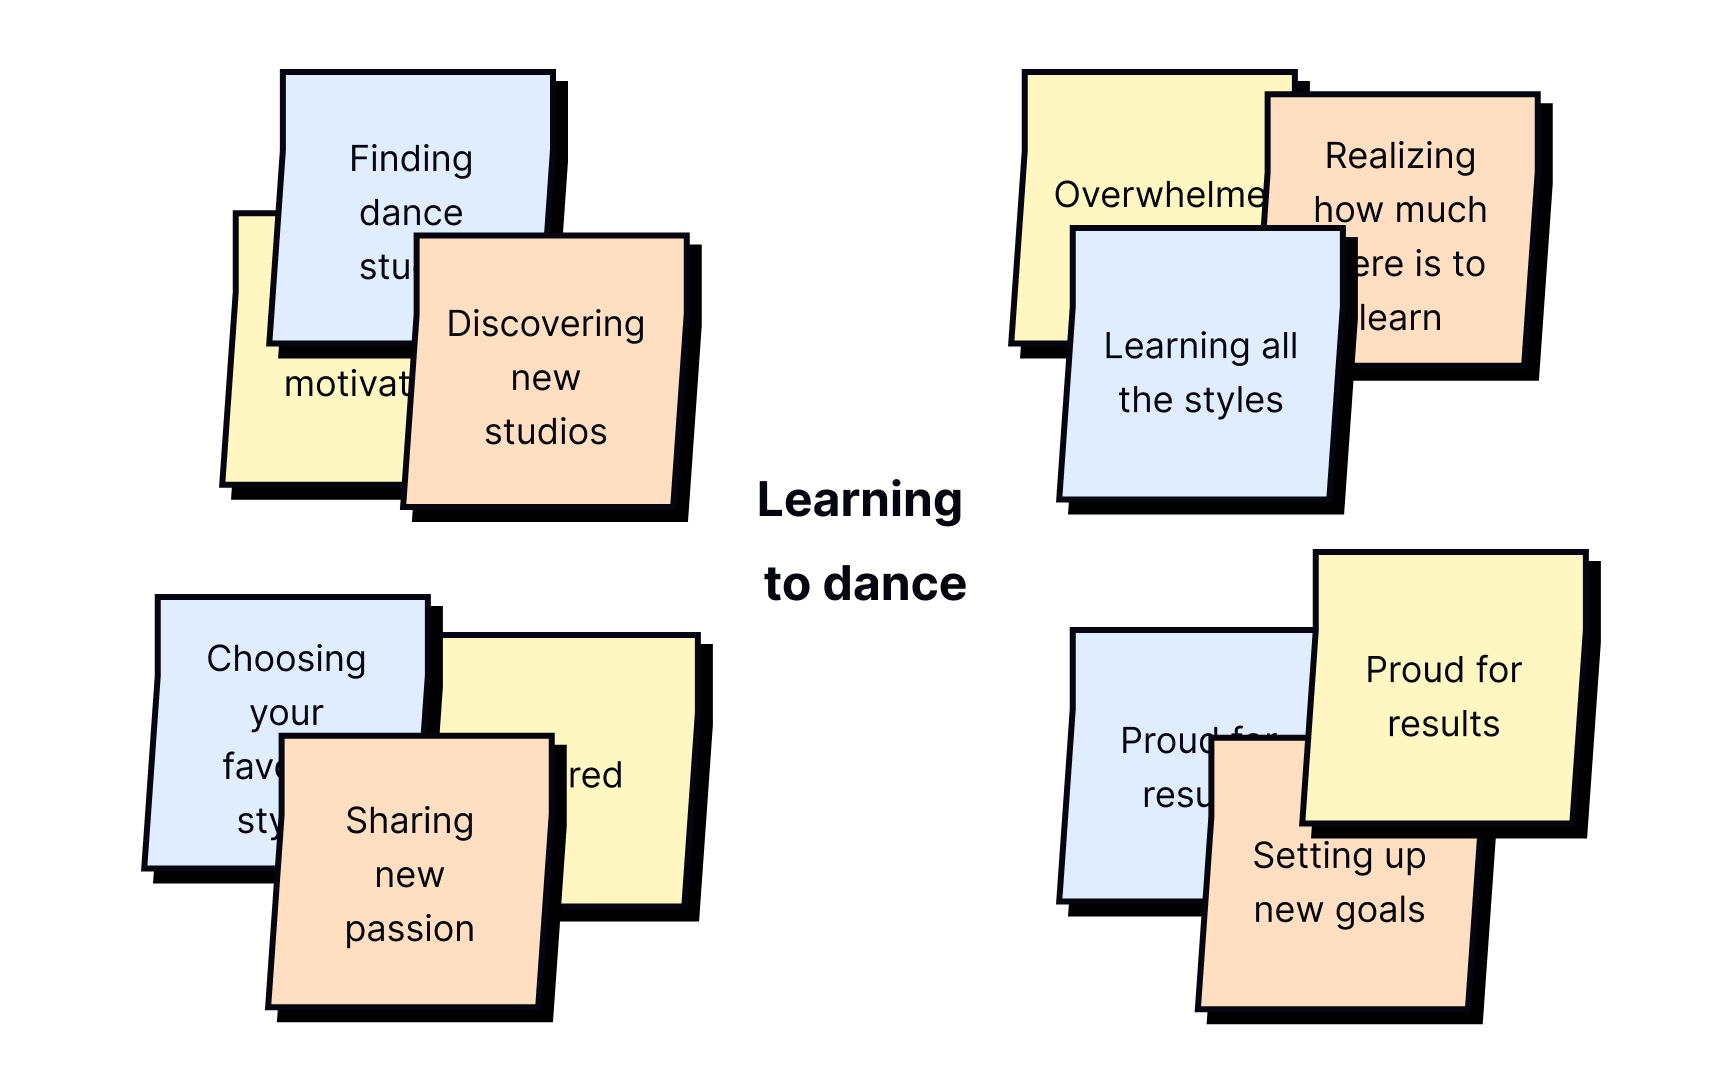
The fidelity level of your map depends on what
- Like low-fidelity prototypes, low-fidelity maps are better for the initial stages. They're created with materials at hand (for example, sticky notes and a whiteboard) and are easier to change and move around. You can also use digital tools like Miro or Mural to this end. Low-fidelity maps are perfect for brainstorming, revising, and updating.
- High-fidelity maps are more polished and represent a final version. They're less flexible for updates and are usually created digitally as a
UX artifact that can be easily shared with stakeholders.
References
- Journey Mapping 101 | Nielsen Norman Group
- UX Mapping Methods Compared: A Cheat Sheet | Nielsen Norman Group
- How To Build an Experience Map | UX Magazine
- How Channels, Devices, and Touchpoints Impact the Customer Journey | Nielsen Norman Group
- Competitive Analysis for UX – Top 6 Research Methods | Studio by UXPin
- UX Mapping Methods Compared: A Cheat Sheet | Nielsen Norman Group
Top contributors


Topics
From Course

Share


Similar lessons

UX Design Processes & Research Methods

Qualitative UX Research Methods
