Tracking engagement and adoption indicators
Engagement metrics show how actively users return to and interact with a product. Adoption metrics capture whether a product becomes part of their routine. Looking at both gives a more complete picture of value and habit formation.
Important engagement measures include:
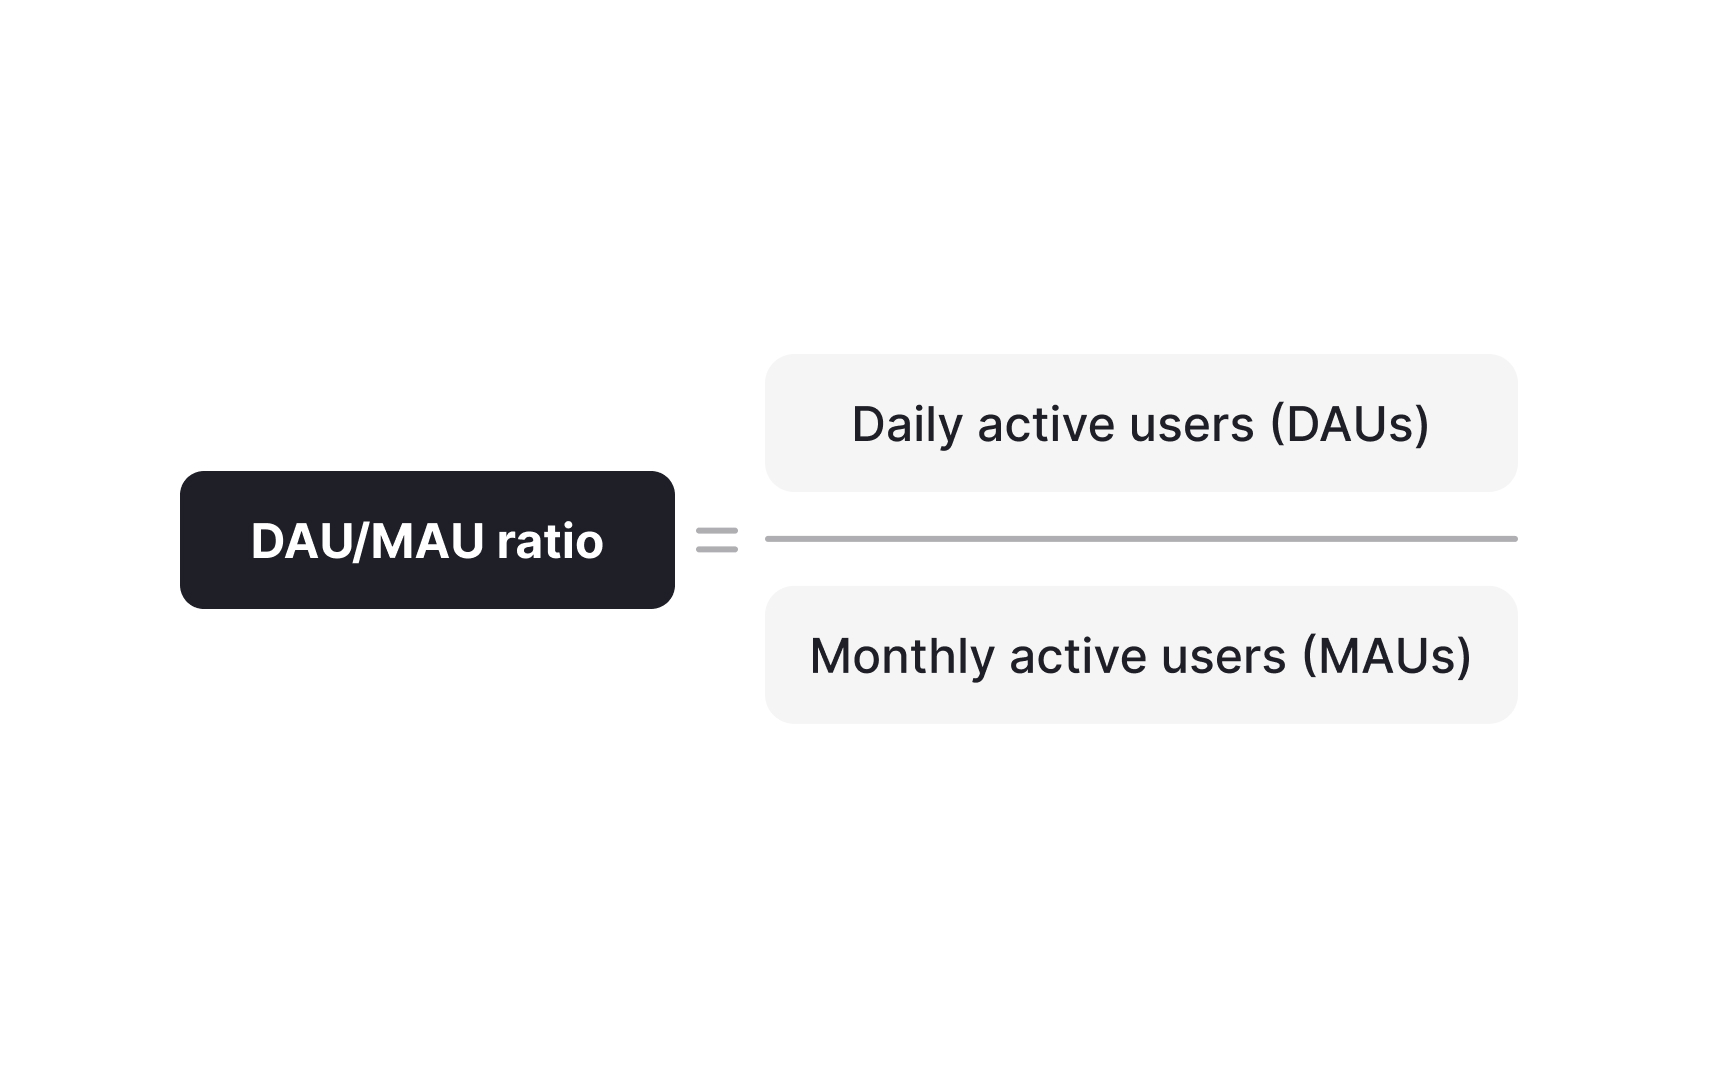
- Daily active users (DAU) and monthly active users (MAU): their ratio signals how sticky the product is.
- Session duration: reflects how long users stay engaged during each visit.
- Session frequency: shows how often users return within a given period.
Adoption indicators complement these:
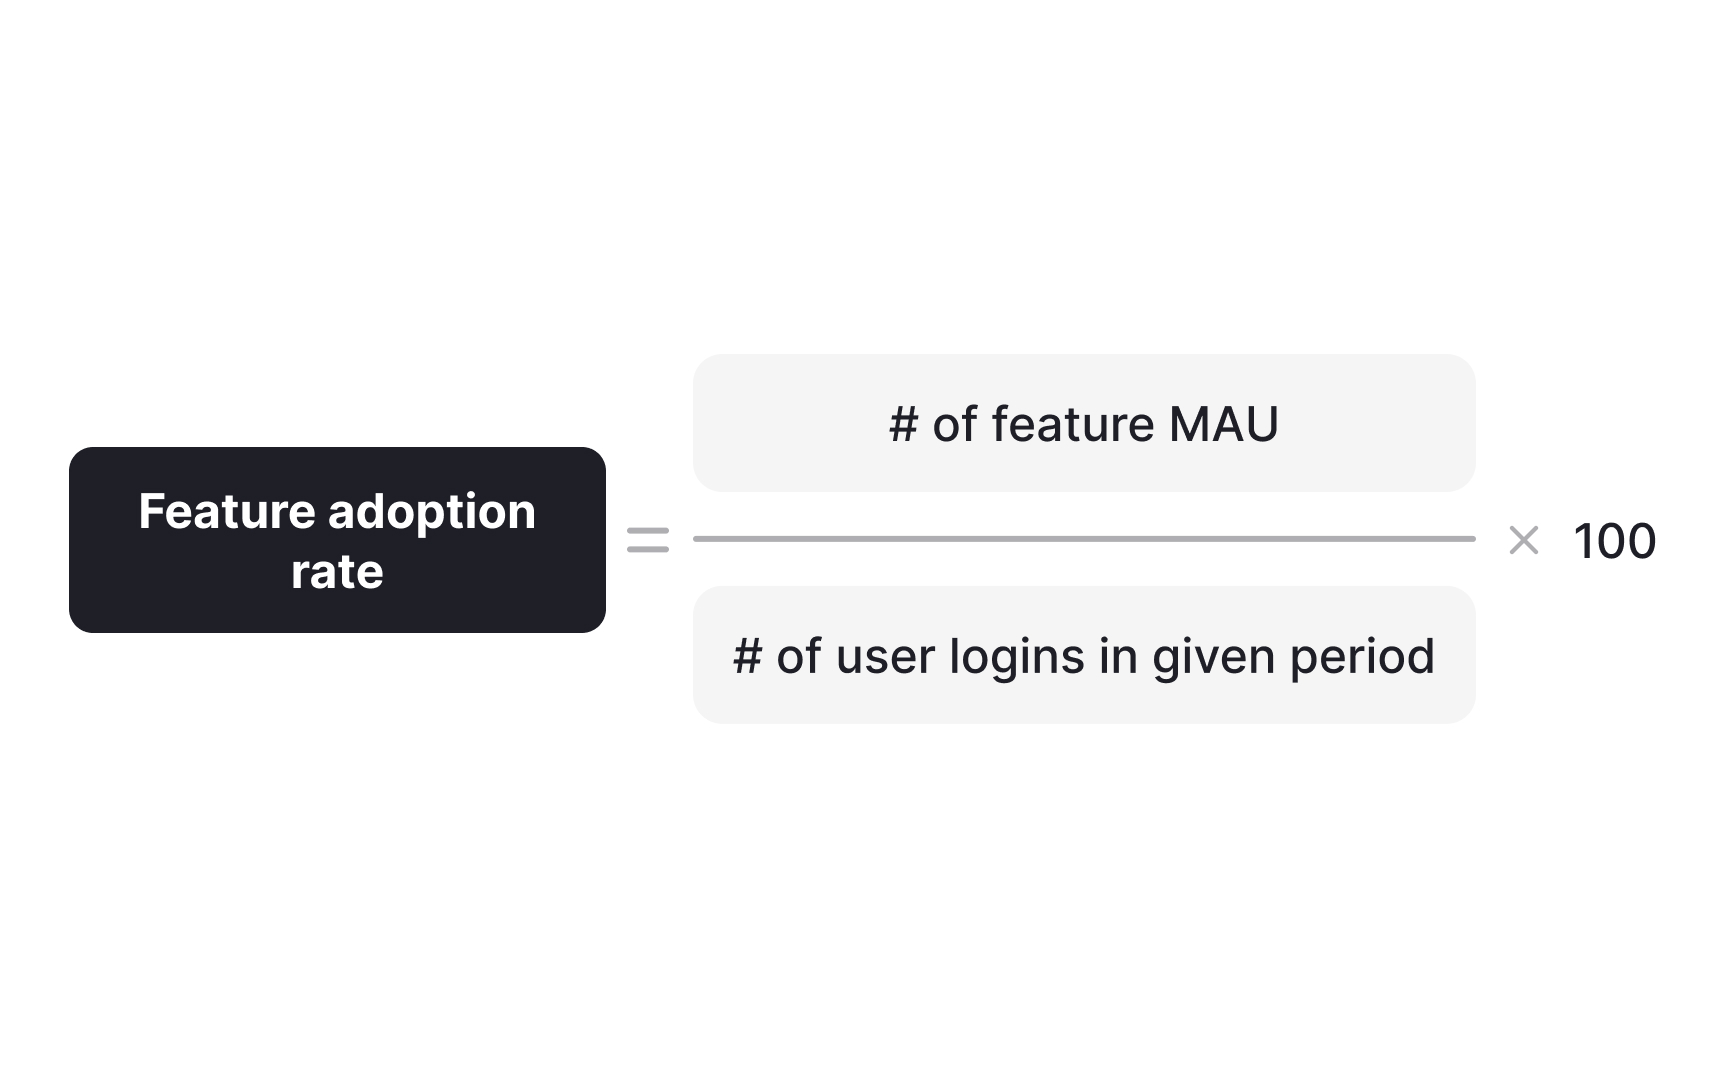
- Feature adoption rate: reveals how quickly new features are discovered and used.
- Overall adoption rate: shows whether trial users become repeat users and integrate the product into their workflow.[1]
Together, these metrics highlight whether a product sparks one-time curiosity or sustained interaction. They also guide decisions on where to improve onboarding, highlight valuable features, or reduce friction.
