Quantifying Impact
Use core product metrics to ground decisions in evidence and separate meaningful insights from noise.
Every product decision carries assumptions about what users want, how they behave, and where value comes from. Metrics help turn those assumptions into evidence. They show whether ideas lead to adoption, satisfaction, and long-term growth, or whether they fall short.
Different kinds of metrics capture different stories. Acquisition and conversion rates reveal how people first connect with a product. Retention and churn expose whether they stay or drift away. Lifetime value and revenue measures highlight sustainability, while engagement metrics reflect the habits and emotions that form around daily use. None of these numbers alone is enough, but together they sketch a clearer picture of impact.
Relying on data brings focus and discipline, reducing the sway of hunches or loudest voices. At the same time, data is not infallible. Too many dashboards can paralyze decisions, and overemphasis on numbers risks ignoring context or creativity. The real skill lies in balancing quantitative measures with qualitative insights, filtering noise with frameworks, and anchoring choices to a North Star metric. This is how product teams cut through information overload and make decisions that stand on solid ground.
Metrics, KPIs, and OKRs often appear together, but each plays a distinct role in product management. Metrics are the raw measures that describe activity or outcomes, such as the number of sign-ups, average session length, or bounce rate. They provide useful observations, but on their own, they may not signal success or failure.
KPIs, or key performance indicators, are a smaller set of metrics elevated because they connect directly to performance and business goals. For instance, while website traffic is a metric,
OKRs operate at a higher level by pairing an objective with measurable key results. For example, a goal to increase engagement in a mobile app may include key results like boosting daily active users by 20 percent or extending average session time. Metrics and KPIs then serve as the evidence to track progress toward those results.[1]
Pro Tip: Use many metrics to observe, a few KPIs to monitor success, and OKRs to tie them to strategic goals.
Acquisition metrics capture the cost and efficiency of bringing people to a product, while conversion metrics show whether those people take meaningful actions. Both sides are essential: high traffic or sign-ups are only valuable if they lead to sustained use.
Key examples include:
- Cost per acquisition (CPA): measures how much it costs to attract a new lead, such as a free trial sign-up.
- Customer acquisition cost (CAC): includes all sales and marketing expenses to gain a paying customer.
- Conversion rate (CVR): the percentage of users who complete a desired action, from purchase to subscription.
- Time to first value (TTFV): shows how quickly users experience the product’s core benefit, which strongly influences
retention . - Funnel drop-off rate: identifies the exact stage where users leave before completing the journey.
Together, these measures reveal whether awareness translates into adoption and where improvements in onboarding or product flow are most needed.
Pro Tip: Measure both the cost to acquire users and the ease of their first experience. A short path to value makes every dollar more effective.
Engagement metrics show how actively users return to and interact with a product. Adoption metrics capture whether a product becomes part of their routine. Looking at both gives a more complete picture of value and habit formation.
Important engagement measures include:
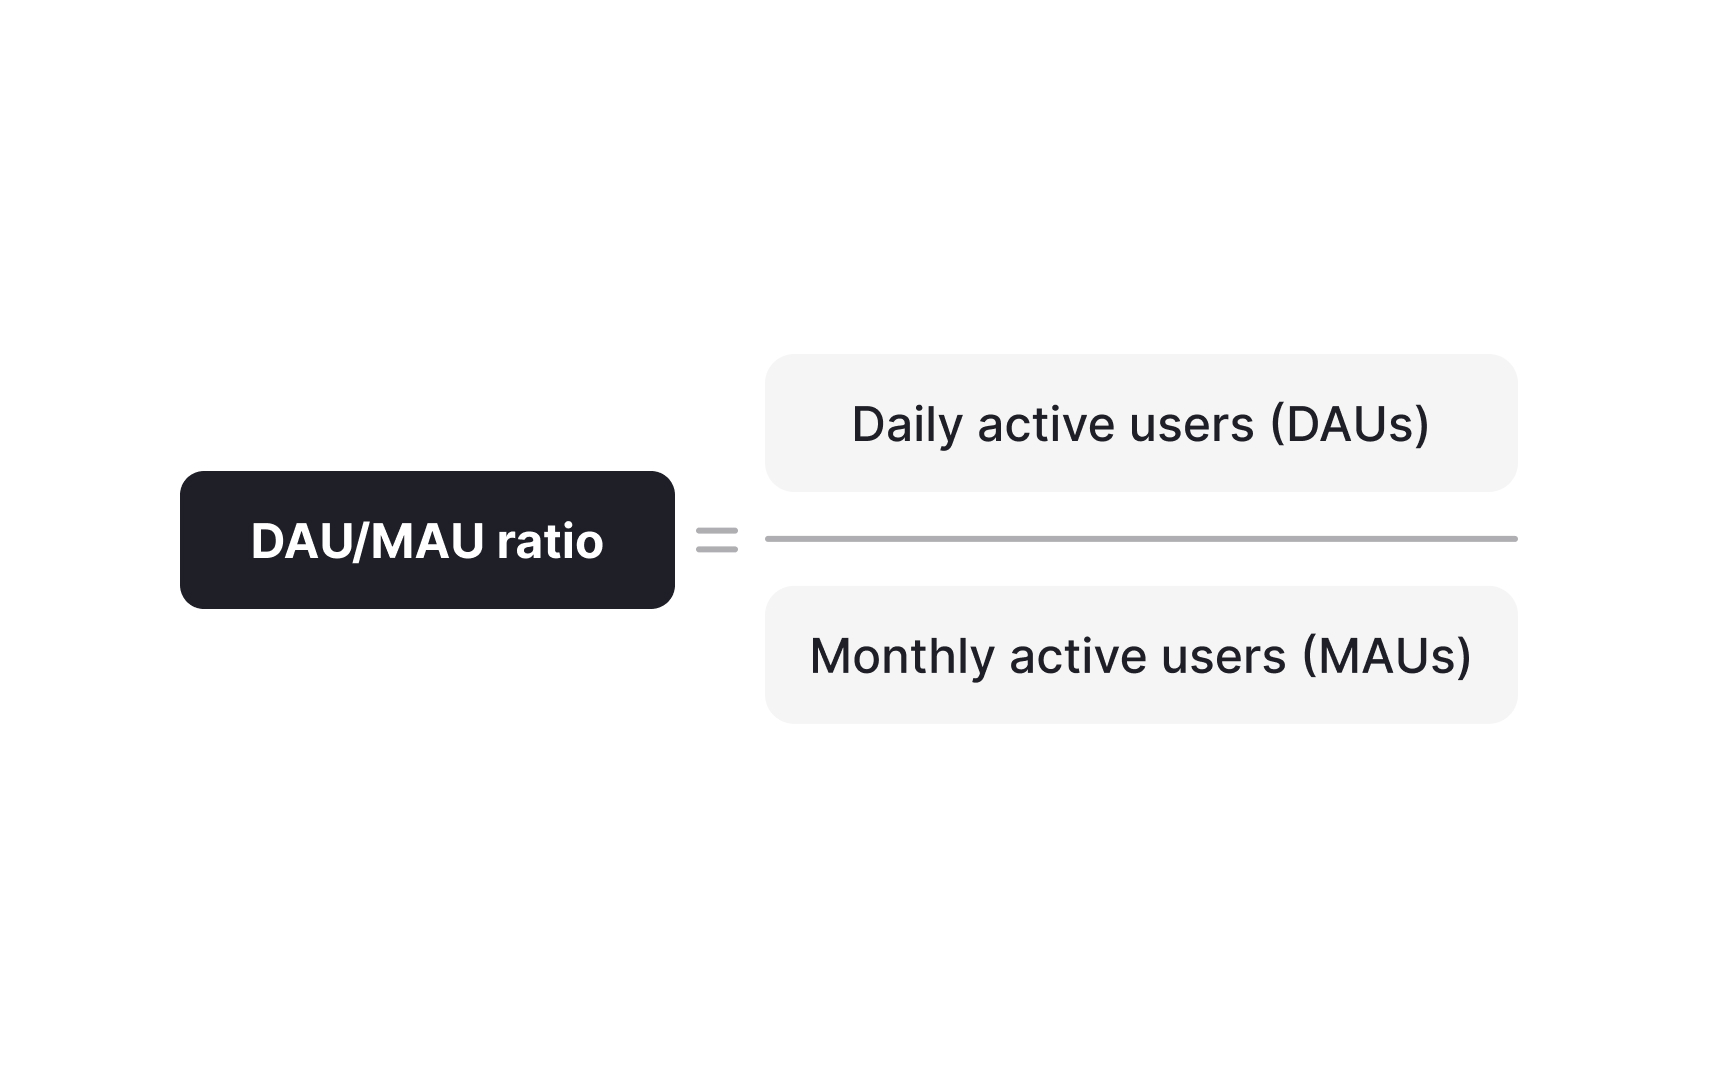
- Daily active users (DAU) and monthly active users (MAU): their ratio signals how sticky the product is.
- Session duration: reflects how long users stay engaged during each visit.
- Session frequency: shows how often users return within a given period.
Adoption indicators complement these:
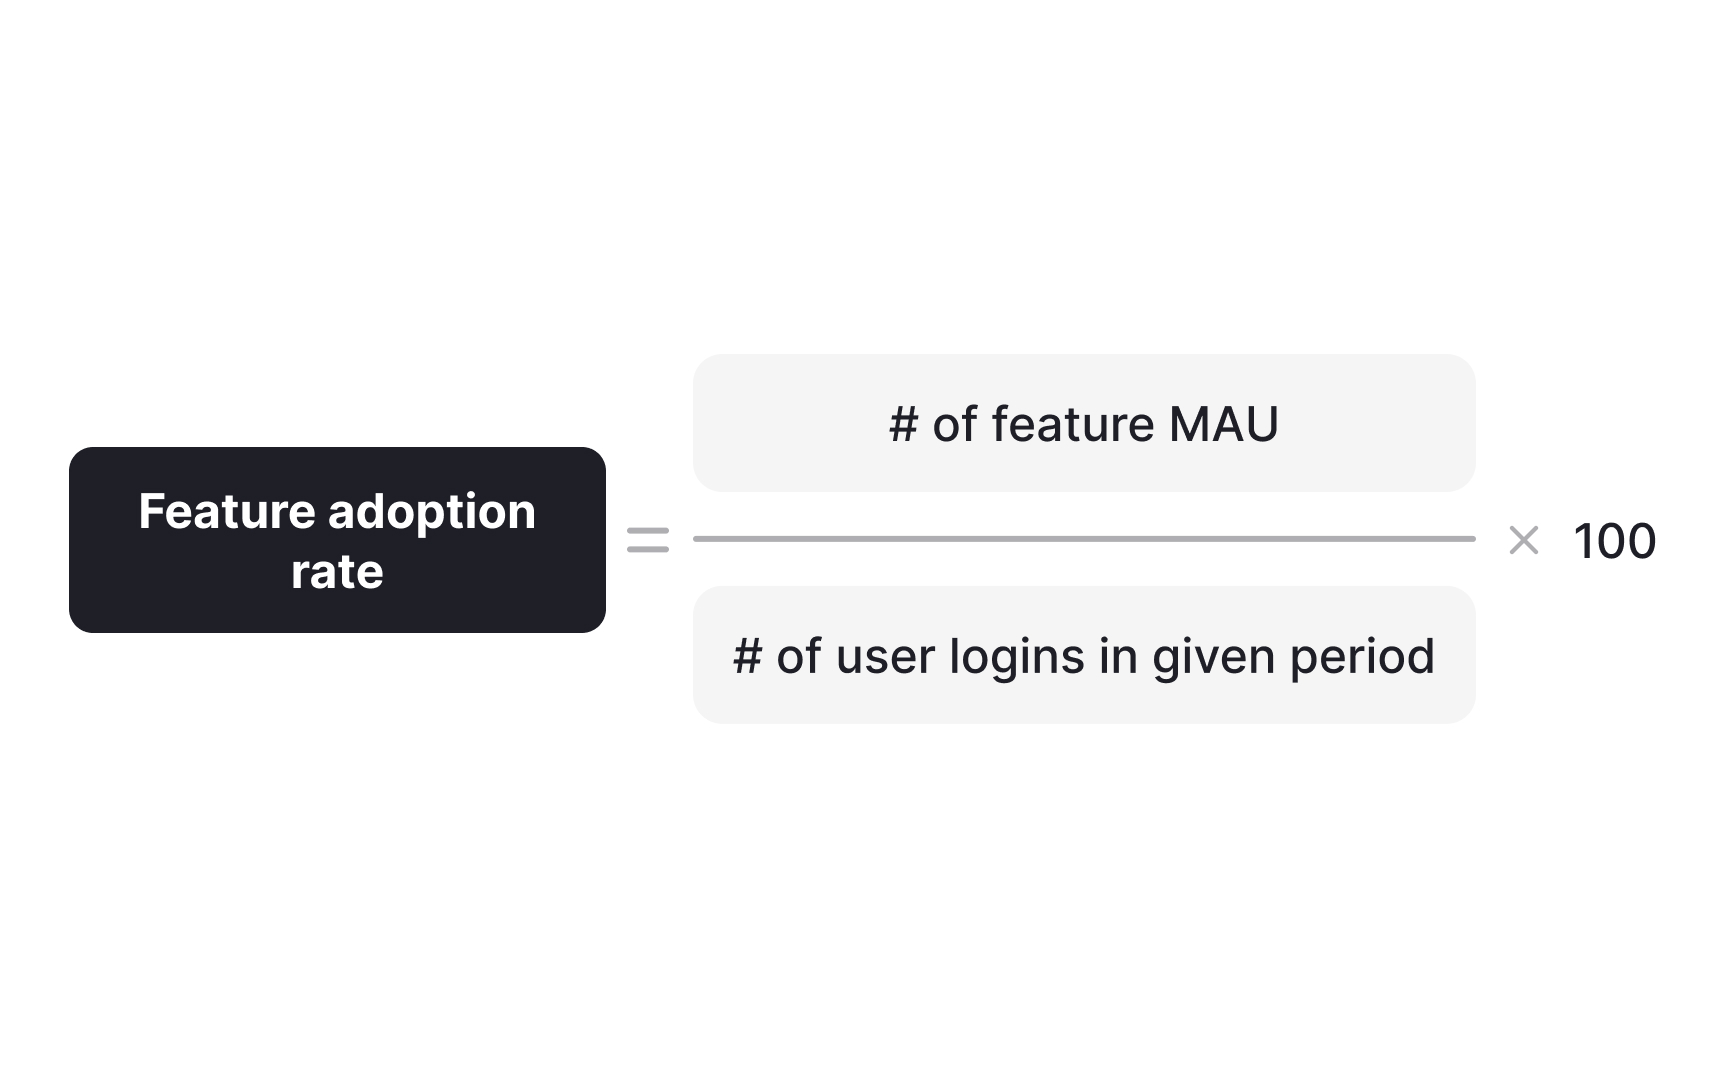
- Feature adoption rate: reveals how quickly new features are discovered and used.
- Overall adoption rate: shows whether trial users become repeat users and integrate the product into their workflow.[2]
Together, these metrics highlight whether a product sparks one-time curiosity or sustained interaction. They also guide decisions on where to improve
- Retention rate tracks the percentage of users who keep using a product over time. A high rate indicates strong satisfaction and product-market fit.
- Churn rate is the opposite, capturing the percentage who stop using the product. Even a small increase in churn can have major effects on growth.
To see the financial implications, product managers often look at customer lifetime value (LTV). LTV estimates how much
Together, these measures highlight whether growth is durable. High acquisition numbers mean little if users quickly churn, while strong retention and LTV point to a product that delivers long-term value.[3]
Pro Tip: Assess retention before chasing acquisition. Keeping users is cheaper and more telling than adding new ones.
Data-driven
Qualitative data includes:
- User interviews and surveys that reveal frustrations or motivations.
- Feedback and sentiment analysis that capture emotions behind actions.
- Session recordings or observations that show how users navigate the product in real time.[4]
For example, metrics may show a high bounce rate during
Pro Tip: When metrics and interviews tell the same story, act with confidence. When they diverge, investigate deeper before deciding.
Every product decision starts as a hypothesis: a prediction that one change will affect user behavior or a business outcome. Without validation, these remain guesses. Data-driven
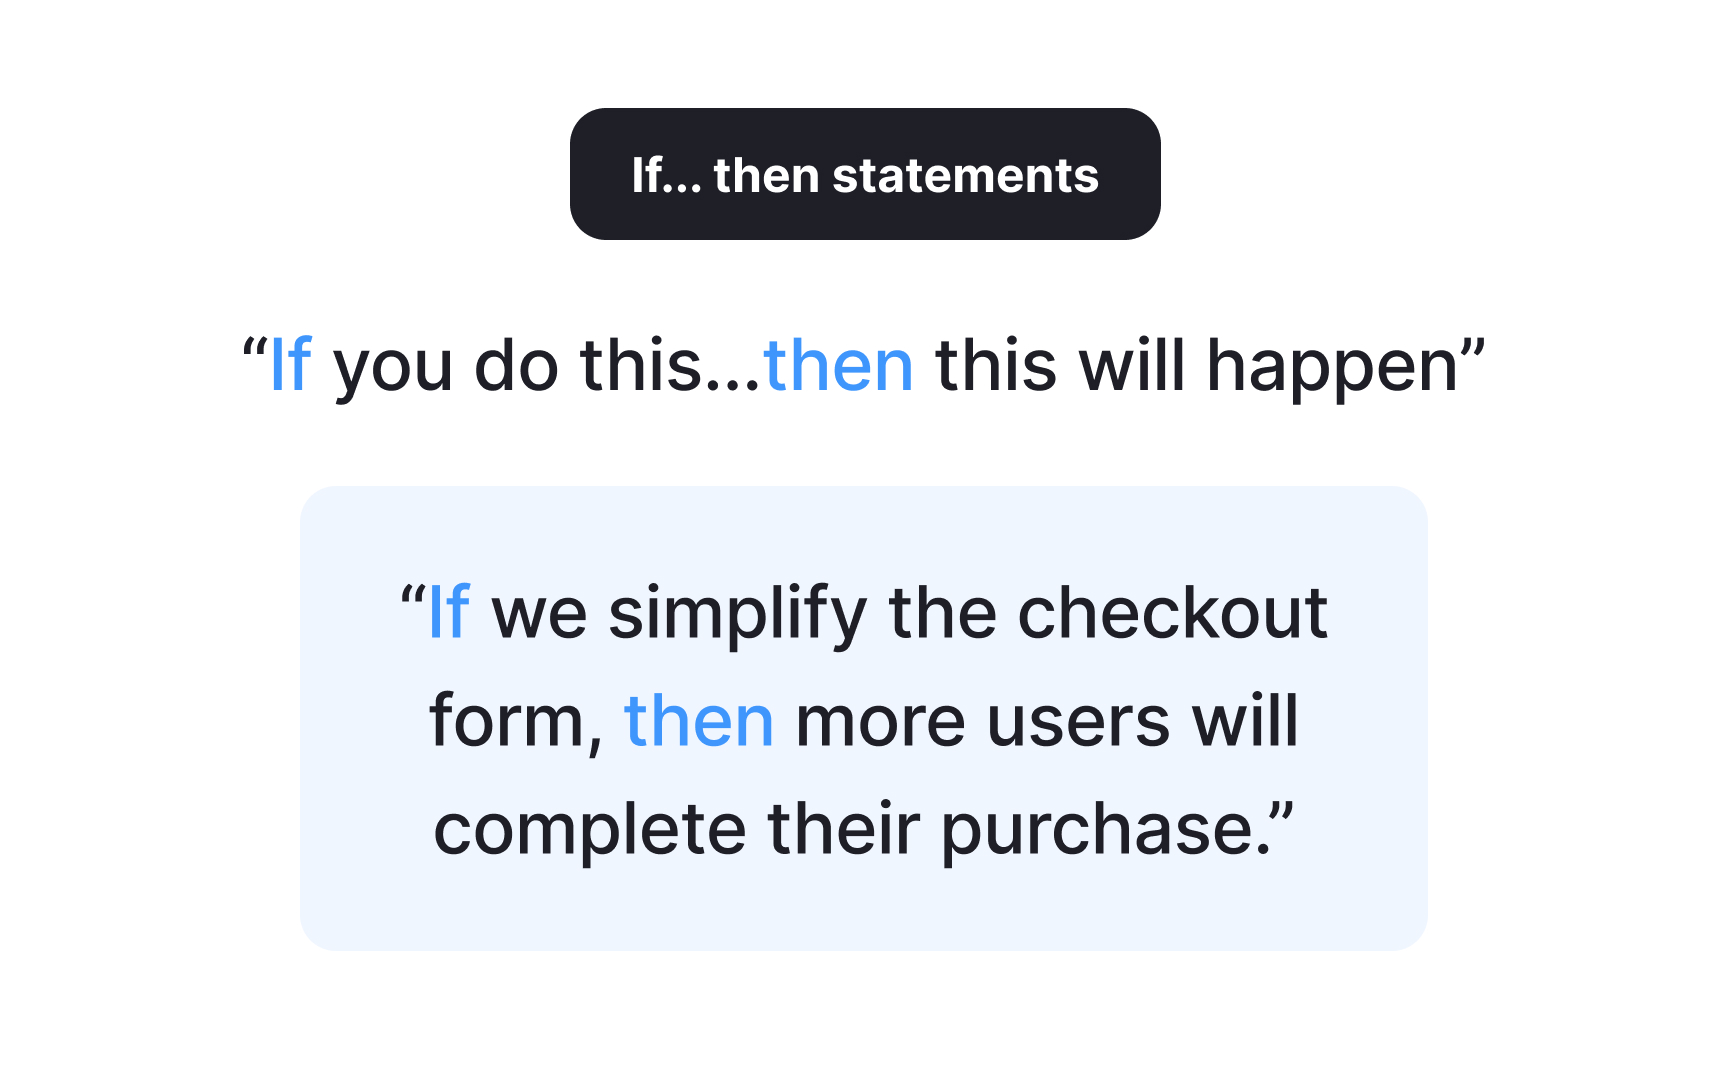
A structured hypothesis might read: If we redesign onboarding, then more users will complete account setup. Product managers can test this with an A/B experiment, comparing user completion rates before and after the change. Other frameworks, such as MoSCoW prioritization, help decide which hypotheses are worth testing based on alignment with product vision.
Validating ideas through evidence reduces risk and prevents wasted resources. It also builds confidence that roadmap priorities are not based on hunches but on data-supported learning. Over time, this cycle of building, measuring, and learning leads to steady product improvement.
Pro Tip: Frame hypotheses with clear “if…then” statements so tests generate actionable answers, not vague signals.
The abundance of product data can slow decisions instead of improving them. Faced with dozens of
Practical risks include:
- Decision paralysis: too many inputs delay action.
- Stakeholder noise: opinions drown out signals from real users.
- Misinterpretation: poor data quality or bias leads to wrong conclusions.
The best safeguard is structure. Define a North Star metric that reflects long-term product value, and let it
Pro Tip: Anchor team debates in one North Star metric, then bring in supporting metrics only when they clarify the decision.
Information overload is common in
Several practices help:
- Single source of truth: consolidate key data so teams work from consistent evidence.
- Prioritization frameworks: break down competing requests and focus on those that align with strategy.
- Lean documentation: concise memos or one-pagers clarify thinking and eliminate unnecessary detail.
- Rituals and reflections: regular check-ins and retrospectives help teams process insights instead of letting them pile up.
By structuring how information is collected, shared, and revisited, product managers replace noise with clarity. This discipline not only speeds up decisions but also keeps the focus on user value and strategic goals.
References
Topics
From Course

Share


Similar lessons

Introduction to Churn Metrics and Analysis

Common Causes of Customer Churn
