Measuring Success
What gets measured gets managed. In product management, metrics aren’t just numbers but signals that show how users actually interact with your product. Acquisition metrics track how effectively you’re growing your user base, from the first touch to conversion. Engagement metrics go further, showing which features draw attention and how often users come back. Strong retention metrics indicate users are finding lasting value and choosing to stay.
The most useful insights come when these metrics are combined into broader indicators like the Product Engagement Score, offering a well-rounded view of product performance. Smart teams define a North Star metric to keep everyone aligned on a shared goal while using supporting metrics for deeper context. With a clear metrics framework, you can identify patterns early, address issues before they grow, and explain outcomes in terms that stakeholders understand.
Metrics are there to clarify the user experience, understand satisfaction and value, and guide product decisions over time.
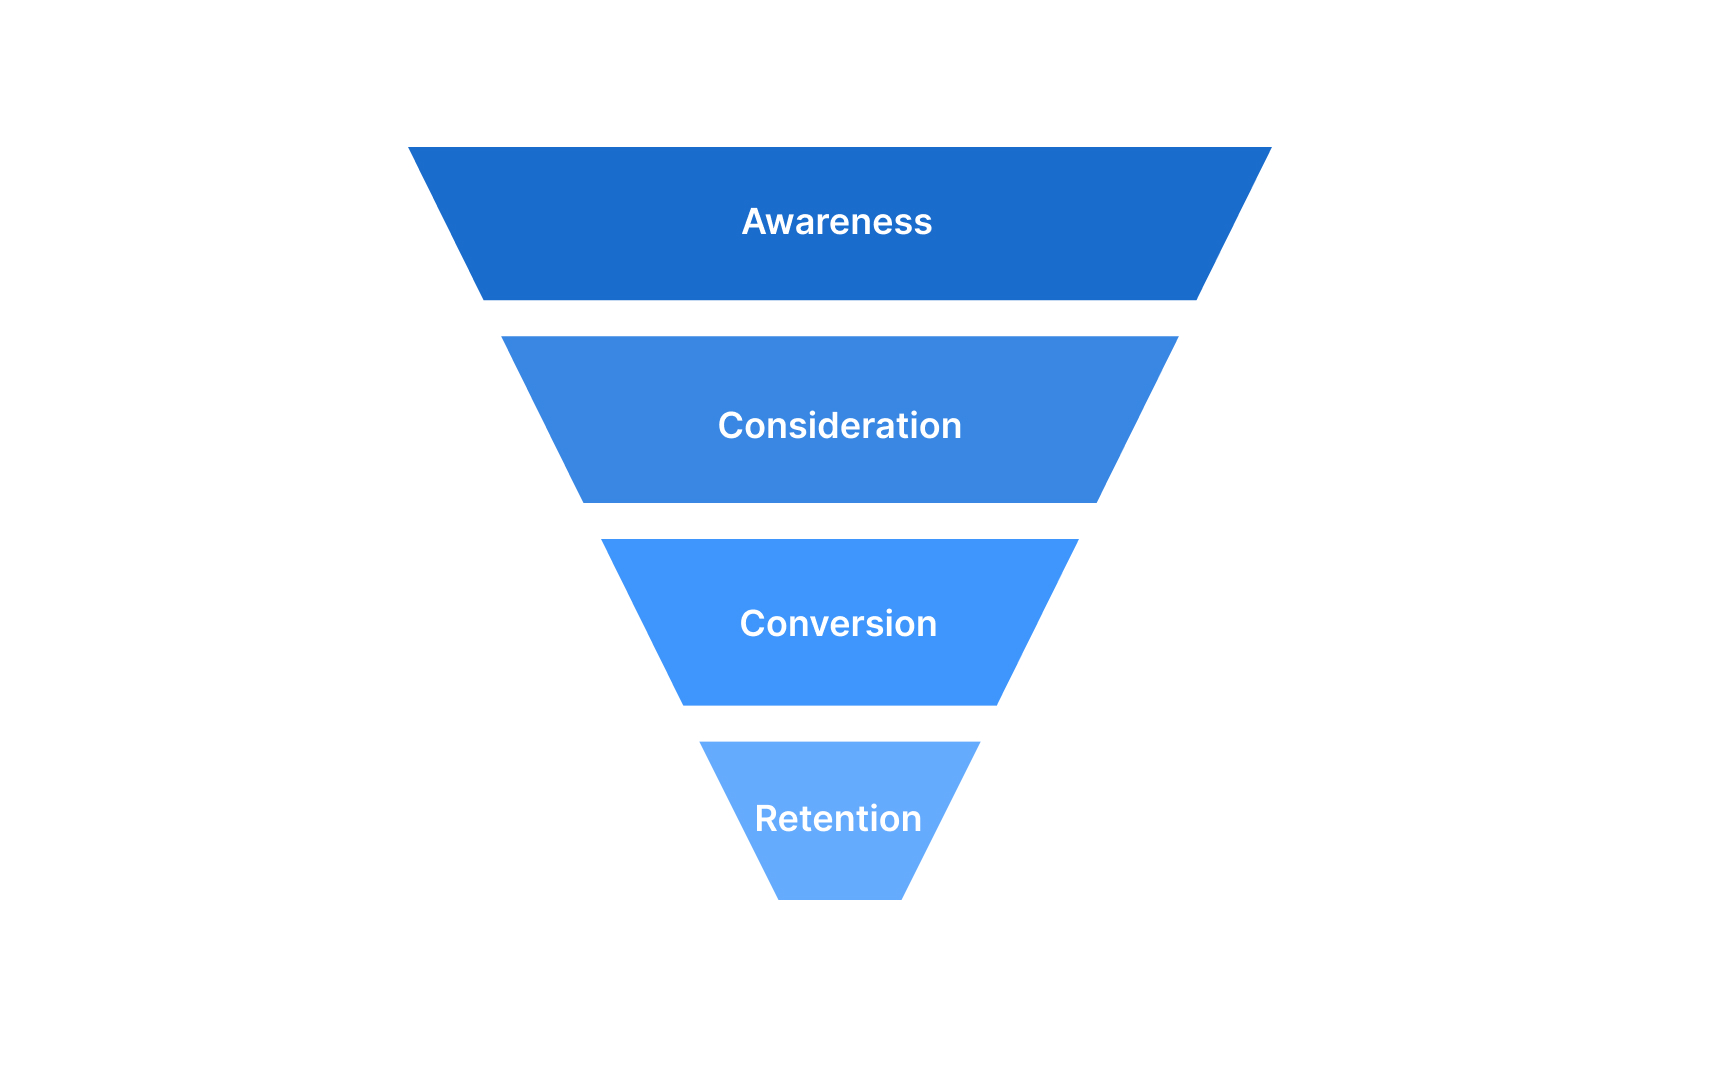
The acquisition funnel maps how users discover and adopt your product. By analyzing this journey, product managers can identify bottlenecks and optimize growth strategies.
A customer acquisition funnel outlines four key stages that users move through:
- Awareness: Users discover your product through various channels
- Consideration: Prospects research your solution and compare options
- Conversion: Users take decisive action, like signing up or purchasing
- Retention: Converting one-time users into loyal, repeat customers
Key metrics to track across the funnel:
- Cost per acquisition (CPA): Average cost to acquire a new user
- Conversion rate: Percentage completing desired actions at each stage
- Channel effectiveness: Which sources bring the most valuable users
- Time to conversion: How long it takes to move through the funnel
- Drop-off points: Where users abandon the journey
Understanding your acquisition funnel helps optimize marketing spend and identify friction points that prevent successful user adoption.[1]
Pro Tip: Focus not just on volume but quality of acquired users. Segment acquisition data by channel to identify which sources bring customers with the highest lifetime value.
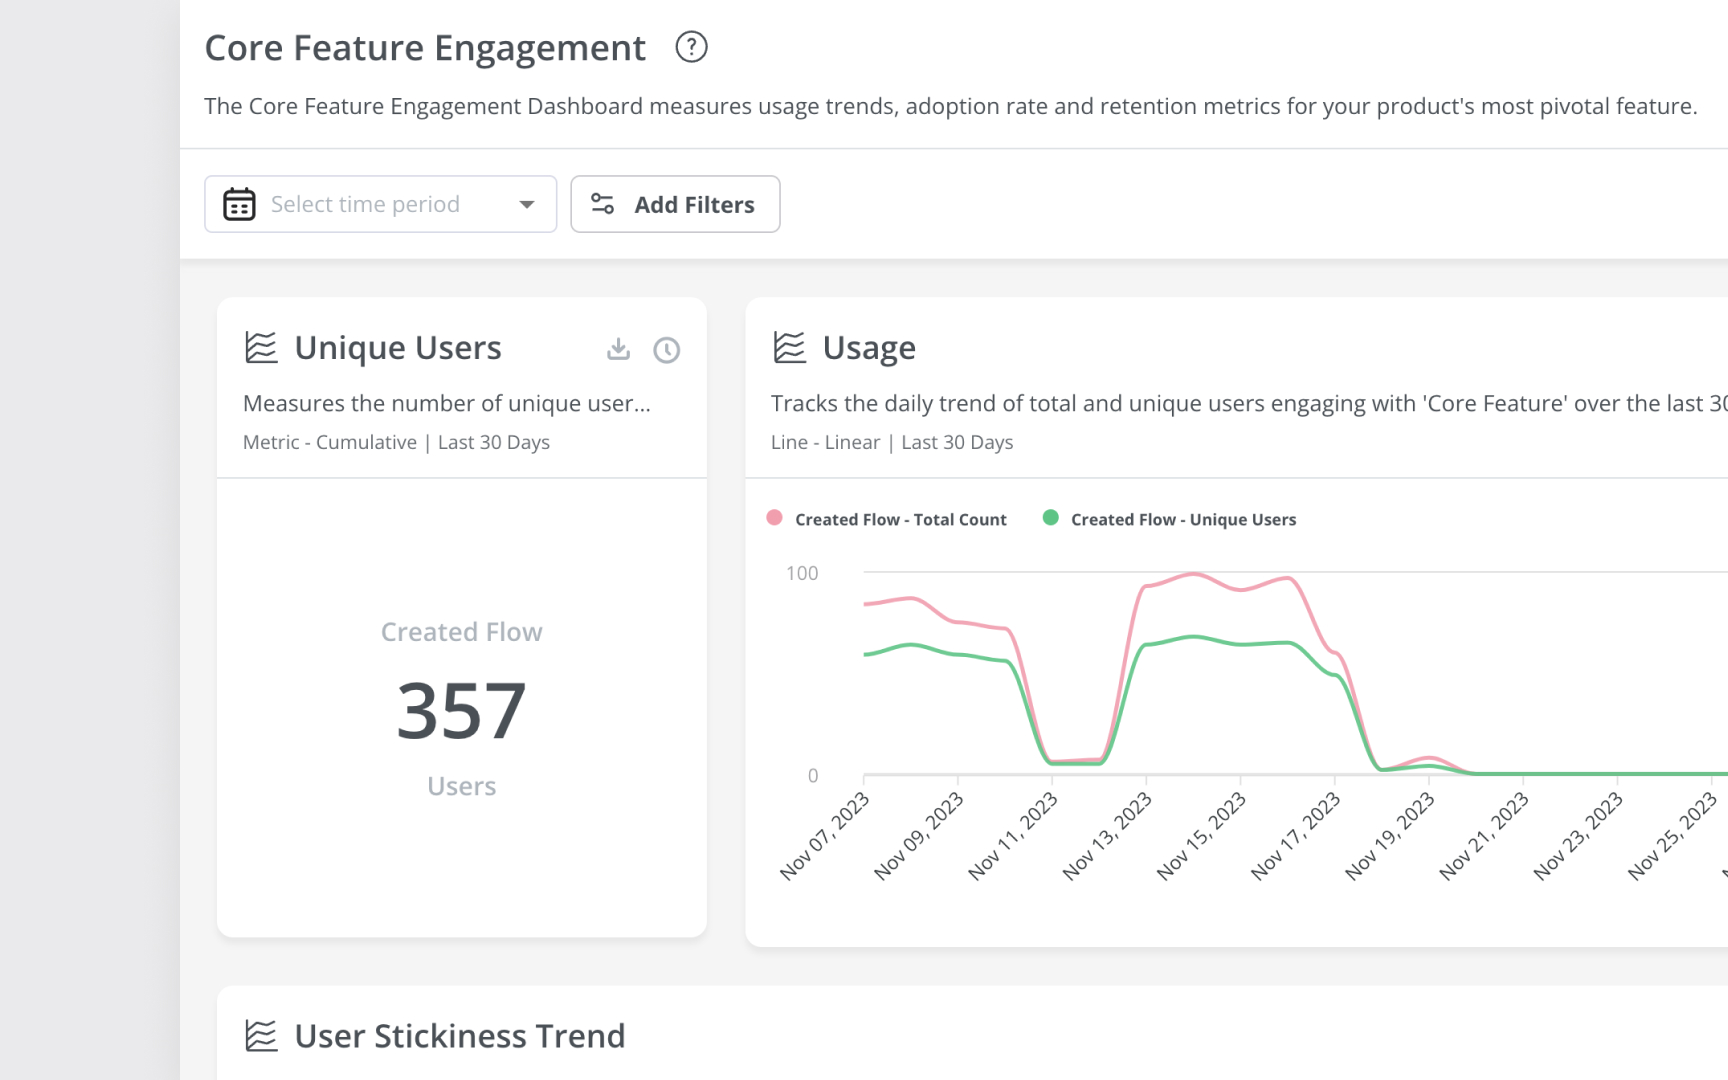
Engagement metrics reveal how users interact with your product after acquisition. These metrics help product managers understand which features provide value and how deeply users are integrating the product into their workflows.
Unlike acquisition metrics that track how users find your product, engagement metrics focus on what happens after they arrive. Strong engagement typically precedes
Key engagement metrics to monitor include:
- Product Engagement Score (PES): Combines adoption, stickiness, and growth metrics into a single score
- Active users: Daily (DAU), weekly (WAU), and monthly active users (MAU)
- Session duration: Average time users spend in your product per visit
- Feature adoption: Percentage of users engaging with specific features
- Interaction frequency: How often users return to your product
- User actions per session: Number of meaningful interactions during each visit
By tracking these metrics, you can identify which features drive engagement and which may need improvement. This data helps prioritize product development efforts and guides
Pro Tip: Monitor engagement across different user cohorts to understand how their product experience changes over time. Users who joined last month may show different engagement patterns than those who've been with you for a year.
While acquisition and engagement metrics focus on bringing users in and measuring their activity, retention metrics reveal your product's long-term viability. High retention correlates with sustainable growth and profitability, making these metrics critical for product managers to track.
Key retention metrics include:
- Retention rate: Percentage of users who remain active after a specific period
- Churn rate: Percentage of users who stop using your product in a given timeframe
- Customer lifetime value (CLV): Total revenue generated by a typical customer
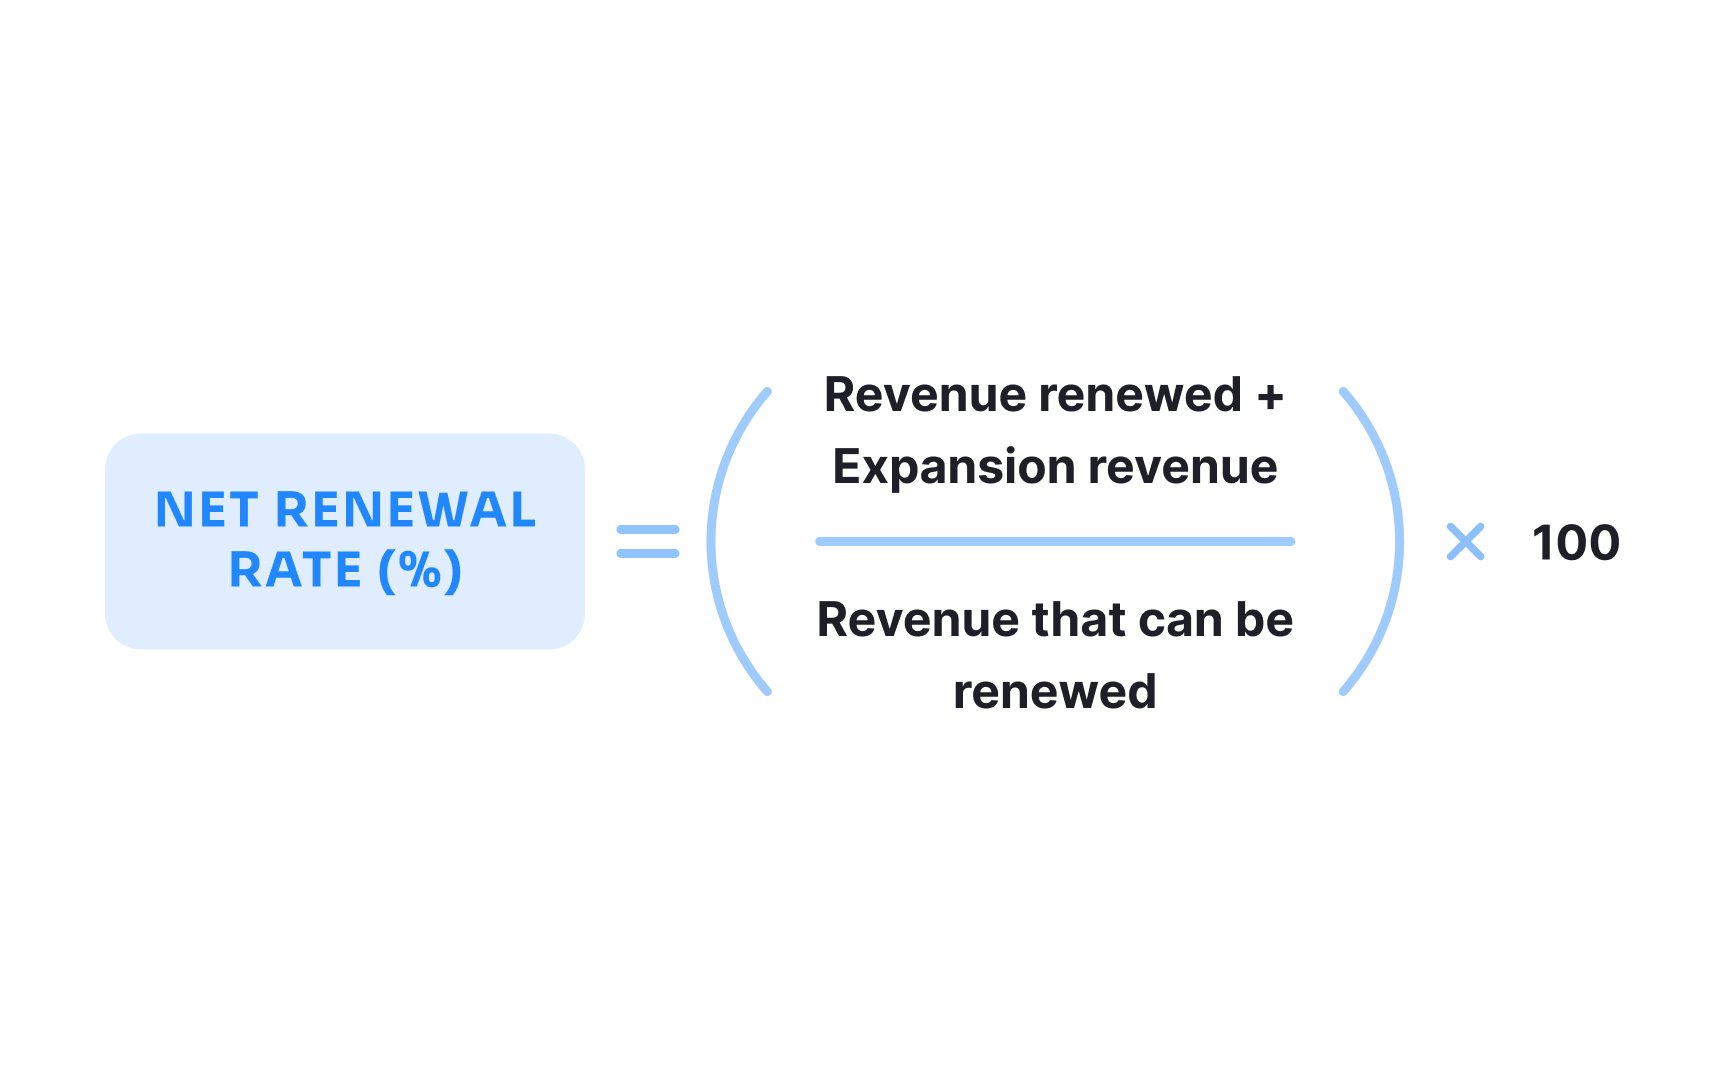
- Net revenue retention: How revenue from existing customers changes over time
- Renewal rate: Percentage of subscription customers who renew (for SaaS)
- Repeat purchase rate: How often customers make additional purchases
Retention metrics vary by industry and business model. For subscription businesses, monthly retention is standard, while e-commerce might focus on quarterly or annual repeat purchase rates.
The North Star metric is a single, specific measurement that best reflects your product's core value and aligns teams around a shared definition of success. Unlike comprehensive dashboards with numerous KPIs, a North Star metric provides clarity and focus.
Effective North Star metrics share several characteristics:
- Reflects customer value: Directly measures how well you deliver on your core value proposition
- Indicates growth potential: Correlates strongly with long-term business outcomes
- Actionable: Teams can influence it through product decisions and initiatives
- Simple: Easy to understand and communicate across the organization
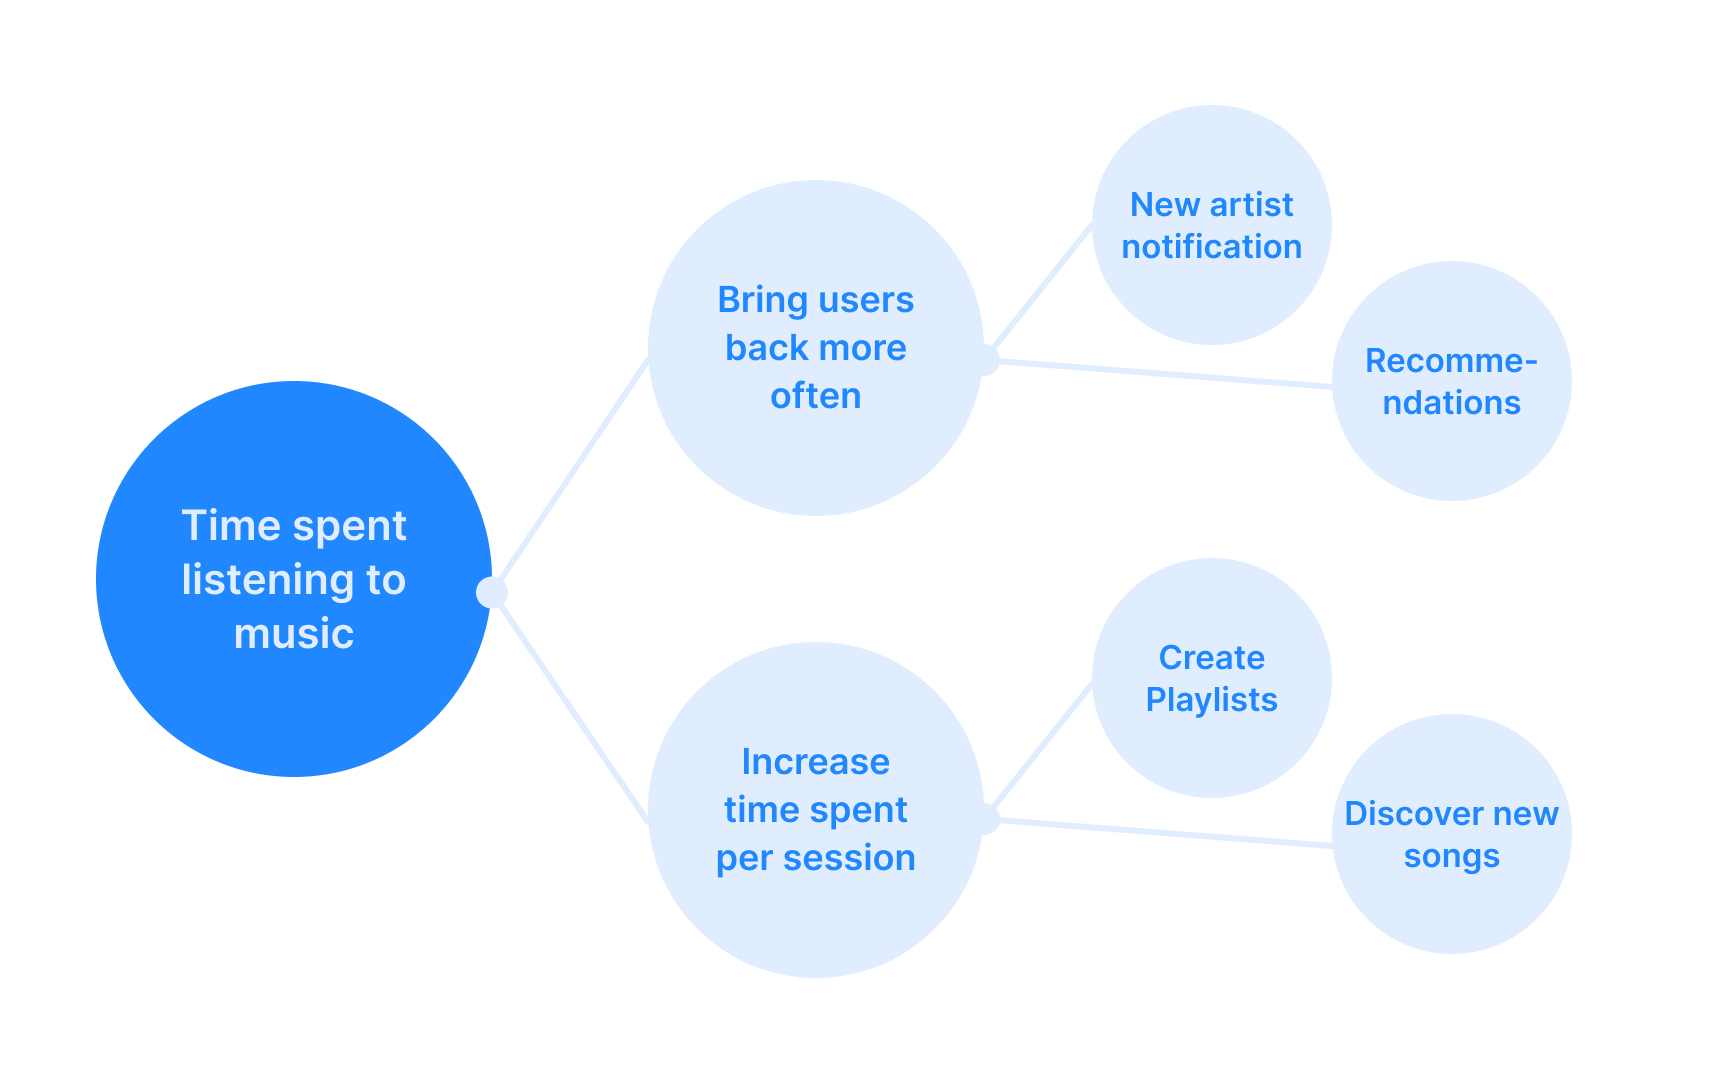
Examples of North Star metrics include Spotify's "time spent listening," Airbnb's "nights booked," and Facebook's "daily active users." The right metric varies based on your business model and value proposition.
Product managers use North Star metrics to:
- Guide product roadmap decisions
- Rally cross-functional teams around shared goals
- Evaluate feature impact more consistently
- Communicate product strategy to stakeholders[3]
Pro Tip: Your North Star metric should measure value delivered, not just activity. For example, "messages sent" might indicate activity, but "conversations that receive responses" better reflects whether users are receiving value from a messaging platform.
SaaS businesses require specific metrics to effectively measure success and growth. These specialized
For SaaS product managers, these essential KPIs fall into several categories:
- Revenue metrics: Monthly recurring revenue (MRR), annual recurring revenue (ARR), and revenue growth rate track financial performance
- Customer metrics: Customer acquisition cost (CAC), customer lifetime value (CLV), and CLV ratio measure efficiency and sustainability
- Usage metrics: Active users, feature adoption, and product stickiness reveal how customers engage with the product
- Health metrics: Net promoter score (NPS), customer satisfaction score (CSAT), and support ticket volume indicate customer experience quality
While tracking multiple metrics is necessary, effective SaaS product managers focus on identifying relationships between these KPIs rather than viewing them in isolation. For example, improving feature adoption often correlates with higher
Pro Tip: Pay special attention to the leading indicators that predict future outcomes. Changes in usage patterns and engagement often precede changes in renewal rates and revenue metrics by several months.
Collecting accurate product data requires thoughtful implementation of tracking systems. Without proper infrastructure, product teams end up making decisions based on incomplete or inaccurate information.
An effective product metrics tracking system includes several components:
- Event tracking: Capturing specific user actions like button clicks, page views, and feature usage
- User identification: Connecting actions to specific users to understand behavior patterns
- Data storage: Maintaining historical data for trend analysis and comparisons
- Visualization tools: Displaying metrics in
dashboards that highlight key insights - Analysis capabilities: Supporting segmentation, filtering, and custom reporting
When implementing tracking systems, product managers must balance comprehensive data collection with privacy considerations and technical constraints. Collecting too much data creates noise, while collecting too little leaves blind spots.
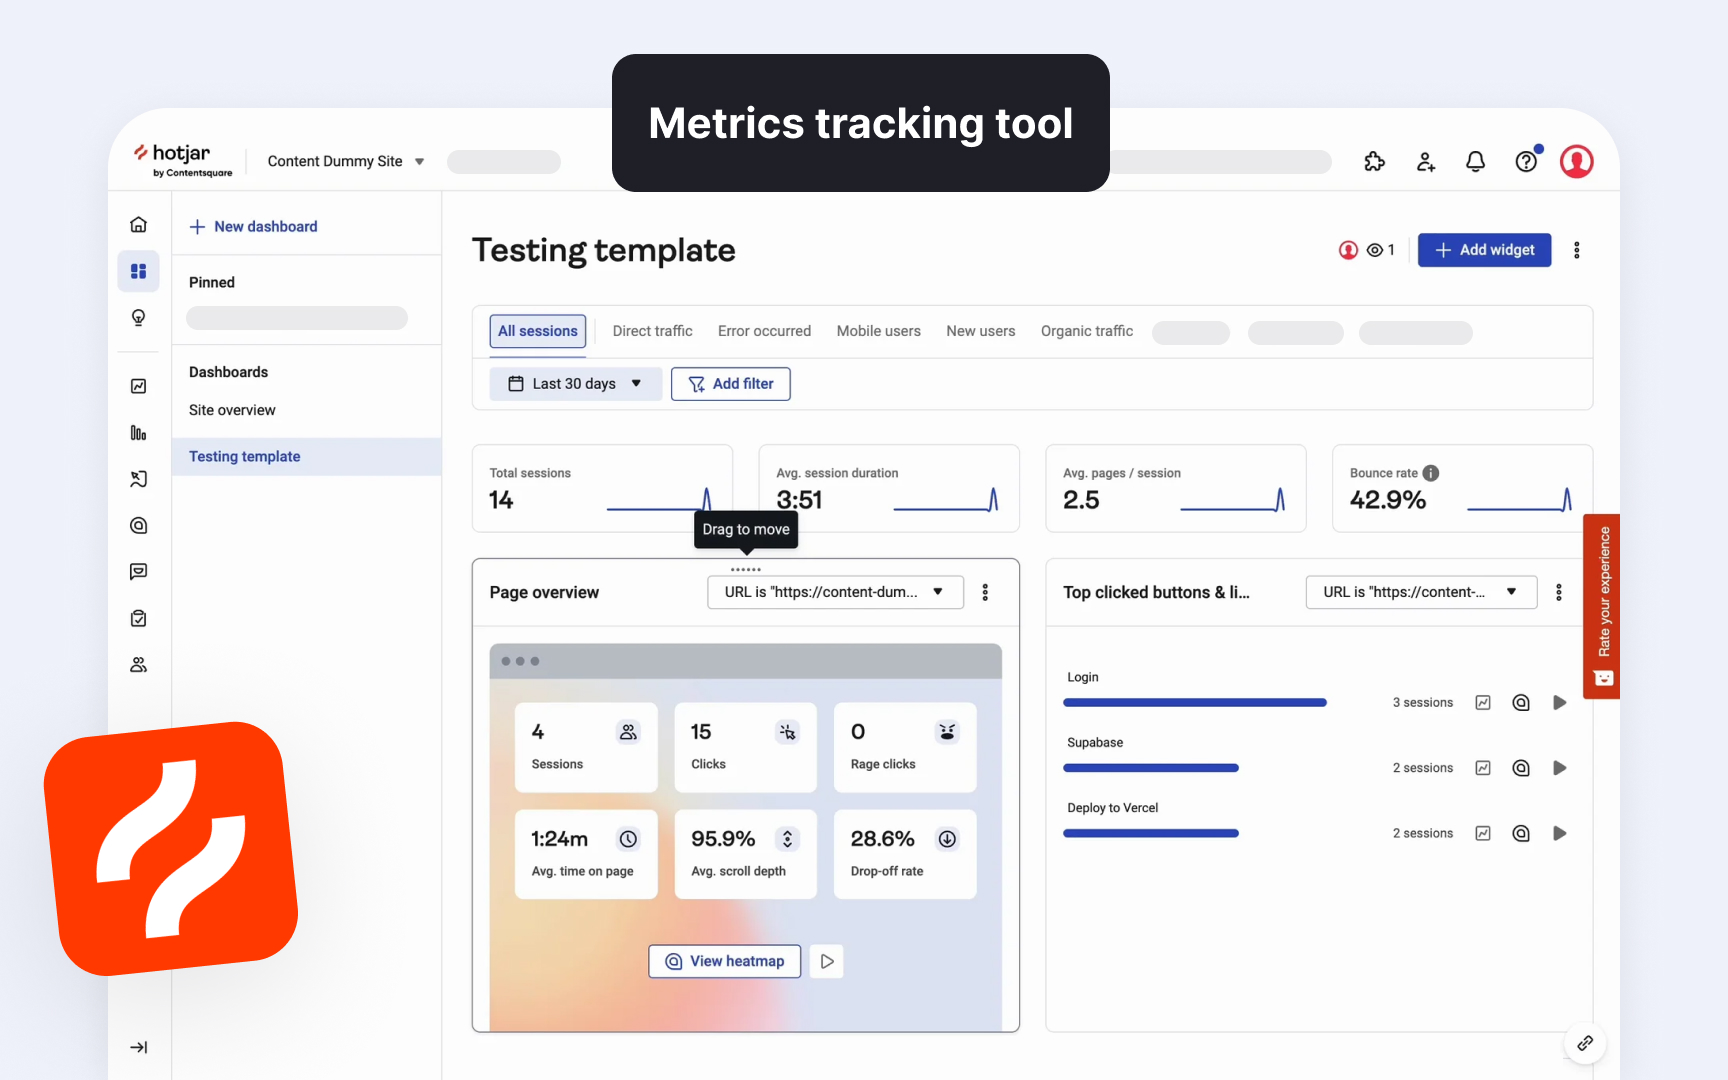
Popular tools for product metrics tracking include product analytics platforms like Amplitude and Mixpanel, user behavior tools like Hotjar, and specialized solutions for specific metrics like
Metrics only create value when they drive meaningful product improvements. Converting data insights into action requires systematic approaches to prioritization and strategy development.
Effective data-driven improvement strategies follow a structured process:
- Identify opportunities: Use metrics to pinpoint underperforming areas or growth potential
- Generate hypotheses: Develop theories about what causes performance issues
- Validate assumptions: Conduct qualitative research to understand the "why" behind the numbers
- Ideate solutions: Create multiple potential approaches to address validated problems
- Prioritize initiatives: Evaluate potential impact, effort, and risk to determine what to tackle first
- Implement and measure: Execute changes and track the resulting metric movements
When building improvement strategies, product teams must balance quick wins that show immediate results with strategic
References
- Product Engagement Metrics: How To Track & Improve Them | Thoughts about Product Adoption, User Onboarding and Good UX | Userpilot Blog
- What Product Metrics Matter? | ProductPlan
- Product Engagement Metrics: How To Track & Improve Them | Thoughts about Product Adoption, User Onboarding and Good UX | Userpilot Blog
Topics
From Course

Images provided by

Share


Similar lessons

Analytics Strategy & Planning
Data Collection & Tracking
