Data Collection & Tracking
Discover strategic data collection methods to capture meaningful product analytics insights
Product analytics relies on systematically gathering user behavior data, from clicks and page views to feature adoption rates and conversion funnels. Strategic implementation of tracking methods ensures teams capture meaningful interactions while respecting user privacy. Event tracking frameworks help categorize user actions into clear hierarchies, making data analysis more structured and actionable.
Through proper instrumentation, teams gain visibility into user journeys, pain points, and opportunities. This quantitative foundation enables product teams to validate hypotheses, identify patterns, and make informed improvements. When combined with proper data governance and privacy considerations, robust tracking systems transform raw user interactions into valuable product insights that drive growth and enhance user experiences.
User identification methods enable product teams to recognize and track individual users across their product journey. Anonymous identification assigns temporary IDs to users before authentication, commonly implemented through browser cookies or device IDs. These IDs help maintain session continuity and track basic behavioral patterns.
Authenticated identification occurs when users log in or create accounts, providing more reliable tracking through unique user IDs, email addresses, or customer numbers. This method enables cross-device tracking and detailed user journey analysis. Modern systems often combine both approaches, linking anonymous activities to authenticated profiles once users identify themselves.
Keep in mind that privacy regulations like GDPR and CCPA require clear user consent for tracking and data collection.[1]
Event tracking is like placing digital sensors throughout your product to monitor how users interact with it. Think of it as creating a list of important actions you want to track, such as when someone clicks a button, views a
The most common events to track include page views, button clicks, form submissions, and feature usage. Each event typically includes 3 basic pieces of information: the event name (what happened), the timestamp (when it happened), and the user ID (who did it). For example, when tracking a "Sign Up" button click, you'd record that specific action, when it occurred, and which user clicked it.
Starting with event tracking is simple — focus on key actions that align with your business goals. If you run an online store, you might track "View Product," "Add to Cart," and "Complete Purchase" events. This gives you a clear picture of how users move through your buying process without getting overwhelmed by too much data.
Pro Tip: Start by tracking just 3-5 key events that directly relate to your main business goals. You can always add more events later as you get comfortable with the basics.
Event parameters are extra pieces of information that make your tracked events more useful. While basic tracking tells you what happened, parameters tell you more about how and why it happened. Think of them as tags that add context to each event you track.
For a product view event, useful parameters might include the product name, price, category, and whether it's in stock. These details help you understand not just that someone viewed a product, but exactly what they were interested in. Similarly, for a search event, you might track the search term used, number of results shown, and whether any filters were applied.
When choosing parameters, focus on information that will help answer important business questions. For example, tracking the source parameter (where users came from) and device type (mobile or desktop) can help you understand which marketing channels and devices drive the most valuable
User properties are lasting characteristics that help you understand who your users are. Unlike events that track what users do, user properties tell you about the users themselves. These could be basic details like their location and language preference, or specific information like subscription status and account type.
Some user properties are automatically collected, like users’ device type or operating system. Others need to be set manually when you learn something important about users, such as when they upgrade their account or set their preferences. For example, when users changes their notification settings, you'd update their user properties to reflect this choice.
Good user attributes help segment your analytics data into meaningful groups. If you track an attribute like "subscription tier," you can later compare how free users behave differently from premium users. This helps you make better decisions about feature development and
A session represents a single visit to your product, from when users arrive until they leave. Think of it like a shopping trip — you arrive at the store, browse around, maybe make a purchase, and eventually leave. Session tracking helps you understand these "digital shopping trips" better.
Most analytics tools consider a session ended after 30 minutes of inactivity.[2] However, you can adjust this timeout period based on your product's nature. For example, streaming services might use longer sessions because users often watch videos for extended periods, while news websites might use shorter sessions since users typically read articles quickly.
Session tracking reveals important patterns about user engagement. It helps answer questions like how long users typically stay, how many
Campaign tracking helps you understand which
The most common campaign tracking parameters are:
- Source (where the link was placed)
- Medium (type of marketing channel)
- Campaign name (specific marketing initiative)
For example, a link in your monthly newsletter might track that the user came from "email" (medium) sent by "newsletter" (source) as part of the "june_promotion_2024” (campaign).
These tracking parameters make it possible to measure the success of different marketing channels. When users click a tracked link, their future actions can be connected back to the marketing campaign that brought them to your product, helping you understand which campaigns drive the most valuable user behavior.
Pro Tip: Use a consistent naming convention for your campaign parameters to make analysis easier later. For example, always use lowercase and underscores for campaign names, like “spring_sale_2024.”
Custom dimensions are additional ways to group and analyze your data beyond standard metrics. They're like creating your own categories that matter specifically to your product. For example, if you run a content website, you might create custom dimensions for content categories, article length, or author names.
When you set up custom dimensions, you're essentially adding new labels to your analytics data. These labels can be applied to users (like membership level), sessions (like logged-in status), or individual events (like article topic). This extra context helps you analyze data in ways that standard analytics categories don't cover.
A practical example would be tracking a "Reading Time" dimension with values like "Quick Read (2-5 mins)," "Medium (5-10 mins)," or "Long Form (10+ mins)" for your blog posts. This would let you analyze how article length affects metrics like completion rates, social shares, and return visits. For instance, you might discover that while long-form content gets more shares, quick reads lead to higher reader retention and more frequent return visits.
Cross-device tracking helps you understand how users interact with your product across different devices. For example, a user might browse on their phone during lunch break, continue on their work laptop, and complete a purchase on their tablet at home. Without cross-device tracking, these would look like 3 different users.
The key to cross-device tracking is having users identify themselves, usually by logging in. When a user logs in on any device, their actions can be connected to their unique user ID. This helps create a complete picture of their journey, regardless of which device they're using.
Understanding cross-device behavior helps improve
Pro Tip: Make the login process as smooth as possible on all devices to encourage users to identify themselves, improving your cross-device tracking accuracy.
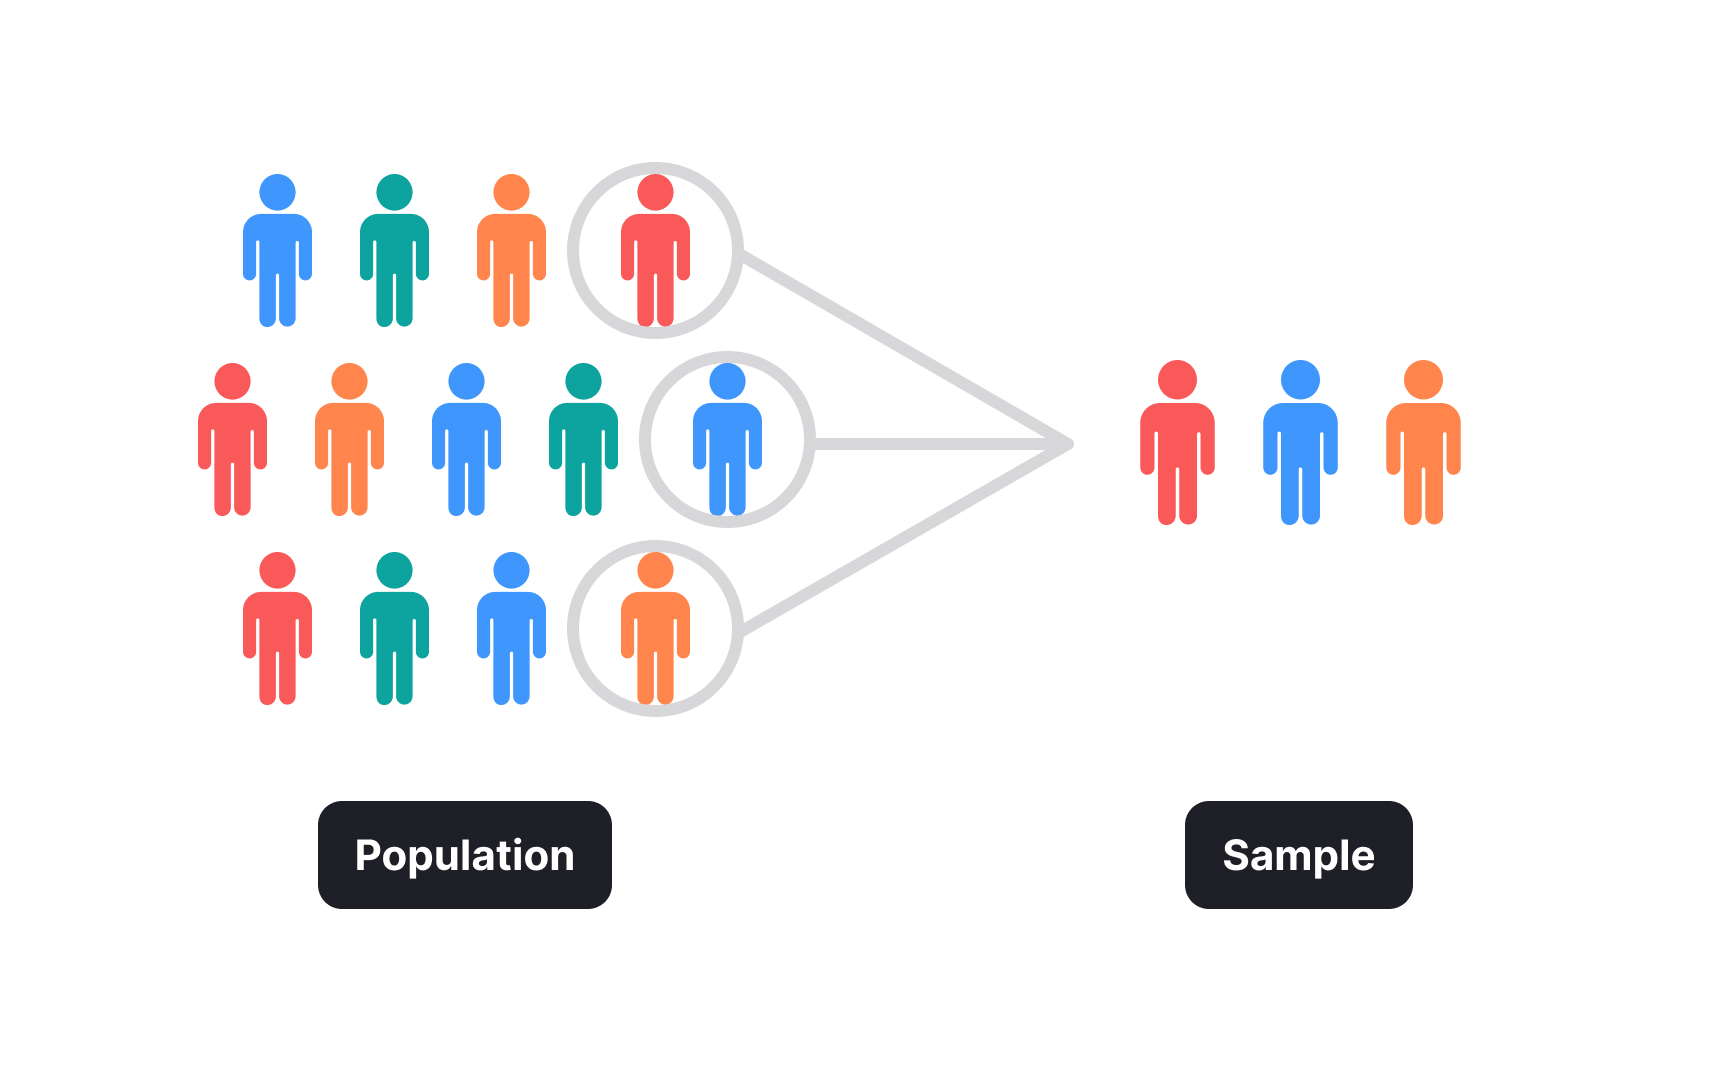
Data sampling is like taking a small taste to judge an entire meal. Instead of analyzing all your data, which can be time-consuming and expensive, sampling looks at a smaller portion to make quick, reasonable conclusions.[3] For example, instead of analyzing millions of daily users, you might look at data from every 10th user.
While sampling makes analysis faster and cheaper, it's important to know when your reports are using sampled data. Most analytics tools will tell you when they're showing sampled data and what percentage of total data they're using. For critical decisions, you might want to look at all your data instead of a sample.


Similar lessons

Analytics Strategy & Planning

Analytics Tools & Platforms
