Analytics Tools & Platforms
Explore essential product analytics platforms to extract meaningful insights from user behavior data
Product analytics tools serve as the backbone of data-driven decision-making, transforming raw user interactions into actionable insights. Modern platforms like Mixpanel, Amplitude, and Google Analytics provide sophisticated capabilities for tracking user behavior, measuring engagement, and identifying growth opportunities. These tools excel at cohort analysis, funnel visualization, and real-time monitoring, enabling product teams to validate hypotheses and optimize user experiences with precision.
Through customizable dashboards and automated reporting, analytics platforms streamline the process of discovering user patterns, measuring feature adoption, and quantifying business impact. By leveraging advanced segmentation and attribution modeling, product teams can understand user journeys, identify drop-off points, and measure the effectiveness of product improvements. The integration capabilities of these platforms with other tools in the product stack ensure seamless data flow and create a comprehensive view of product performance, making them indispensable for teams striving to build successful digital products.
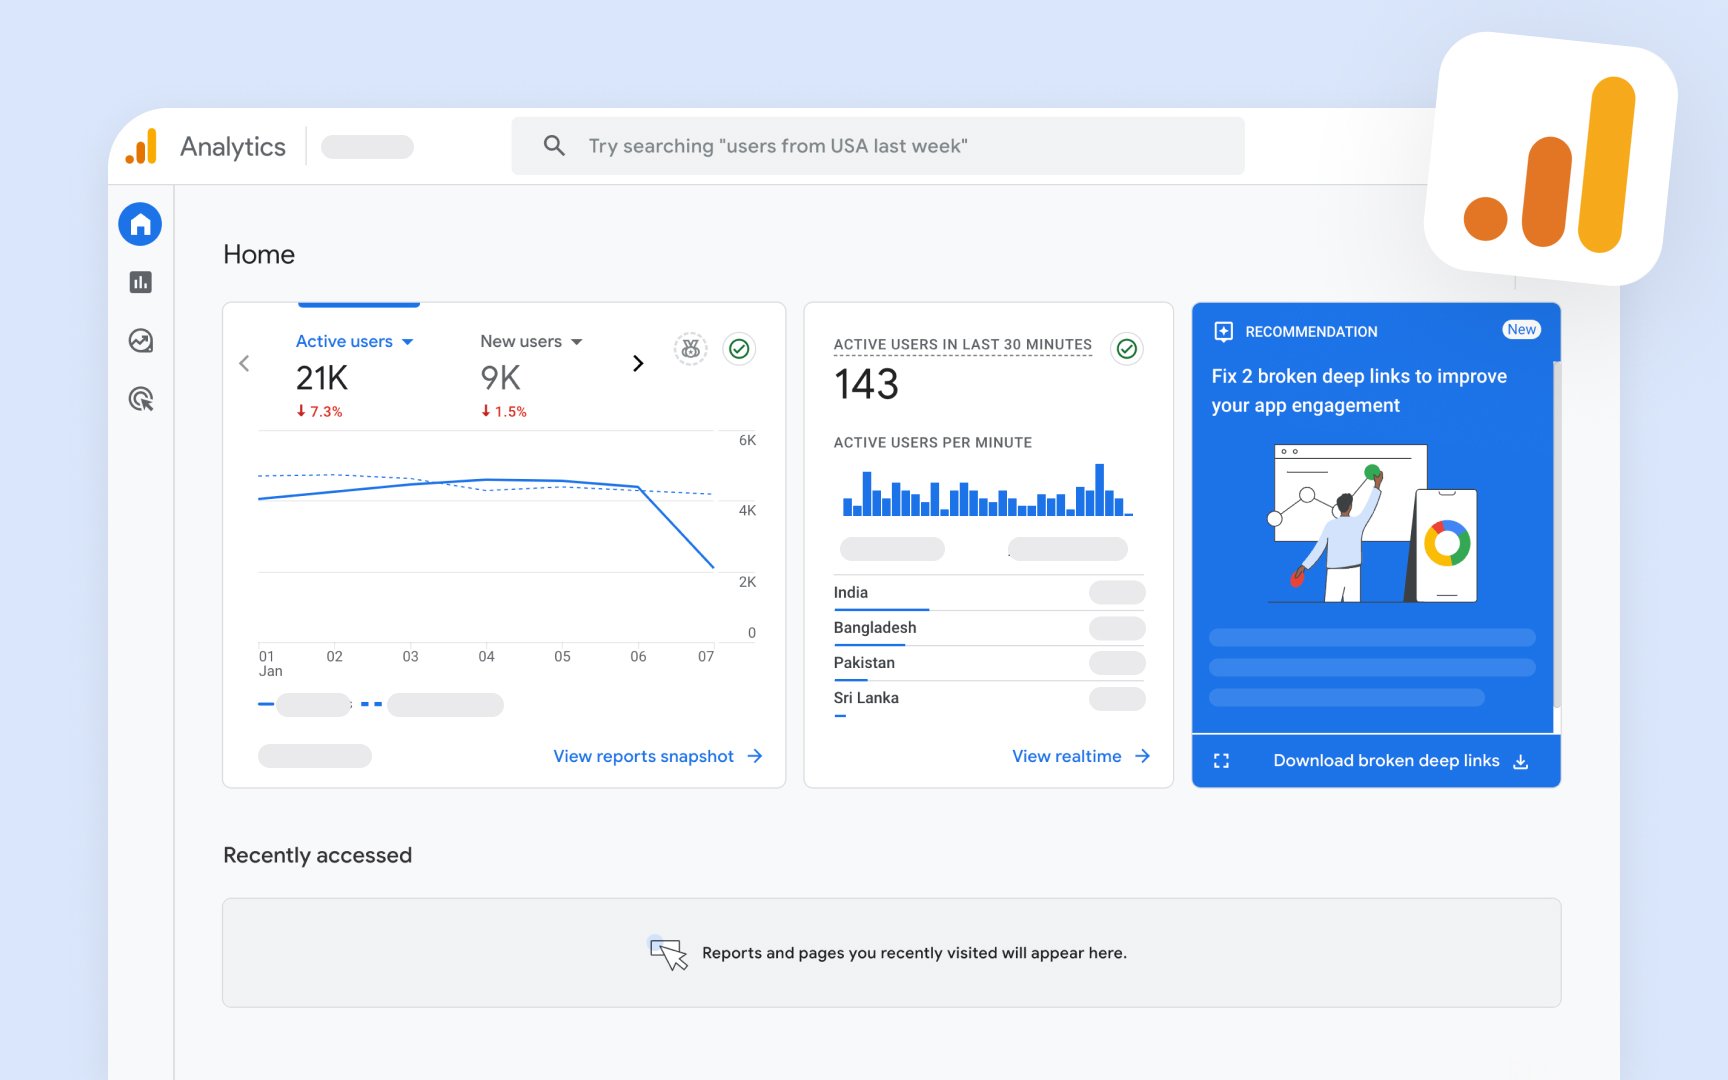
Google Analytics stands as the most widely used web analytics service, providing comprehensive insights into website traffic and user behavior. The platform tracks key metrics like page views, session duration, bounce rates, and user demographics through a JavaScript tracking code embedded in web pages.
The tool's reporting interface organizes data into 4 main categories:
- Acquisition, which shows how users find the website
- Behavior, revealing what actions users take
- Audience, detailing who the users are
- Conversions, tracking goal completions[1]
Real-time reporting capabilities allow immediate visibility into current user activity. Advanced features include custom event tracking, enhanced e-commerce reporting, and cross-device user tracking through Google Signals. Integration with Google's marketing platforms enables audience targeting for marketing campaigns.
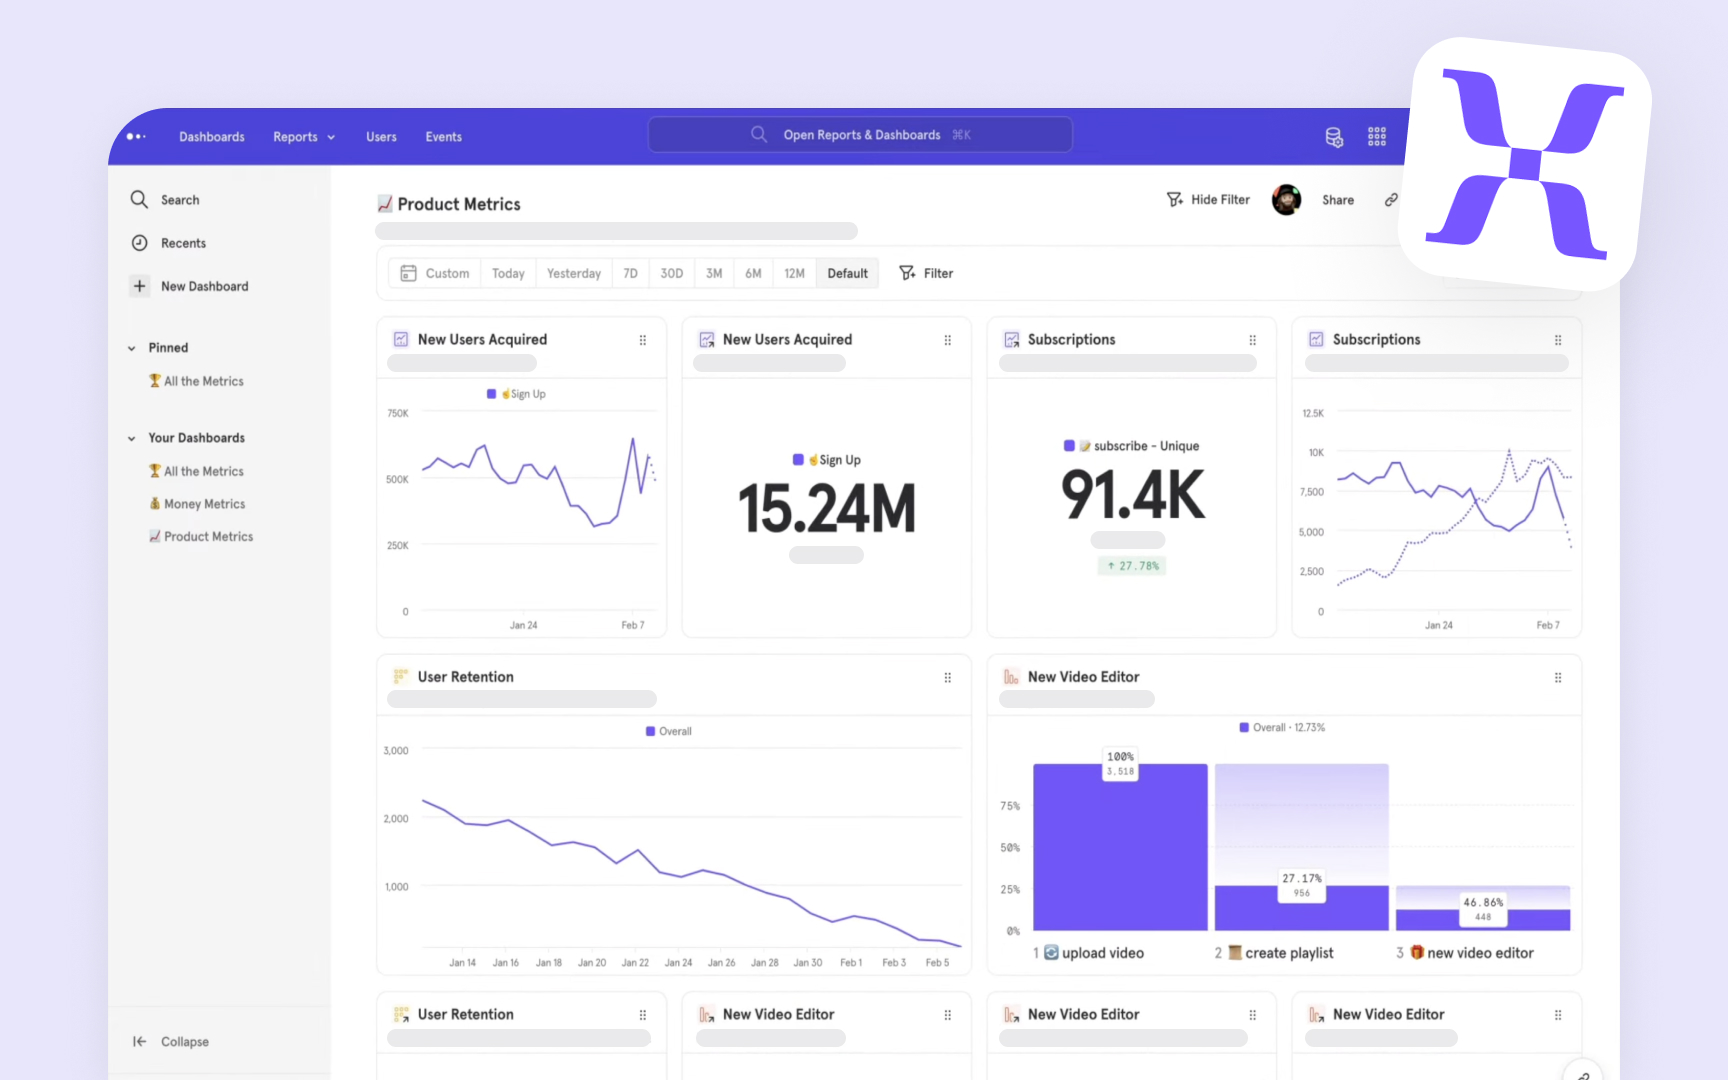
Mixpanel differentiates itself through powerful event-based analytics that capture detailed user
The core functionality revolves around cohort analysis, allowing teams to group users based on shared behaviors or characteristics and track their engagement over time. Custom retention reports reveal how different user segments continue to engage with specific features, providing insights into product stickiness and user satisfaction.
Advanced features include predictive analytics that forecast user behavior based on historical patterns, and automatic insights that surface significant trends or anomalies in the data.[2]
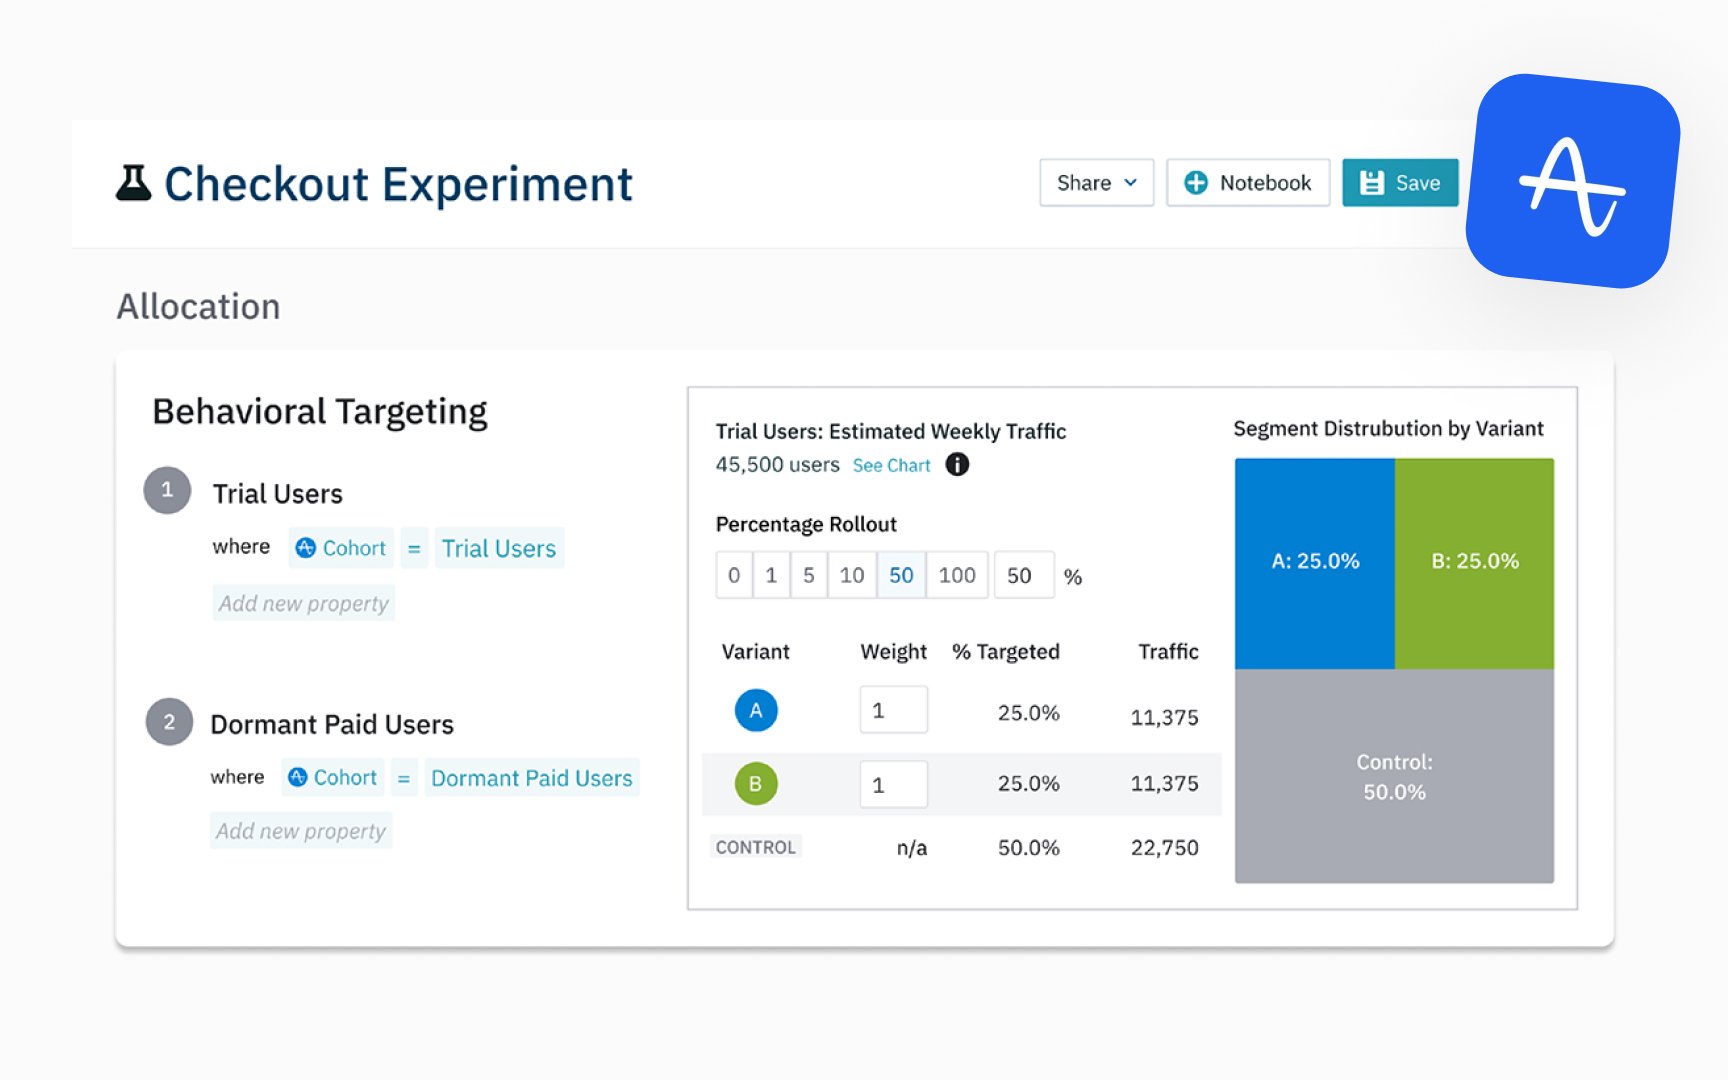
Amplitude focuses on product analytics that help teams understand user behavior patterns and drive business growth. The platform's Behavioral Graph technology processes billions of user actions to identify patterns and relationships between different events and user segments. For instance, an e-commerce app might discover that users who first browse product reviews before making a purchase tend to have a 40% higher lifetime value, leading teams to highlight review sections more prominently in the shopping experience.
Identity resolution capabilities enable tracking users across multiple devices and platforms, providing a unified view of the customer journey. The platform's Compass feature automatically surfaces behavioral correlations, helping teams discover which actions lead to desired outcomes like
Experimentation features allow teams to run A/B tests and measure their impact on key metrics, while collaborative notebooks enable sharing insights across organizations. The platform's machine learning capabilities help predict future user behaviors and identify opportunities for personalization.
Segment acts as a central hub that collects user data from your product and sends it to all your analytics and
Think of Segment like a universal translator for user data. When someone uses your product, Segment ensures that all your tools recognize them as the same user. For example, if a user signs up on your website and later makes a purchase in your mobile app, Segment helps connect these actions to the same customer profile across all your tools.
The platform also helps maintain clean, reliable data by standardizing how events are tracked. If your team decides to change how you track certain
A tracking code is a small piece of code that collects data about how people use your website — like which
Google Tag Manager works like a container that holds all your tracking codes in one place. Instead of asking developers to add different codes for tools like Google Analytics, Facebook Pixel, or other tracking tools, you only need them to add the tag manager code once. Once installed, non-technical team members can add or update tracking through a simple
Analytics APIs allow teams to access their analytics data outside of standard
Think of an Analytics API like a direct pipeline to your data. Instead of manually downloading reports, you can automatically fetch specific metrics — like daily active users or conversion rates. This makes it possible to create custom reports, build your own dashboards in your own applications, or combine analytics data with other business data. The flexibility of APIs enables teams to automate reporting workflows and create real-time data visualizations.
Most analytics platforms provide robust API documentation and client libraries for popular programming languages.
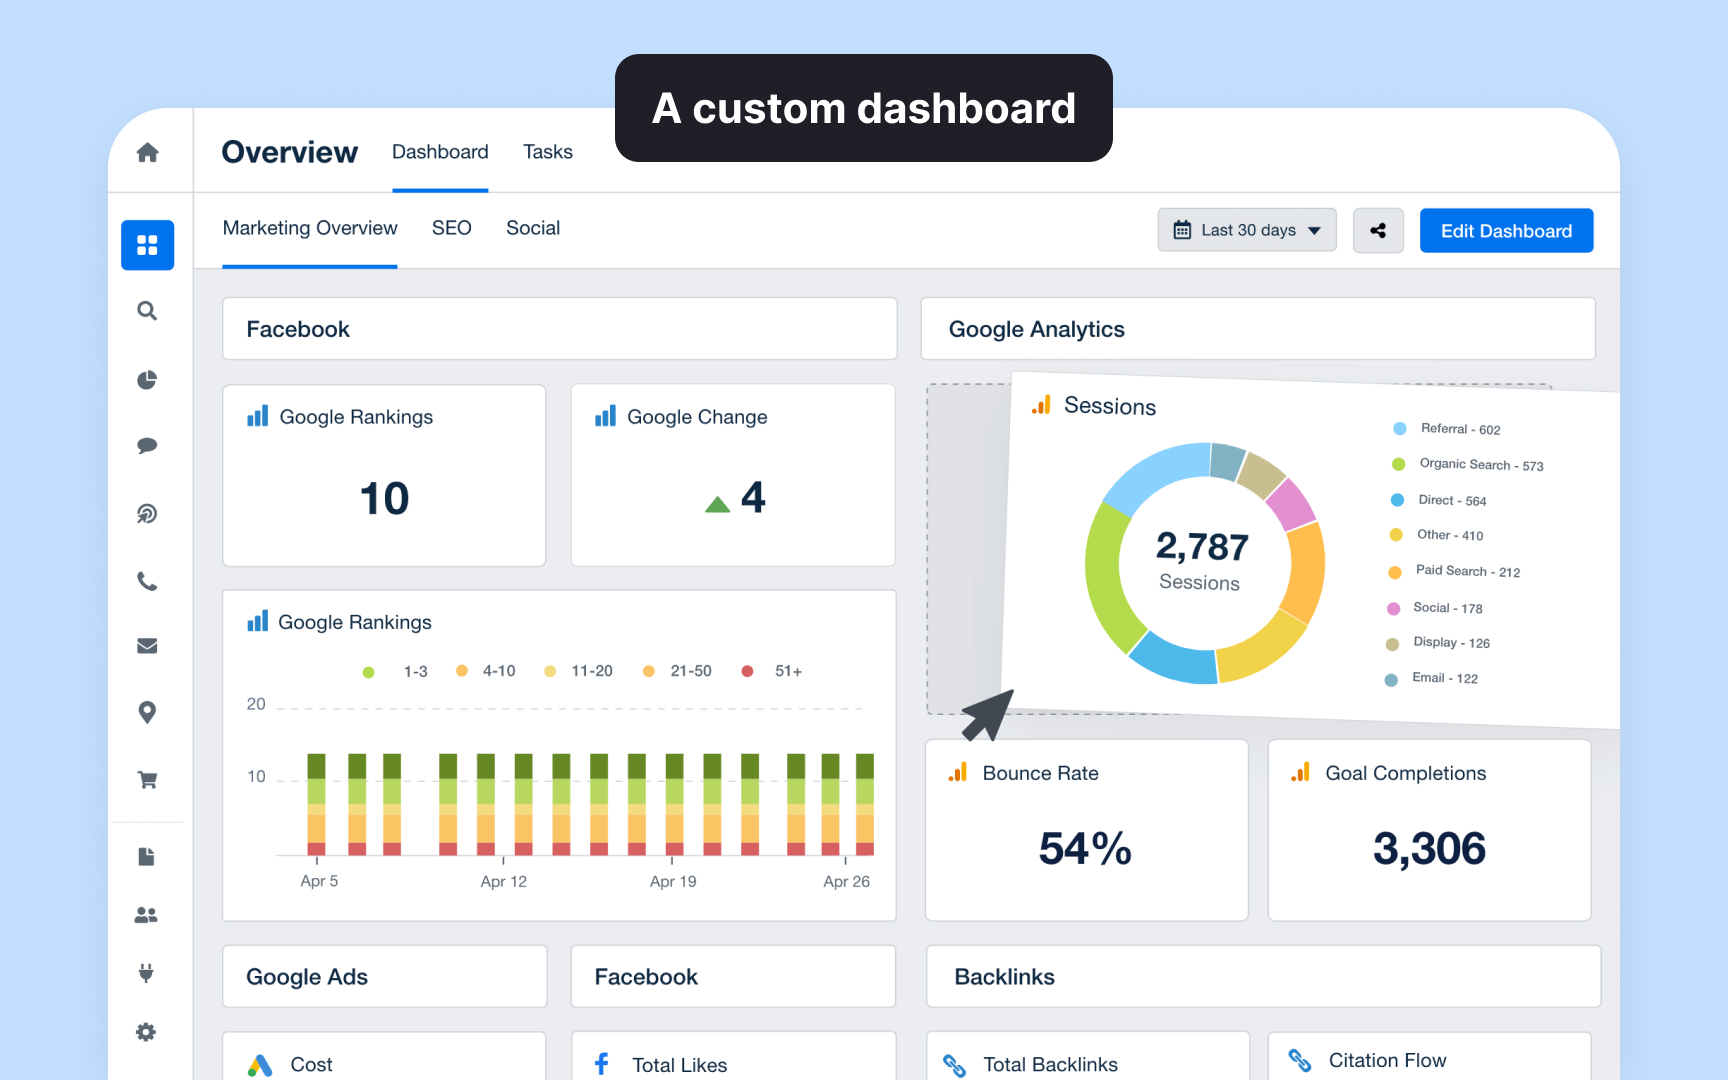
Custom dashboards transform raw analytics data into visual displays that highlight specific business metrics and KPIs. For example, a product team might combine user acquisition data, feature usage, and customer feedback scores into a single "Product Health"
The key to effective dashboard design lies in thoughtful metric selection and visual organization. A user engagement dashboard might show daily active users in a trend line, feature adoption rates in a heat map, and session duration in a distribution chart. Each visualization type is chosen based on how effectively it communicates the specific metric.
Most analytics platforms offer dashboard customization through drag-and-drop interfaces.
A data warehouse works like a giant digital library that stores all of your company's data in one place. While regular
Modern cloud data warehouses like Snowflake, BigQuery, or Redshift can handle massive amounts of information and analyze it quickly. Imagine a clothing store that saves every purchase, every website visit, and every customer
The real power comes from connecting different types of data together. A company might discover that customers who contact support in their first week are more likely to become loyal buyers if they receive quick help. This insight helps teams make better decisions about where to focus their efforts.
Real-time analytics transforms how teams monitor and respond to user activity by showing what's happening on their platform right now, not hours or days later. When a user makes a purchase, clicks a
This immediate visibility proves crucial during critical business moments. E-commerce teams can monitor
The power of real-time analytics lies in its ability to surface problems before they escalate. For example, development teams can catch bugs during deployments by watching error rates, while
References
- What is Google Analytics and how does it work? | Definition from TechTarget | Search Business Analytics
- Mixpanel Analytics In-Depth Review: Is There a Better Alternative? | Thoughts about Product Adoption, User Onboarding and Good UX | Userpilot Blog
Topics
From Course

Share


Similar lessons

Analytics Strategy & Planning
Data Collection & Tracking
