Principles of Social Impact and Equity
Transform government services through equity-driven design principles
Society's challenges become visible when government services work better for some people than others. This reality calls for a new approach to designing these services, where equity and social impact guide every decision. These principles help us understand who faces barriers when using public services and why those barriers exist. By measuring outcomes, studying community needs, and applying ethical frameworks, we can spot patterns that show us where services fall short.
This knowledge connects past inequalities to present-day solutions, helping designers create services that treat everyone fairly. When we combine data analysis with cultural understanding, we can build government services that earn public trust and ensure everyone has equal access to opportunities. These principles transform abstract ideas about fairness into practical tools for creating positive change in how government serves its people.
Systemic barriers shape who can easily use government services and who faces challenges. These barriers emerge from how services are designed, delivered, and maintained over time. Understanding them helps create more equitable access for all community members.
Looking at barriers systematically means examining how different parts of a service work together. This includes studying:
- Access points: How people find and reach services
- Service steps: Required actions, paperwork, and processes
- Information design: How services communicate
- Resource Needs: Required devices, internet access, documents, or skills
The U.S. Web Design System emphasizes combining service performance data with direct community feedback. This approach reveals patterns of exclusion and opportunities for meaningful improvements. When we map these patterns against real experiences, we can create services that work better for everyone, especially those historically underserved by government systems.[1]
Pro Tip: Check your service design against real community experiences. What works smoothly for one group might create barriers for another.
Demographic data reveals how different population groups access and use government services. Understanding service usage patterns across age groups, locations, languages, and digital access levels helps identify where barriers exist.
Key demographic patterns include:
- Population groups: How different age groups engage with services and their preferences for digital, phone, or in-person support
- Geographic location: Service usage variations between urban, suburban, and remote areas
- Language access: Service adoption rates in multilingual communities
- Digital resources: Impact of technology access and internet connectivity on service use
Quality demographic analysis looks at patterns across multiple service channels and community groups. Understanding these patterns helps identify which communities might face extra challenges when trying to use government services.
Pro Tip: Map service usage data against local demographic profiles to spot communities that might be unintentionally excluded.
Impact measurement evaluates how government services create real change. For example, when measuring the impact of an online permit application system, teams track both efficiency metrics (processing time, completion rates) and community benefits (money saved, increased business registrations).
Key measurement methods include:
- Baseline data: Current service performance before any changes, such as average wait times or error rates.
- Success metrics: Specific improvements to track, like shorter processing times or higher completion rates.
- Community impact: Direct benefits to users, including cost savings, time saved, or better access.
- Long-term outcomes: Broader effects over time, such as increased business activity or better compliance.
Effective measurement combines hard numbers with community feedback. If a new digital service cuts permit processing time from weeks to days, teams also need to know if all community groups can successfully use it.
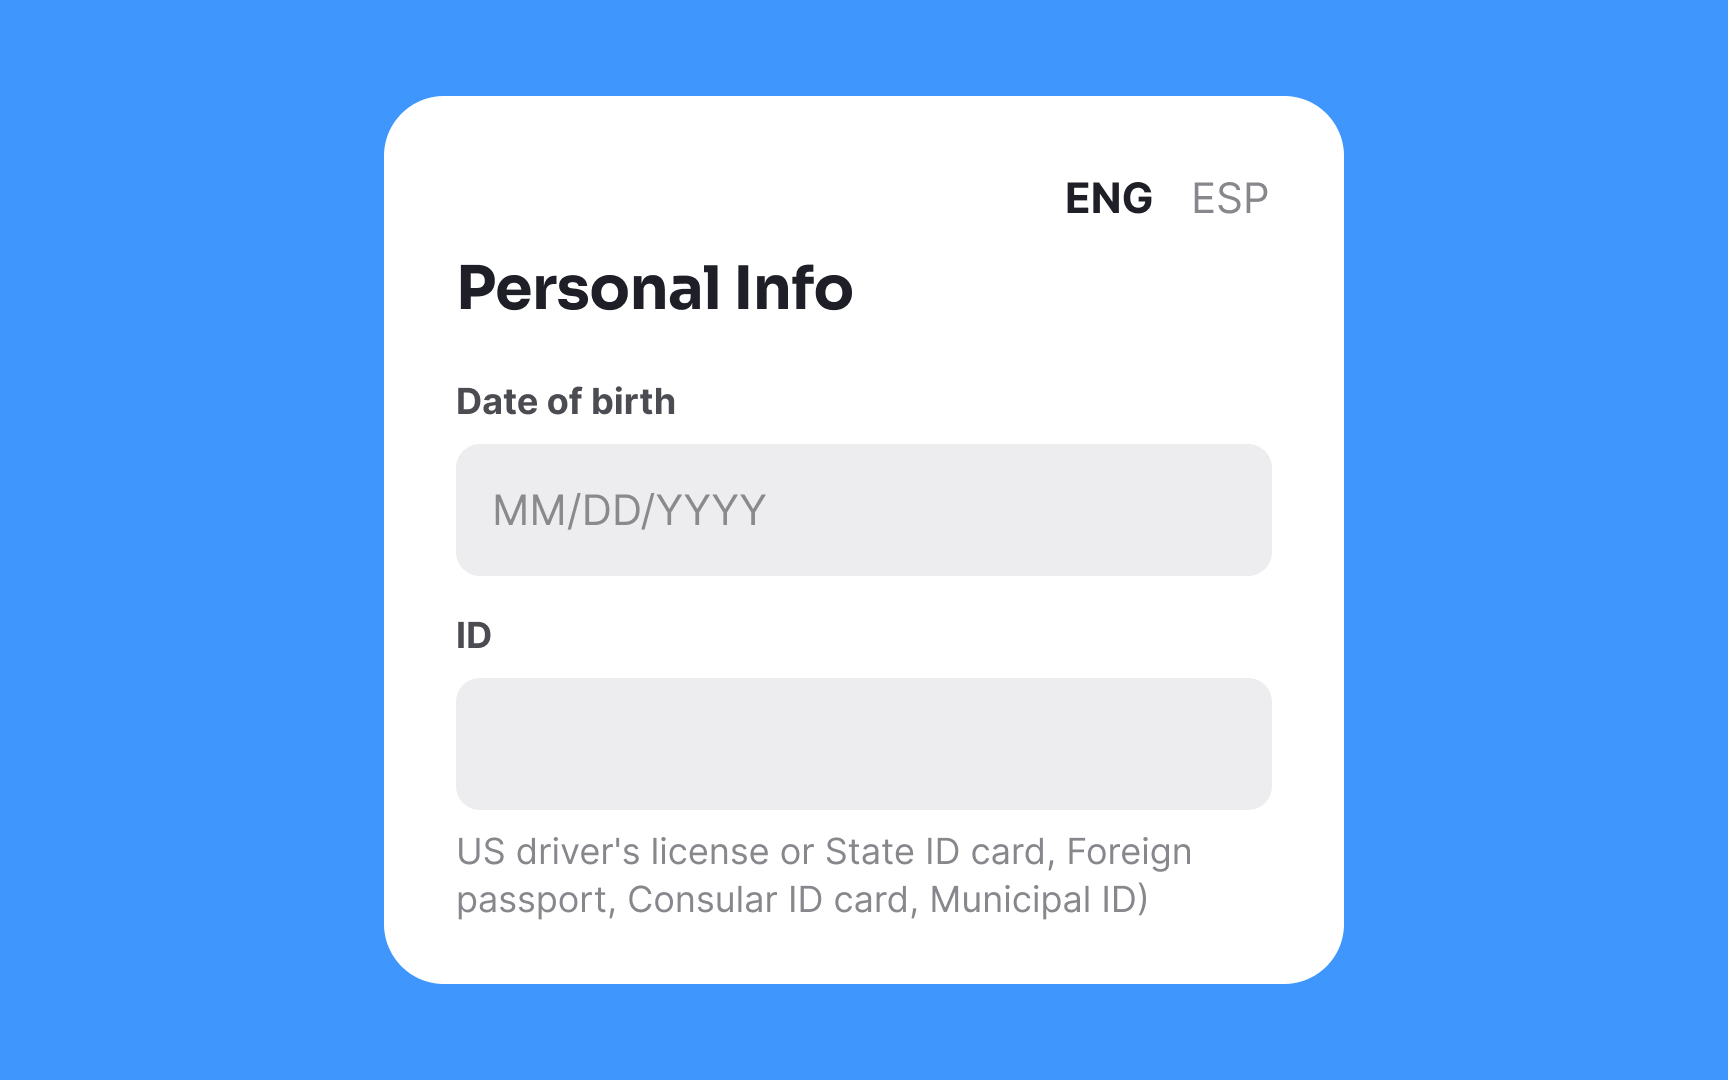
Cultural competency determines if government services actually reach and serve diverse communities. For example, a well-designed permit application might fail if it assumes all users communicate in the same way. In South Texas, where 40% of the population is Spanish-speaking, providing English-only forms creates a significant barrier to service access.
Key competency areas include:
- Communication styles: Using simple vocabulary and providing support in multiple languages
- Document design: Forms should work for languages read left-to-right and right-to-left, with clear date and number formats
- Time expectations: Service hours and deadlines should consider prayer times, religious holidays, and cultural events
- Family structures: Forms should accommodate extended families living together and varied definitions of primary caregivers
A benefits application asking for "parents' names" might exclude grandparents raising children. Online services scheduled for maintenance during major cultural celebrations could block access when users need it most.
Pro Tip: Test your service with community groups to identify design choices that might create unintended barriers.
Accessibility frameworks show exactly how to make government services work for people with different abilities. WCAG 2.2 establishes specific requirements for every digital service element:
Key requirements include:
- Screen reader support: All images need alt text, forms must have proper labels, headings need correct hierarchy (H1 to H6)
- Keyboard controls: Every button and link must work without a mouse, with visible focus indicators at least 2 pixels thick
- Visual design: Text needs 4.5:1 minimum contrast ratio, links must not rely on color alone, text must resize up to 200%
- Cognitive access: Forms must keep data when
errors occur, consistent help options must be available, dragging actions need alternatives
A compliant service lets users complete tasks in multiple ways. For example, a permit application must work with voice commands, keyboard-only input, or mouse navigation.
WCAG 2.2 introduces nine new success criteria that strengthen focus visibility requirements, add spacing rules for interactive elements, improve authentication flexibility, and enhance form error prevention. These updates particularly benefit users with cognitive disabilities and those using mobile devices.[2]
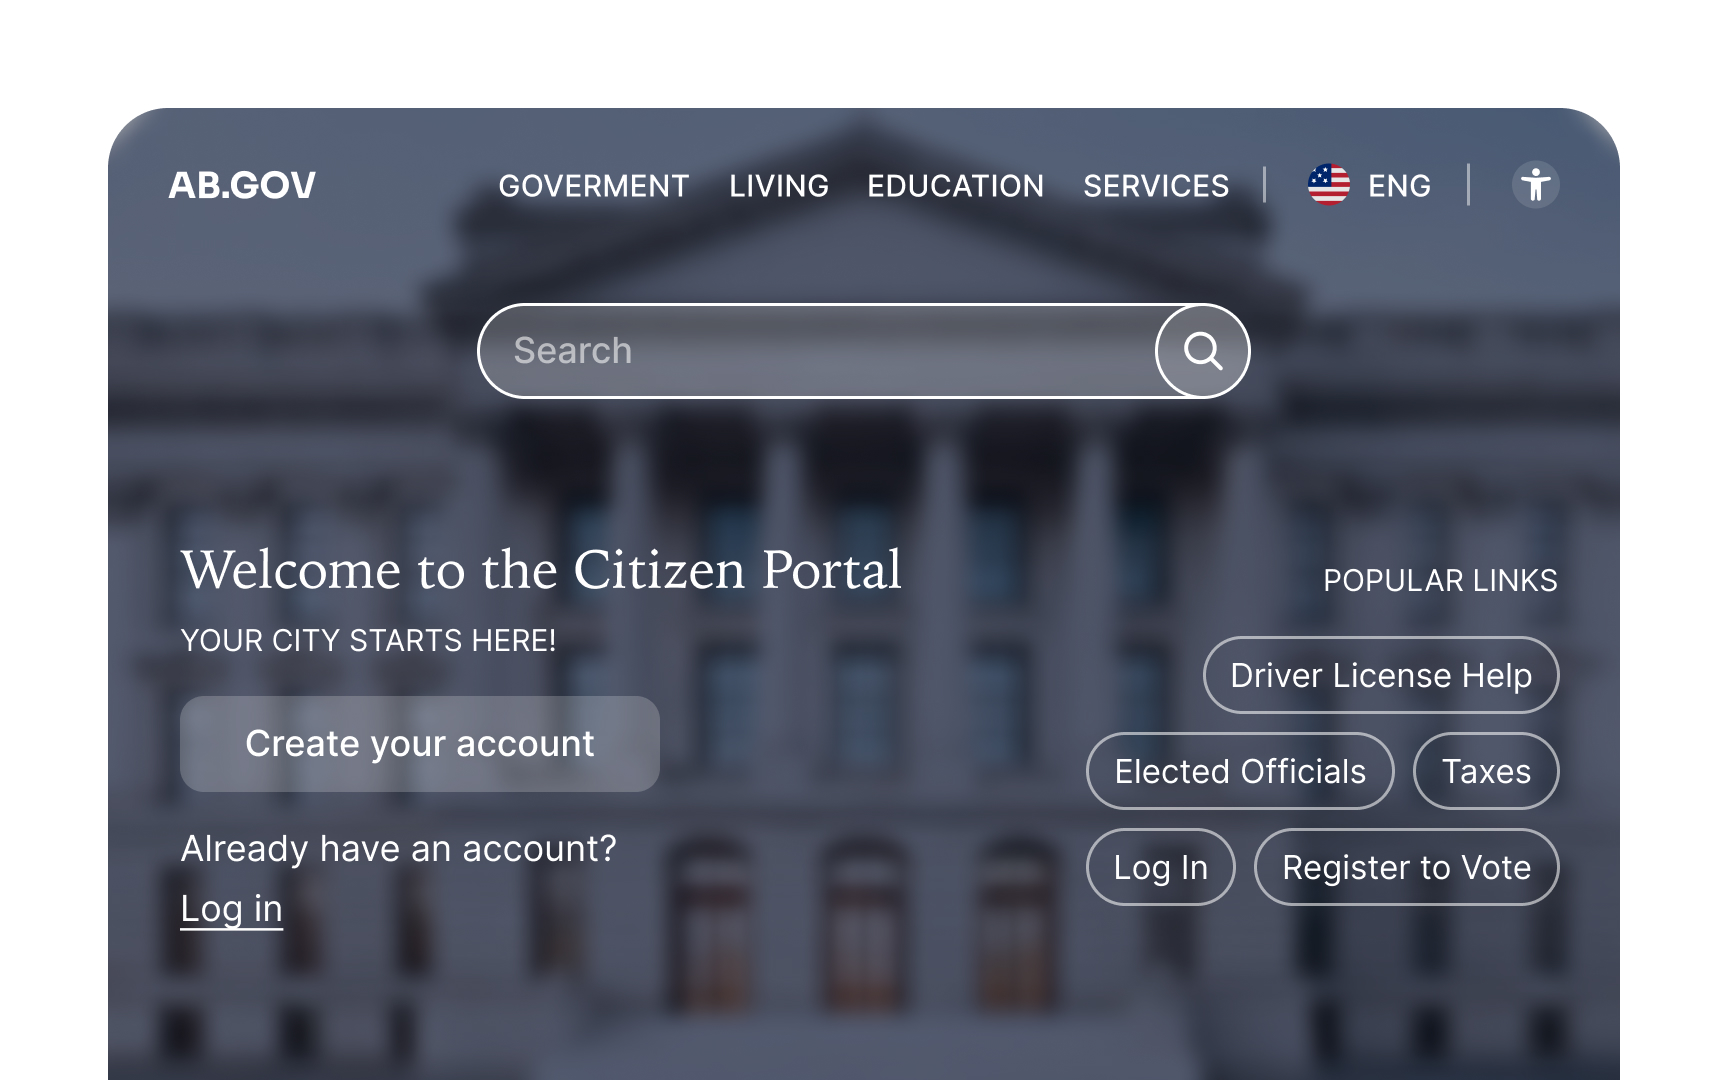
Community engagement helps design better government services through partnerships with local organizations. Design teams can connect with communities through:
- Community centers: Partner with neighborhood centers, libraries, and cultural organizations that already serve local groups
- Local leaders: Work with religious leaders, cultural organizations, and neighborhood associations who can gather community members
- Service partners: Connect through social workers, healthcare providers, and educators who interact with service users daily
- Advocacy groups: Collaborate with disability rights organizations, immigrant support groups, and senior centers
Building these connections requires clear planning. Start by mapping local organizations, reaching out with specific requests, and offering compensation for people's time and expertise.
For example, when designing senior services, teams work through senior centers. These organizations help recruit participants, provide meeting spaces, and share insights about their members' needs.
Pro Tip: Build relationships with 2-3 community organizations before starting your design process. They'll help reach the right people.
Ethical decision-making in government services means choosing between competing community needs. For example, when designing an emergency alert system, teams face specific choices:
- Data collection: Whether to require personal data for better targeting vs. respecting privacy preferences
- Technology choices: Balancing app-based alerts that reach 80% quickly vs. phone calls that reach everyone slowly
- Language support: Deciding how to split the translation budget between most-spoken vs. all community languages
- Access methods: Choosing between improving digital tools or maintaining in-person service centers
Each choice affects communities differently. An ethical framework helps evaluate options by asking:
- Who benefits from this decision?
- Who might face new barriers?
- What data supports this choice?
- How can we mitigate the negative effects?
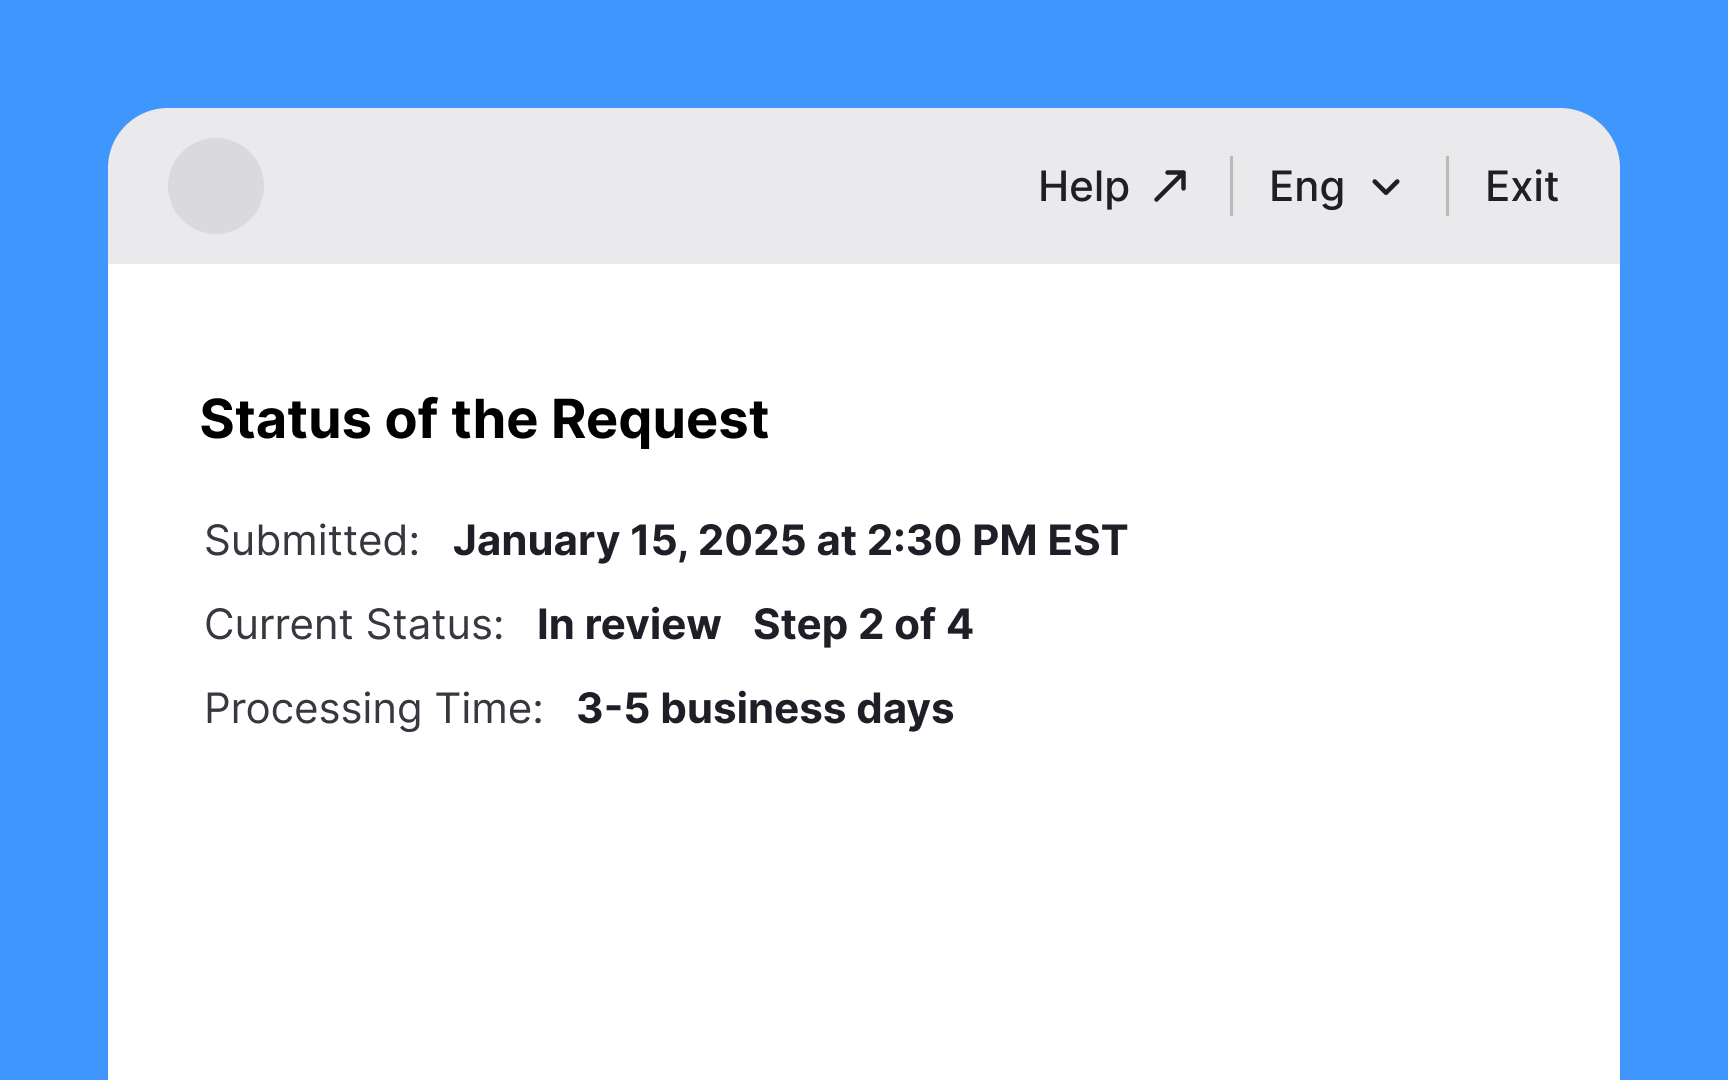
Trust building in government services happens through specific, measurable actions. Project briefs for stakeholders, Status dashboards showing real-time service performance, clear response timelines, and visible proof of improvements based on feedback help build confidence.
Key trust-building methods include:
- Processing status: Showing exactly where requests are in the system (e.g., "Review Stage 2 of 4. Expected: 2 days")
- Issue updates: Sending notifications when problems occur and sharing the fix progress every 4 hours
- Timeline clarity: Publishing typical processing times and notifying users of any changes
- Feedback results: Displaying "You Asked, We Did" updates showing how community
input shaped changes
For example, SNAP (Supplemental Nutrition Assistance Program) applications should show current wait times, applicants' position in the queue, and which review stage their application has reached. If system delays occur, applicants need both an explanation and information about emergency food assistance options.
Pro Tip: Update your status page at least daily. Even "no change" updates show users you're actively monitoring the service.
Equity assessment measures whether government services work equally well for all communities. For example, the U.S. Digital Services Playbook outlines specific metrics to track service performance across different user groups.
Key assessment areas include:
- Response times: Track if some groups face longer processing times than others
- Completion rates: Monitor the percentage of started vs. finished applications across communities
- Error patterns: Identify where specific groups encounter more submission problems
- User satisfaction: Compare feedback scores and support requests between different communities
Teams should track the 95th percentile performance data to spot outliers. Users who face much longer wait times or higher


Similar lessons

Sustainability & Ethics in Design Thinking

Ethical & Societal Implications

Social justice design
Social justice design ensures government services actively reduce community inequities. This approach identifies and fixes service elements that might disadvantage certain groups, even unintentionally.
Key design approaches include:
This might mean adding interpreters where language barriers exist, creating alternative verification methods for people without standard documentation, or offering additional program support in areas with lower digital access.
For example, when service data shows lower success rates in certain areas, teams can add targeted support like application guides or extra help options. These adjustments help ensure services work equally well for everyone.