Financial Metrics for PMs
Turn product decisions into business results by tracking the numbers that matter
Financial metrics show whether your product decisions are actually working. When you understand numbers like customer acquisition cost, lifetime value, and profit margins, you can make smarter choices about what to build next. These metrics connect the features you ship to the money they generate, helping you focus on work that grows the business.
Knowing your financial metrics helps you talk to executives in their language and get budget for your ideas. You'll track things like monthly recurring revenue and unit economics to prove your product's worth. This knowledge shifts you from someone who just ships features to someone who drives real business results. You'll know exactly how your work impacts the company's revenue and can use that knowledge to make better product decisions.
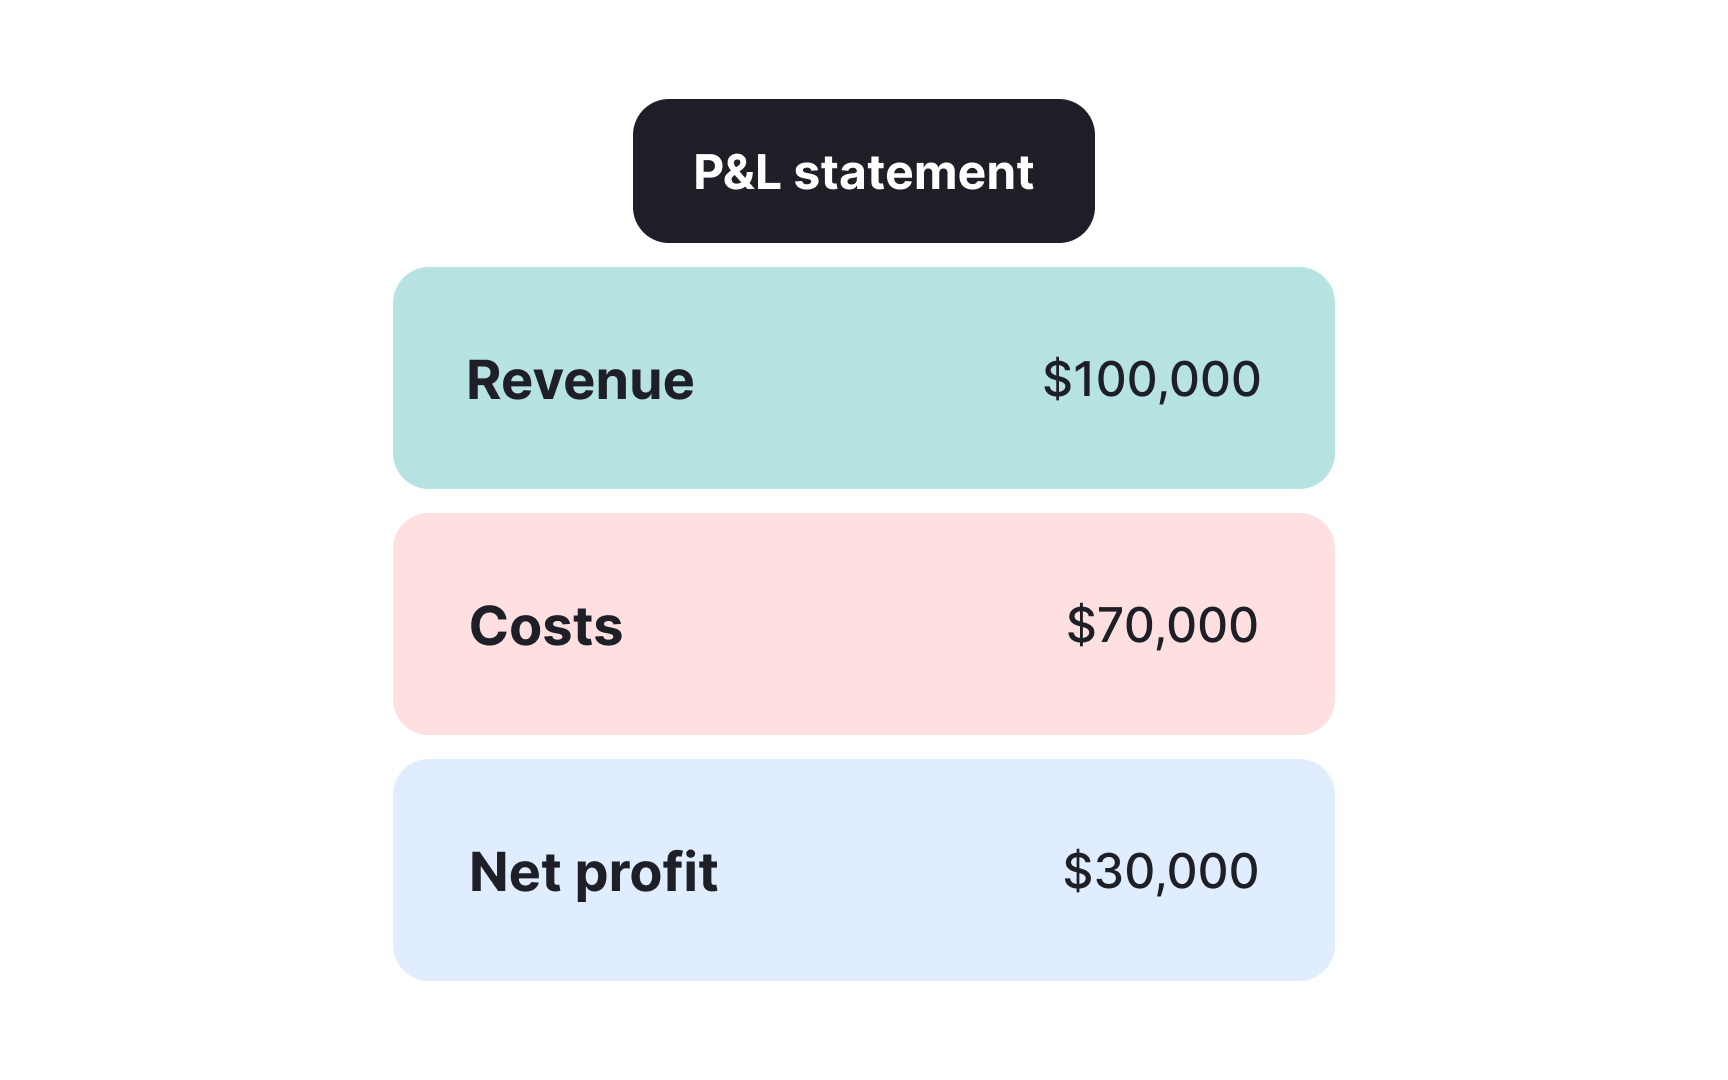
A profit and loss (P&L) statement shows whether a product or business is making money. It summarizes revenues, costs, and expenses during a specific period, revealing the financial health of your product. Think of it as your product's financial report card.
The P&L statement has 3 main components:
Revenue (money coming in): It includes all income from product sales, subscriptions, or services.- Costs (money going out): It cover everything from development expenses to marketing spend and operational costs.
- The net profit is what's left.
Product managers use P&L statements to track performance, identify trends, and make strategic decisions. Understanding how each product decision impacts the bottom line helps you prioritize features that drive profitability, though it should be weighed alongside user value and strategic goals. Regular P&L reviews help you spot problems early and adjust your strategy accordingly.
Pro Tip: Review your P&L monthly to catch trends early and adjust your product strategy before small issues become big problems.
Common revenue models include
Cost structures typically include fixed costs (salaries, rent) and variable costs (server usage, customer support). Direct costs tie directly to product delivery, while indirect costs support overall operations. Tracking the ratio between customer acquisition costs and revenue helps ensure sustainable growth.
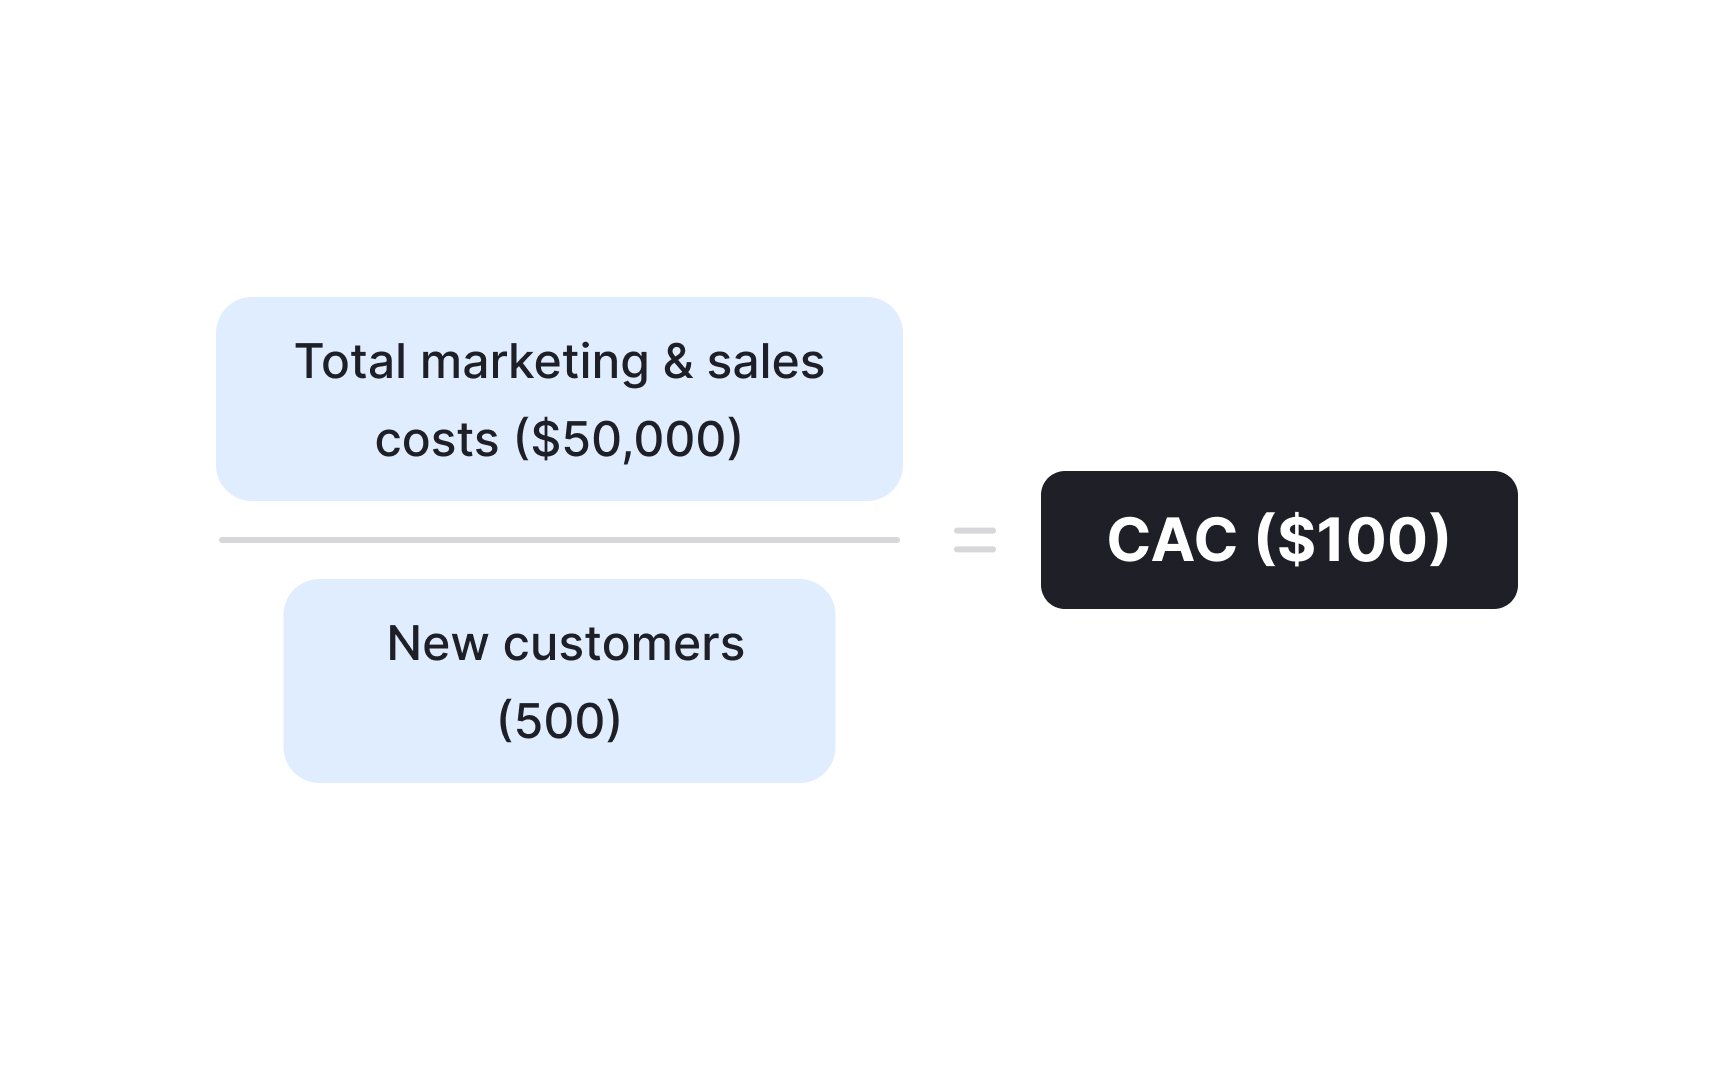
Customer acquisition cost (CAC) measures how much you spend to acquire one new customer. Calculate it by dividing total sales and
CAC includes all costs associated with attracting and converting prospects: advertising spend, sales team salaries, marketing tools, and promotional offers. A healthy business model requires CAC to be significantly lower than the
Different acquisition channels have varying CACs. Organic search might cost less than paid ads, while referrals often have the lowest CAC.
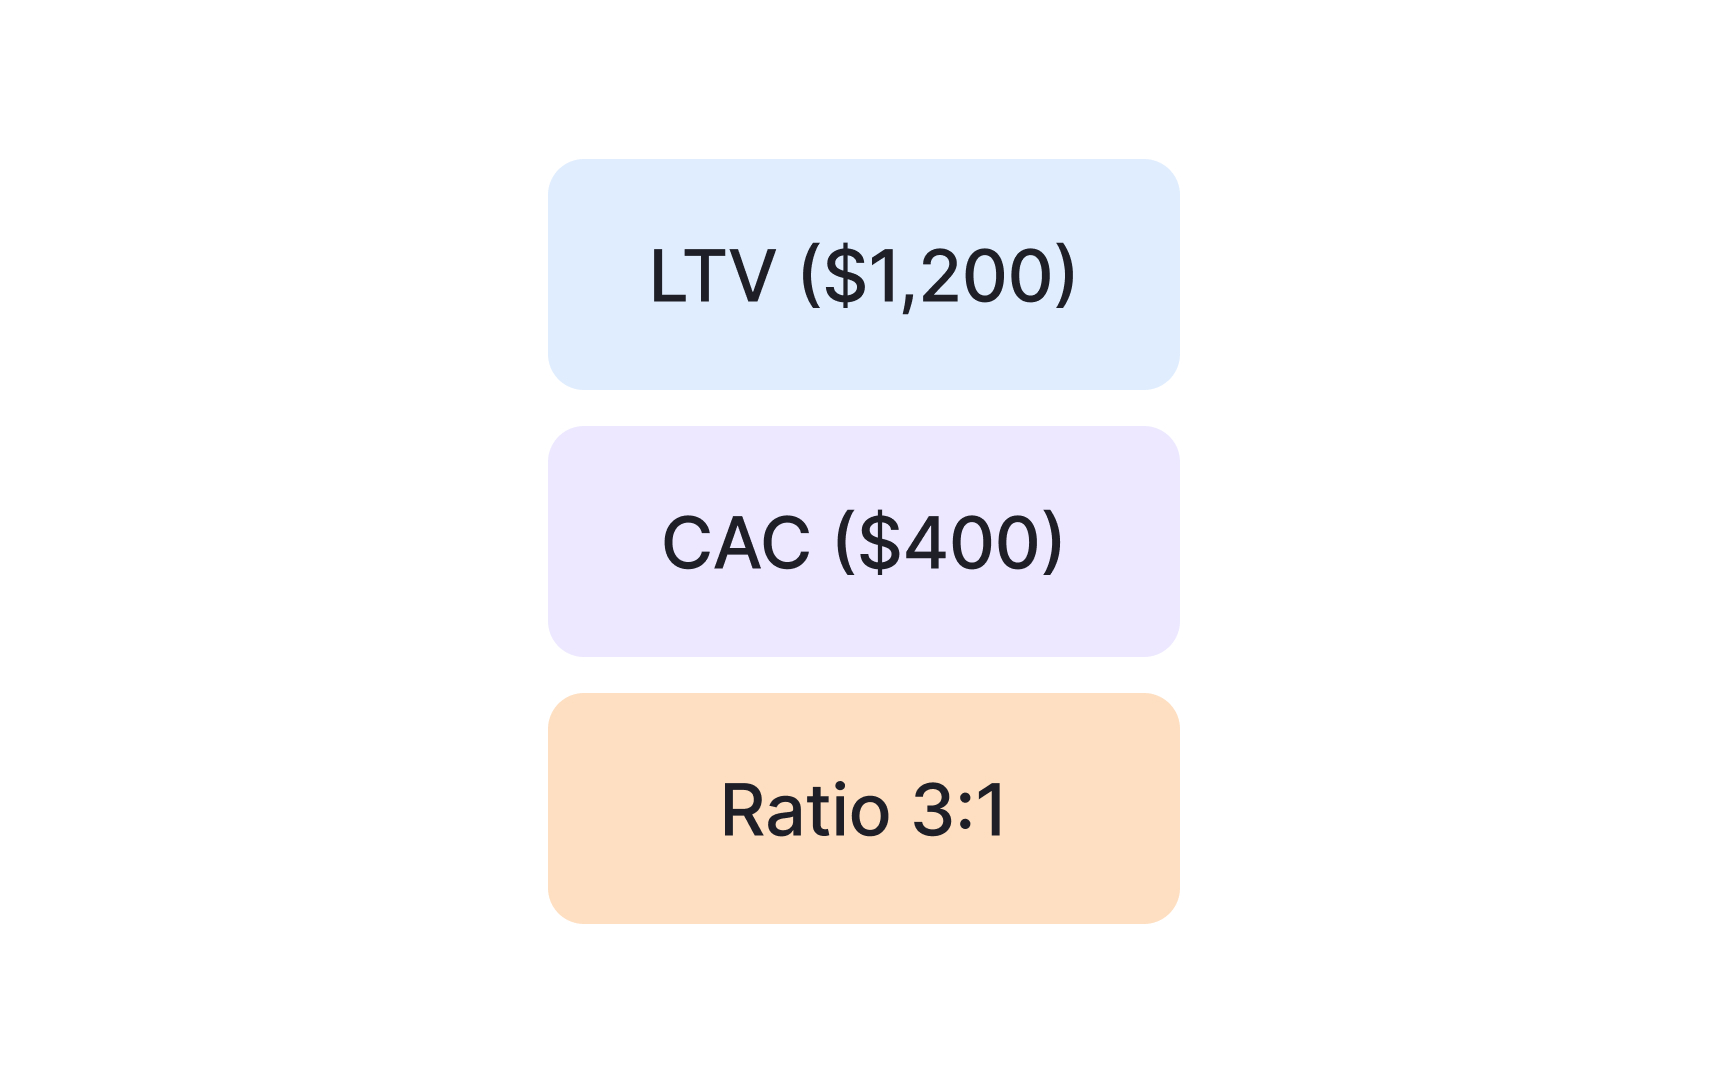
Customer lifetime value (LTV) predicts the total
A healthy business maintains an LTV to
LTV varies by customer segment, pricing tier, and product usage patterns. Premium customers often have higher LTV despite similar acquisition costs. Understanding these differences helps you focus resources on acquiring and retaining your most valuable customer segments.
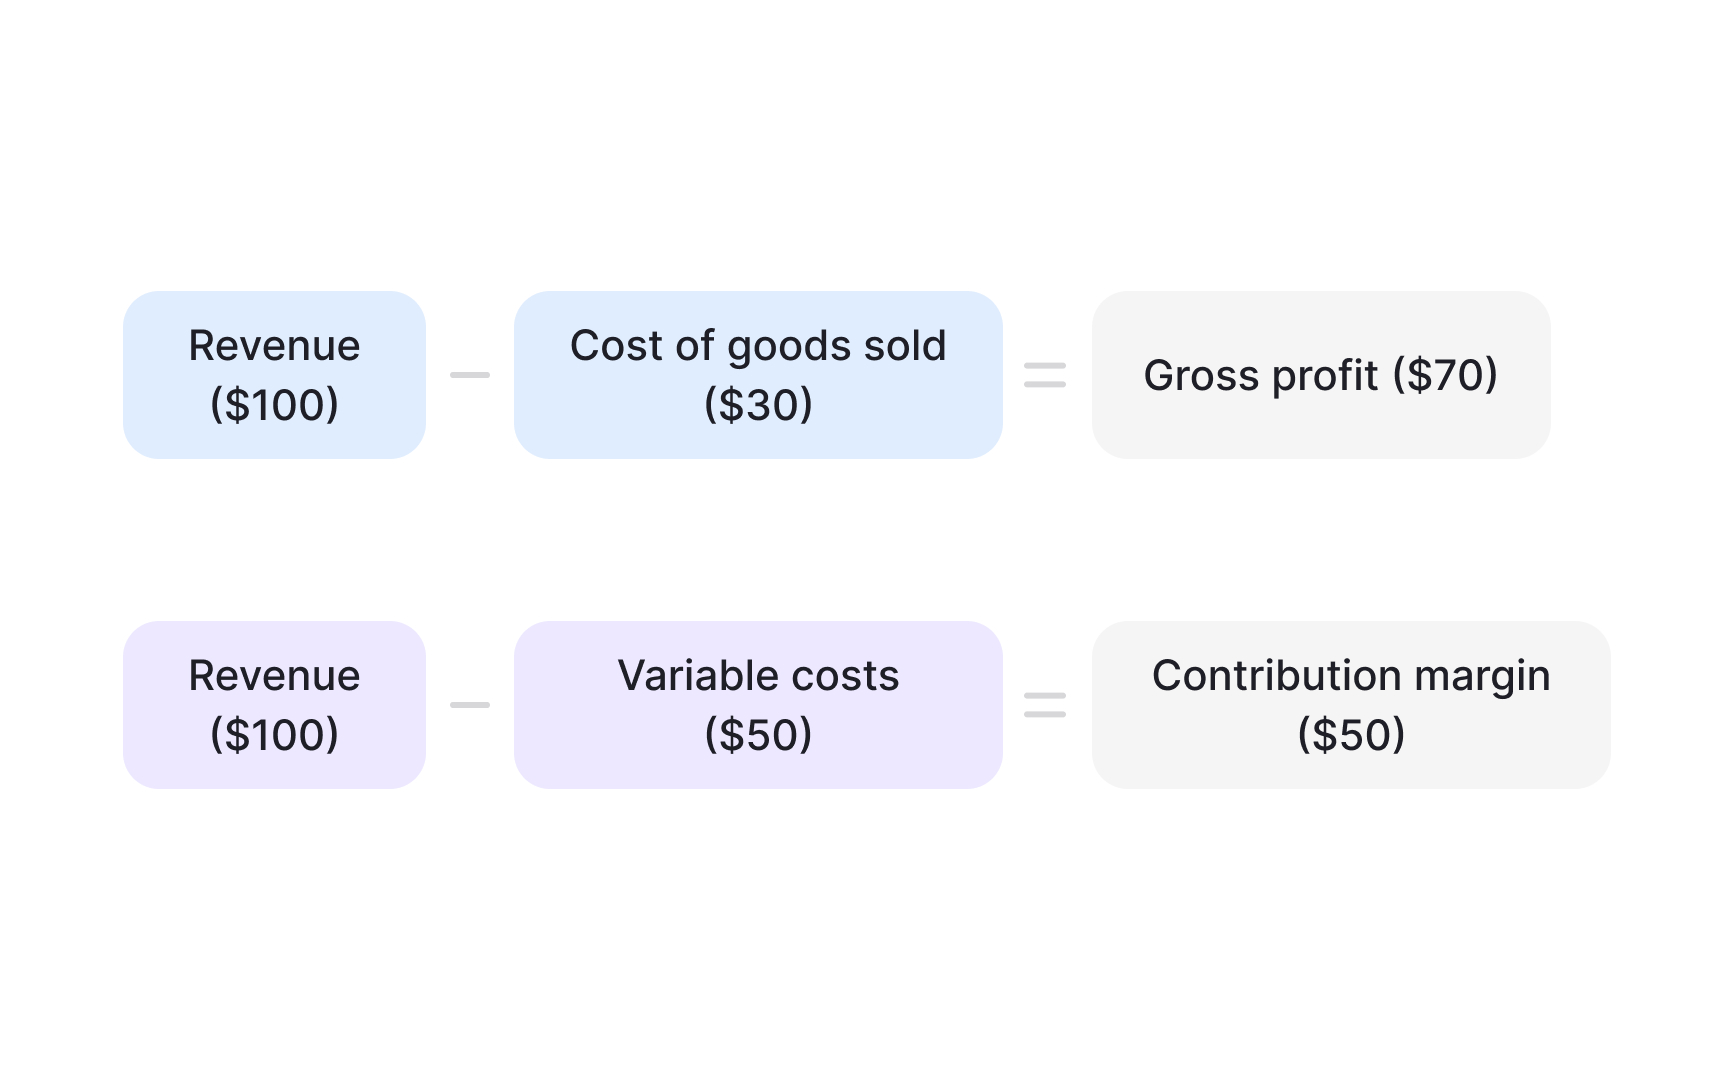
Gross margin shows how much money remains after subtracting the direct costs of making or delivering a product. It is calculated by dividing gross profit by total
Contribution margin goes deeper by subtracting all variable costs, such as transaction fees, packaging, or commissions, to show how much profit is left to cover fixed costs like rent, salaries, or software licenses. This metric helps compare the profitability of individual products or features. Products with a negative contribution margin lose money on every sale and should be adjusted or removed. On the other hand, products with strong contribution margins can fund fixed expenses and support business growth.
The key difference is that gross margin gives a broad view of overall profitability, while contribution margin reveals which products or features truly add profit after variable costs.
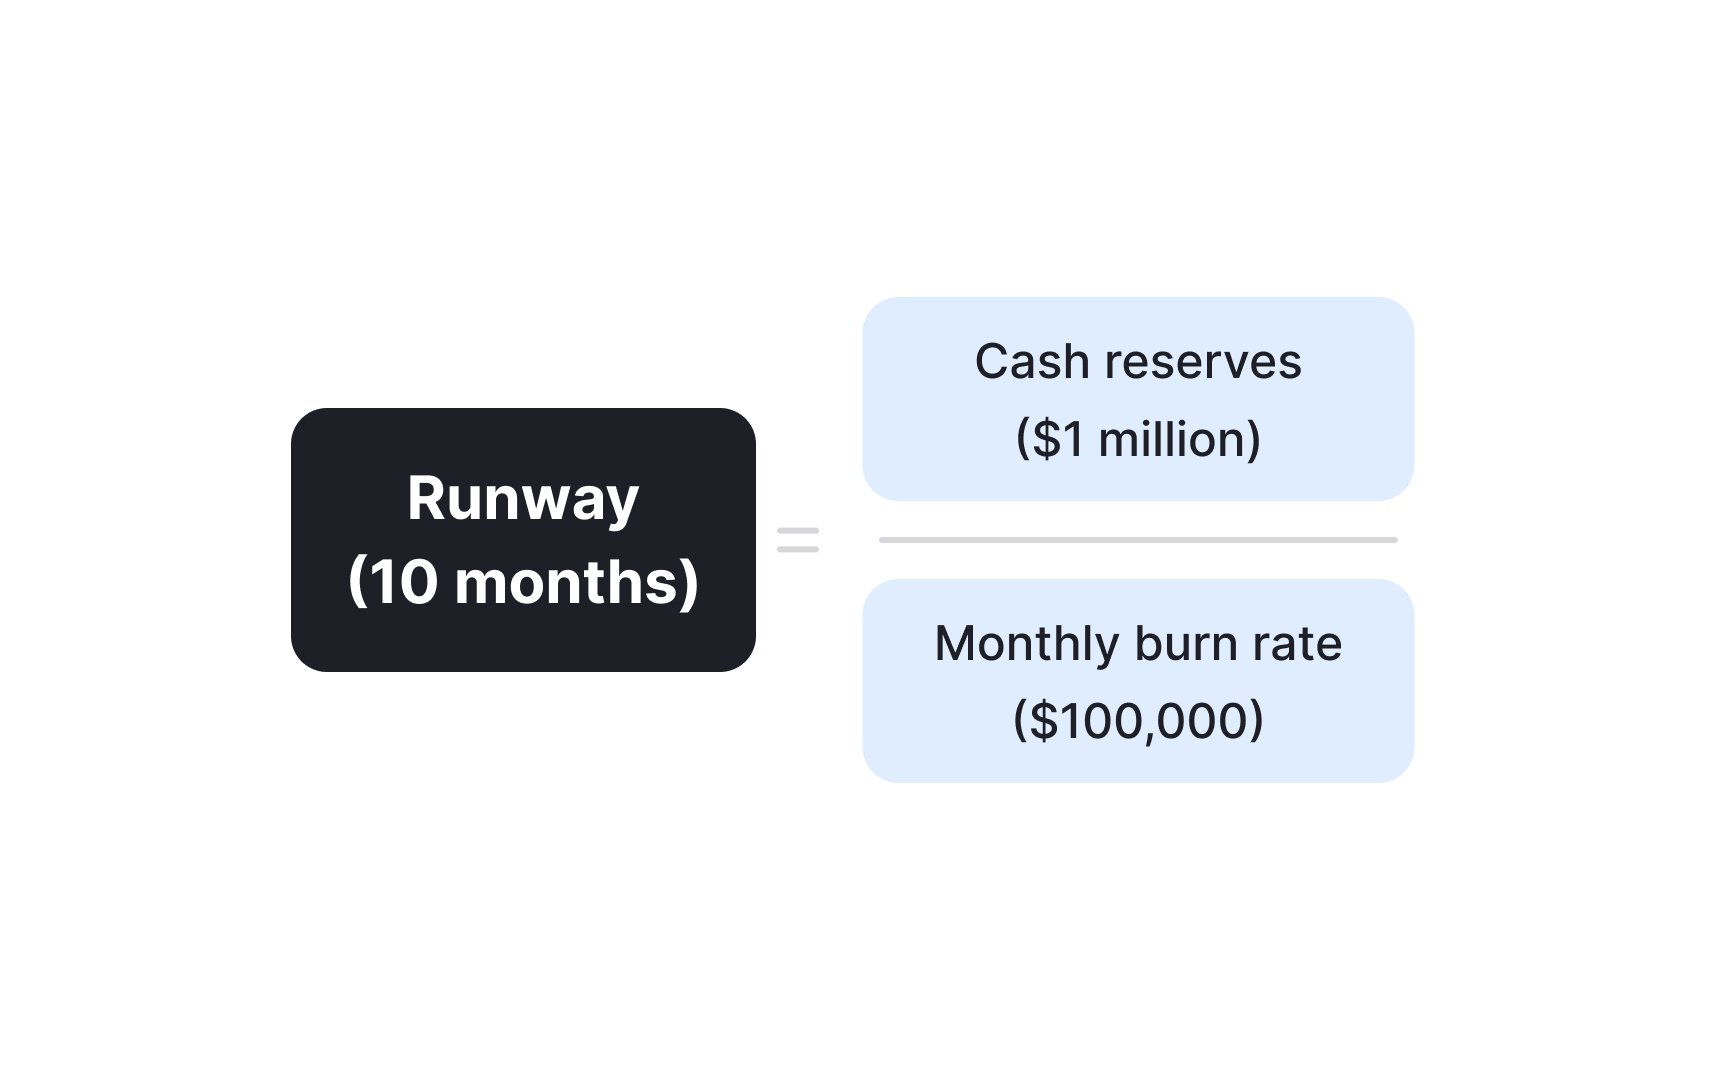
Burn rate measures how quickly a company spends its cash reserves, typically calculated monthly. Gross burn includes all expenses, while net burn subtracts
A startup with $1 million in bank and $100,000 monthly burn has 10 months of runway. This timeline determines when you need additional funding or must reach profitability. Extending runway involves either reducing burn (cutting costs, freezing new hires, etc.) or increasing revenue (by accelerating growth by aggressive
Balance growth investments against runway constraints to ensure sustainable development without risking cash depletion.
Pro Tip: Maintain at least 12-18 months of runway to provide buffer for fundraising or pivoting if growth plans change.
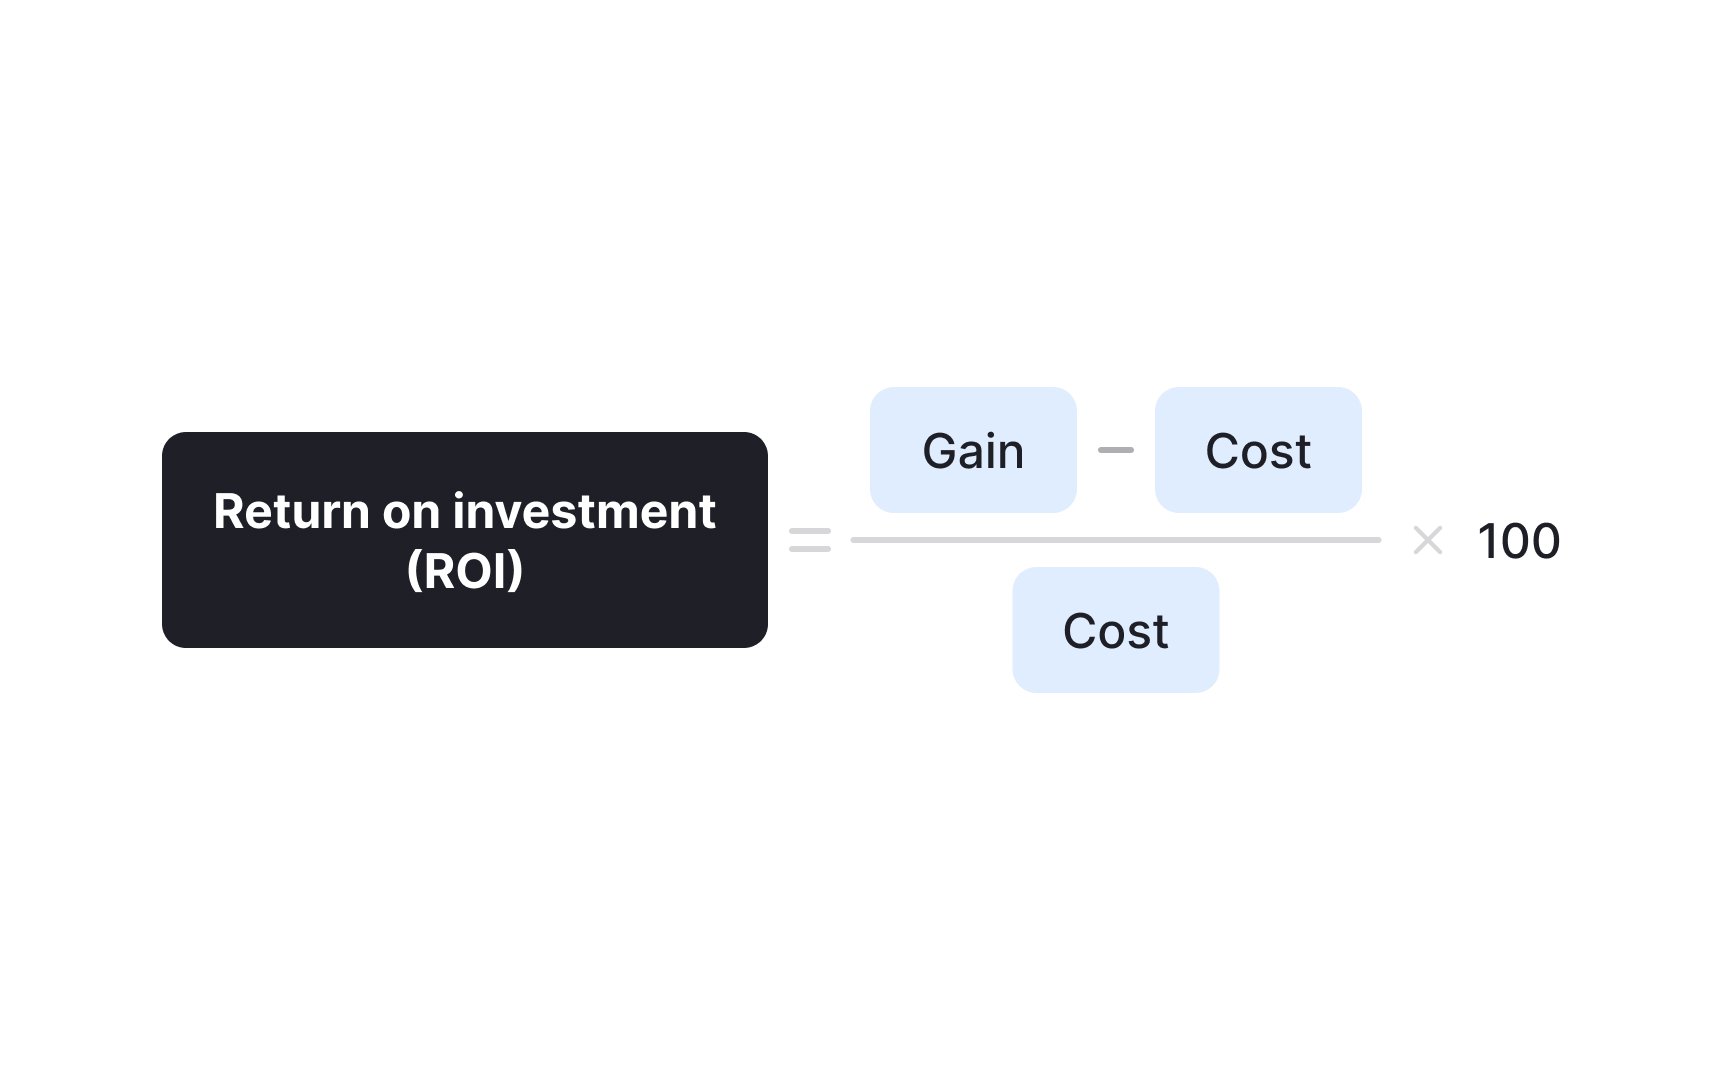
Return on investment (ROI) measures the profitability of investments by comparing gains to costs. Calculate it as (Gain - Cost) / Cost × 100%. Payback period shows how long an investment takes to recover its initial cost through generated returns. Both metrics guide resource allocation decisions.
A feature costing $50,000 to develop that generates $150,000 in additional
Product managers use ROI analysis to prioritize feature development and justify investments. Compare potential projects by their expected ROI and payback periods. Generally, pursue high-ROI projects with short payback periods first, unless strategic factors override pure financial returns.
Financial forecasting estimates future
Start with historical performance data if they are available, then layer in growth assumptions and known changes. Consider seasonality, market trends, and planned product updates. Build conservative, realistic, and optimistic scenarios to understand potential outcomes. Update forecasts monthly as new data emerges. Your forecast accuracy tends to improve dramatically after 6-12 months of consistent tracking and adjustment.
Common forecasting methods include bottom-up (aggregating individual estimates) and top-down (applying growth rates to current numbers). Combine both approaches for accuracy. Remember that forecasts are educated guesses; build buffers for uncertainty and track variance to improve future predictions.
Effective budgeting aligns spending with strategic priorities while maintaining financial discipline. Start by understanding available resources and fixed commitments before allocating discretionary funds.
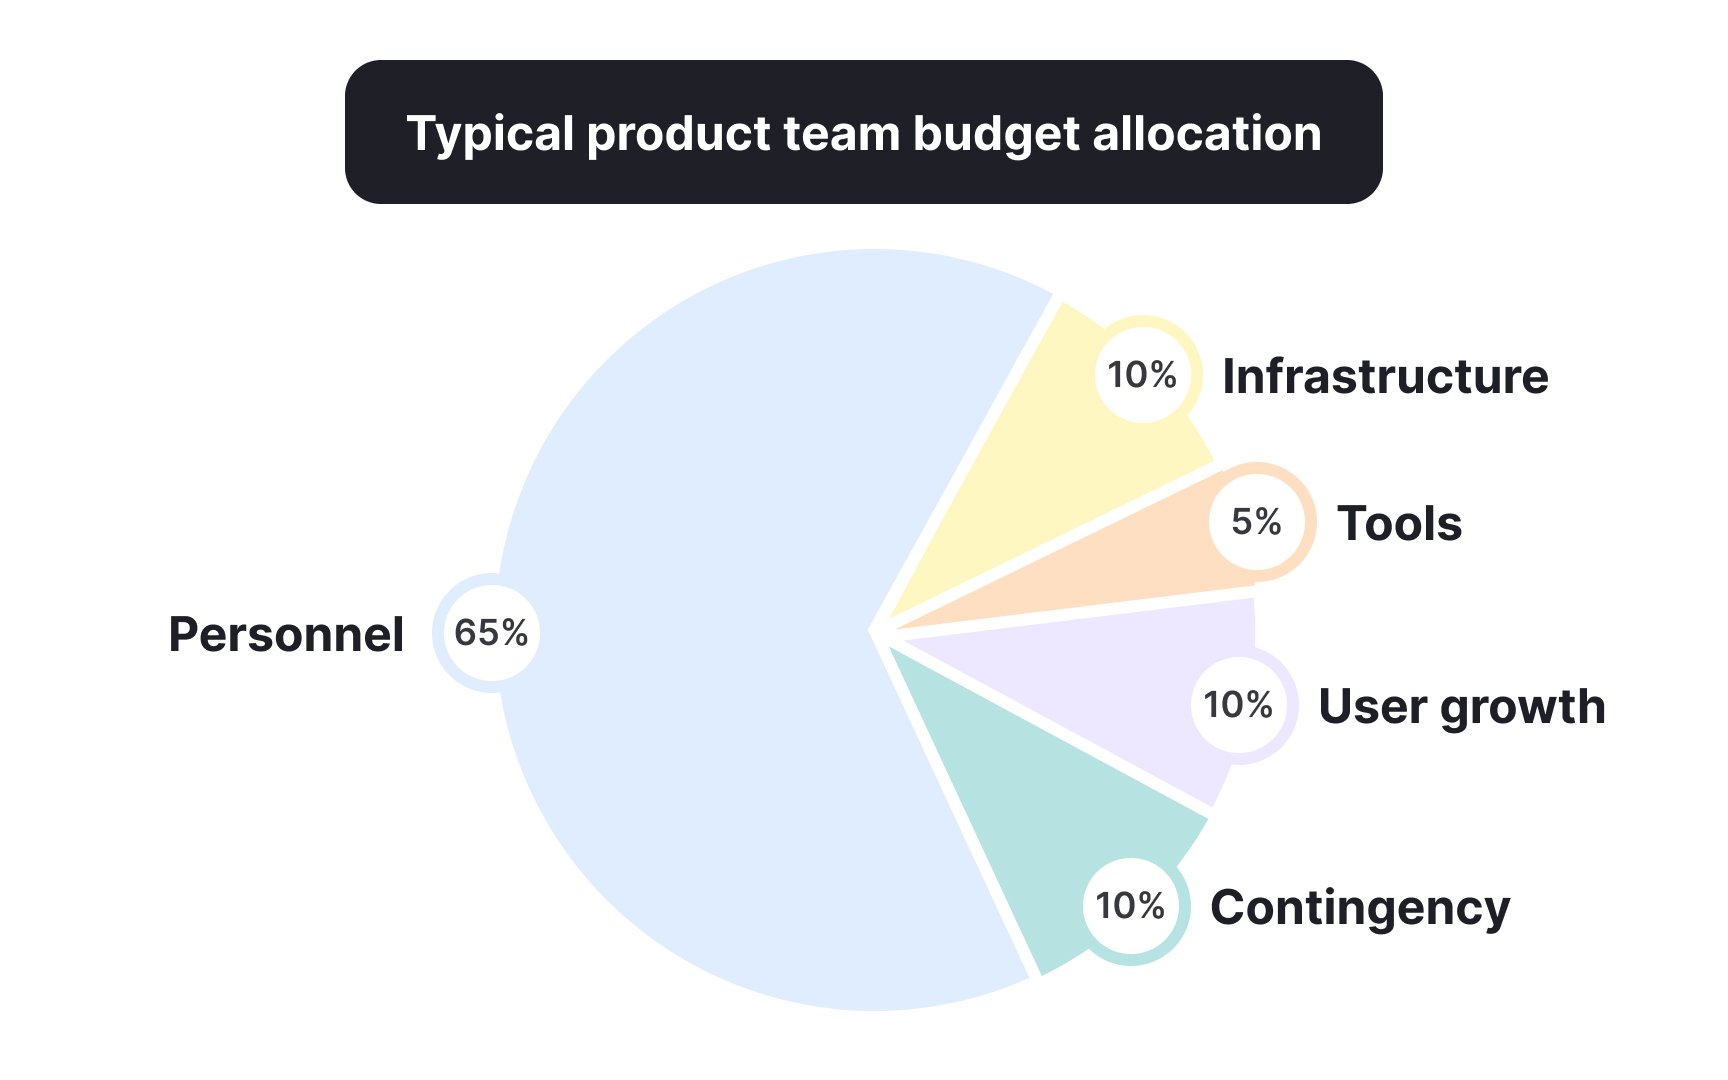
Break budgets into categories like: personnel (usually 60-70% of budget), tools and infrastructure, user growth and adoption programs, and contingency reserves. Link each expense to specific outcomes or metrics. This connection helps justify spending and enables quick reallocation when priorities shift.
Zero-based budgeting (ZBB) is particularly effective for product teams because it requires starting each budget cycle from zero and justifying every expense based on current needs and value. Unlike traditional budgeting that incrementally adjusts previous allocations, ZBB prevents unnecessary spending on outdated priorities and ensures resources align with current strategic objectives. This promotes financial discipline and helps product teams focus on investments that deliver measurable impact.
Pro Tip: Reserve 10-15% of your budget for unexpected opportunities or challenges that arise mid-year.
Presenting financial data effectively means translating numbers into stories that drive decisions. Stakeholders care about different metrics: executives want ROI and growth rates, while engineers might focus on resource allocation. Tailor your message and visuals to your audience's priorities and financial literacy.
Structure presentations with context, key findings, and recommended actions. Start with the big picture before diving into details. Use visualizations like charts and graphs to make data digestible. Avoid jargon and explain calculations when presenting to non-financial audiences.
Always connect financial metrics to product outcomes and business goals. Prepare for questions by understanding the data deeply and having backup slides with additional details.
References
- Customer Acquisition Cost (CAC) | ProductPlan
- Lifetime Value (LTV) | ProductPlan
Topics
From Course

Share


