The story behind the numbers
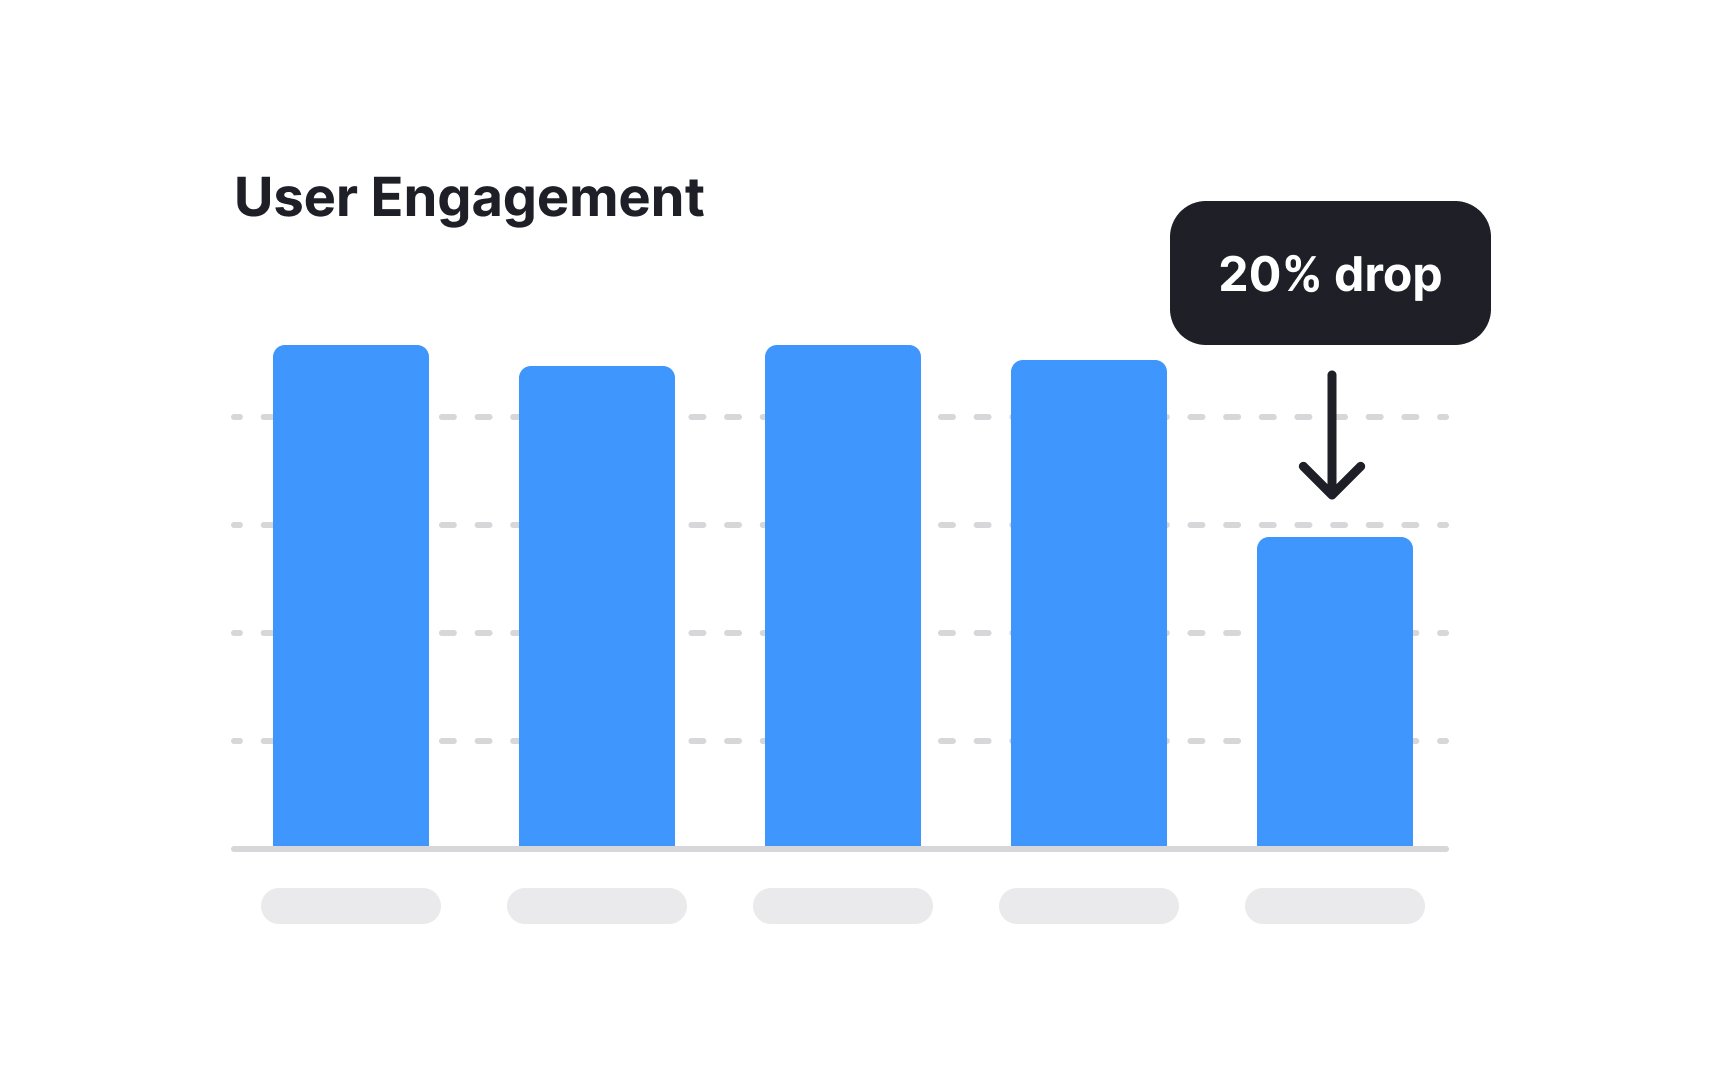
Numbers show what happened, but they rarely explain why. A 20% drop in engagement could mean anything from a technical bug to a competitor's new feature. Finding the story requires detective work that goes beyond spreadsheets.
Start with timing. When exactly did the change occur? Look for correlations with product releases, marketing campaigns, holidays, or external events. A gradual decline suggests different causes than a sudden drop. Patterns that match school schedules, paydays, or seasons provide important context.
Examine related metrics for clues. If engagement drops but session length increases, users might be struggling to find what they need. If new user activation improves while retention worsens, you might be attracting the wrong audience. Connected metrics often tell a more complete story than any single number.
Don't forget about external factors. Competitor launches, economic changes, or shifts in user behavior across your entire industry matter. What looks like a product problem might actually be a market trend affecting everyone.
Pro Tip: Keep a changelog of all product, marketing, and external events to help explain metric changes.
