Design Shot - Heatmap Dashboard Component


A meticulously crafted dashboard component that exemplifies clean design and functionality to show heatmap chart.
- Intuitive Heatmap Visualization: The grid layout effectively represents customer activity, utilizing varying shades of blue to indicate visit intensity. This design choice not only enhances readability but also draws attention to peak engagement times.
- Detailed Insights at a Glance: Hovering over specific time slots reveals essential metrics.
- Focus on Clean Design: Every element is thoughtfully designed to ensure a seamless user experience, making data interpretation straightforward and efficient.
Reviews
3 reviews

The heatmap dashboard component is well-designed, with a clean layout and clear visualization of data. The thoughtful use of color and spacing makes the information easy to understand. Great job on creating an effective and polished design!

I'm currently switching back and forth between your design shots and my online store's customer cohort analysis widget. I guess it depends on who the end user will be, but I wonder: will it be too crowded if you add an “Improve↗” link or button next to the “3% retention” tooltip?
As a dashboard user, I think it would help me a lot to have that kind of CTA so I don't have to go through blogs and docs to solve the problem right there and then.
Nonetheless, nice work!

What Works Well:
- Excellent heatmap - the blue color shades intuitively show activity intensity, and the grid layout makes it easy to quickly spot behavior patterns.
- Clever tooltip - displaying details (492 visits, 1,730 sessions, 3% retention) only on demand is a smart solution.
- Clear summary - the large number 36,241 with a positive indicator of +5.6% catches the eye and provides a quick overview of the situation.
- Minimalist design - the limited color palette and well-thought-out information hierarchy create a clean, uncluttered interface.
Areas for Improvement:
- Accessibility - the lightest shades of blue may be difficult to distinguish for people with visual impairments.
- Missing legend - we don't know exactly what values the different shades of blue represent.
- Limited filtering - a more flexible date range selector would be useful beyond just "This Week."
- Metric context - there's no explanation of what exactly "3% Retention" means in this context.
Quick Suggestions:
- Add a simple color legend
- Expand date filtering options
- Include an accessibility mode with numerical values
- Introduce period comparison capabilities
Summary:
The dashboard presents itself as a solid component with clean design. The heatmap effectively visualizes activity patterns, and the interface is intuitive. The designer's contribution is evident in the thoughtful organization of data and well-balanced amount of information.
With a few small improvements, especially in terms of accessibility and flexibility, this component could become a truly exceptional tool. Overall good job Muammar! 👍
You might also like
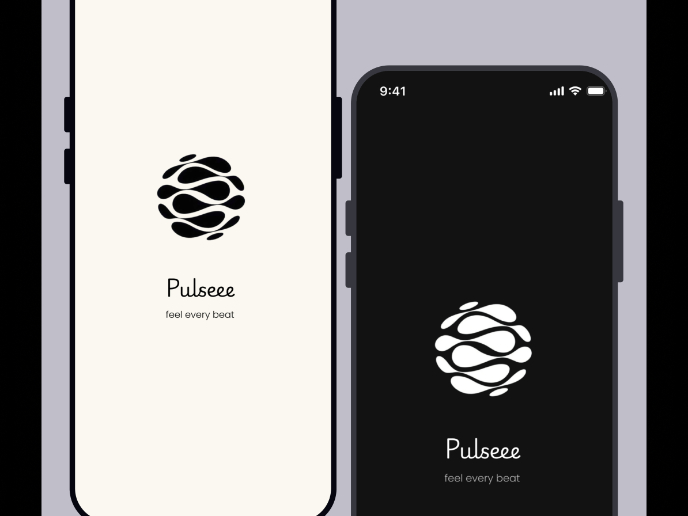
Pulse — Music Streaming App with Accessible Light & Dark Mode


Islamic E-Learning Platfrom Dashboard

SiteScope - Progress Tracking App

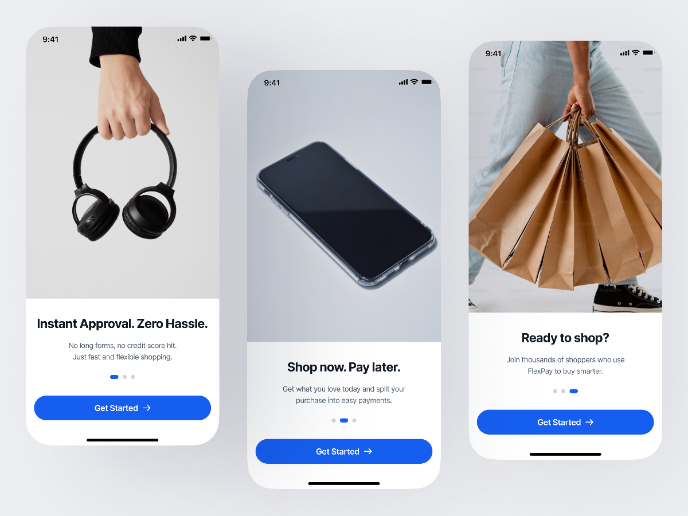
FlexPay

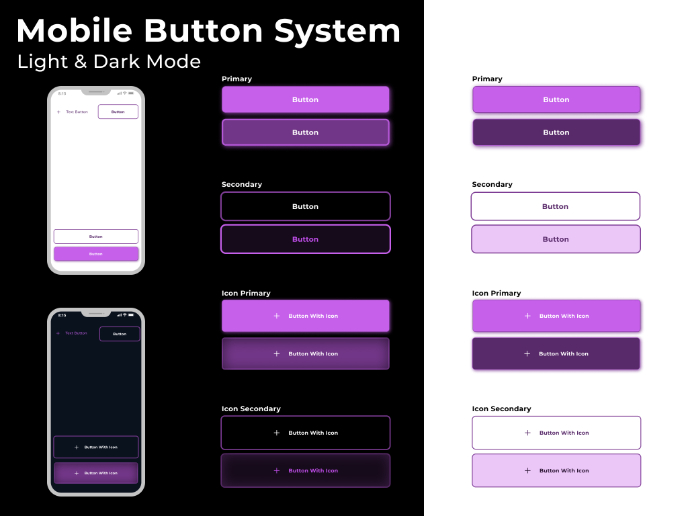
Mobile Button System


CJM for Co-Working Space - WeWork

Popular Courses

Core UI Components


Introduction to Design Systems


Advanced UI Components