DashIn-Marketing Campaign analytics Dashboard


Goal: Design a dashboard section that dynamically changes based on user selection, and provides contextual insights based on the data.
- Data: Overall Campaign Performance: (e.g., Total Clicks, Impressions, Conversions, Cost, ROI) - presented as key numbers.
- Campaign List: A table or list of individual campaigns.
- Detail View (Dynamic): When a user selects a specific campaign from the list, the dashboard below updates to show:
- Performance Trend for that specific campaign (e.g., daily clicks/conversions over time - line graph).
- Audience Demographics for that specific campaign (e.g., top age groups, gender distribution - pie/donut charts).
- Key Insights/Recommendations based on that campaign's performance (e.g., "Campaign X is performing 20% above average, consider increasing budget," or "Campaign Y has a high bounce rate, review ad copy").
- Focus: Information Architecture: How do you structure the dashboard so the user easily understands how to filter and see details?
- Dynamic States: Clearly indicate the active selected campaign. How does the "loading" state look when new data is fetched?
- Contextual Color: Use color to highlight the selected campaign, and to visually differentiate the insights/recommendations (e.g., green for positive, red for negative, blue for neutral information).
- Clarity of Insights: Make the insights concise and actionable.
Tools used
From brief

Topics
Share
Reviews
1 review

Nice work!
As “Daily Clicks,” “ROI,” and “CTR” are important metrics, ensure the contrast of their heading is sufficient to ensure all users can read it.
In terms of layout and visual design, this is a solid foundation. I would advise adopting a spacing system, such as a 4 pt or 8 pt grid, doing this will make sure you maintain consistent spacing between elements and appropriate padding. Introducing whitespace inside each card allows the design to "breathe" and feel less cluttered.
You have placed the most important metrics at the top, this is a very good choice as it allows the user to find it quickly.
For the “Key Insights” card, I think a clearer hierarchy would help, my suggestion is to move the comparison controls to the top right and let users select periods using relative dates (for example, “Last Week” or “Last Month”), which are easier to interpret.
Overall, good work!
You might also like
SiteScope - Progress Tracking App

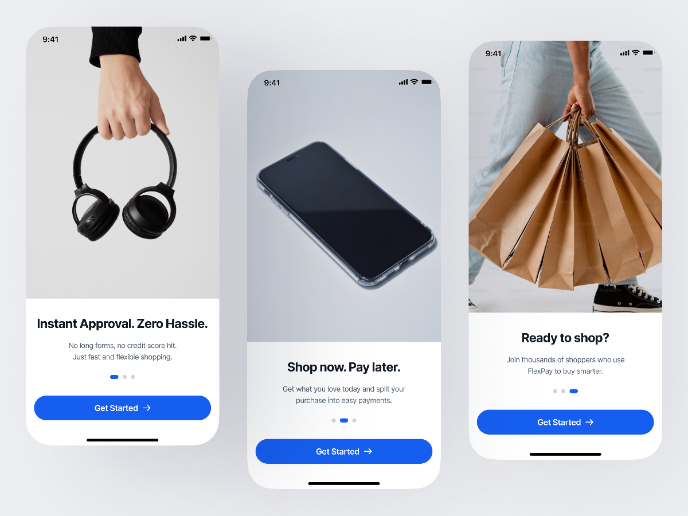
FlexPay

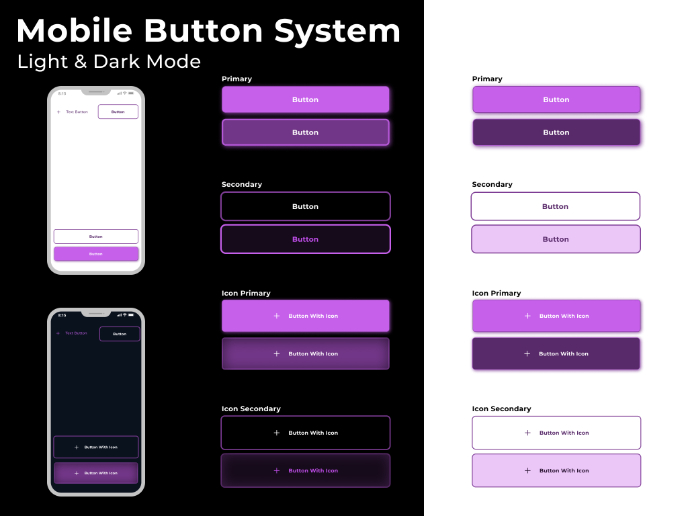
Mobile Button System


CJM for Co-Working Space - WeWork

Ubani Design System


Accessible Signup Form for SaaS Platform
Visual Design Courses

UX Design Foundations


Introduction to Figma

Design Terminology
