Budget Tracking Mobile App - Empathy Map

![]()
![]()
![]()
![]()
![]()

Reviews
2 reviews

Hello Ipek, your empathy map for the budget tracking app is excellent and demonstrates thorough user research. The structure is clear, covering all essential quadrants with realistic insights. I particularly appreciate the comprehensive context you've included with target audience, research methods, goals, and pains sections. The visual presentation is clean and professional. This is really strong work!

Ipek, your empathy map demonstrates a thoughtful approach to understanding the needs and challenges of budget-tracking app users. It's a valuable tool that provides deep insights into their pain points and aspirations, which can significantly influence the design process.
Here are some suggestions to further enhance your work:
1. Visual Presentation:
- The current black-and-white format of the empathy map lacks visual clarity and makes it difficult to distinguish between the different sections (Says, Thinks, Does, Feels). Using colour to differentiate these sections significantly improves readability and makes the information easier to digest. Consider using icons or simple illustrations to visually represent key emotions or actions. This would add visual interest and make the map more engaging.
- Remember, Uxcel provides a helpful Empathy Map template that you can leverage to create a more visually appealing and structured map. This template is designed to enhance the readability and structure of your map, making it easier for you to communicate your insights effectively.
2. Content Refinement:
- Provide more context: Expand on the target audience details by including information about their financial situations (income level, debt), specific budgeting goals (saving for a house, paying off debt), and technology preferences (mobile vs. desktop, preferred apps).
- Elaborate on research methods: To add credibility to your insights, describe the sample size of your survey, the specific questions asked, and any notable findings from the competitive analysis.
- Explore root causes: Investigate the underlying reasons behind the identified pain points. For example, why do users struggle to stick to their budgets? Is it due to a lack of motivation, unclear financial goals, or the complexity of tracking tools? Understanding the "why" behind their struggles will enable you to design more targeted and practical solutions.
3. Additional Tips:
- Consider this as an opportunity to expand your research toolkit and gather more comprehensive data. User interviews, for instance, can provide deeper qualitative insights into user behaviours, motivations, and pain points.
- Use the empathy map to guide design decisions: Refer back to the map throughout the design process to ensure your solutions address the identified user needs and challenges.
Keep up the great work, and happy designing! ✌️
You might also like
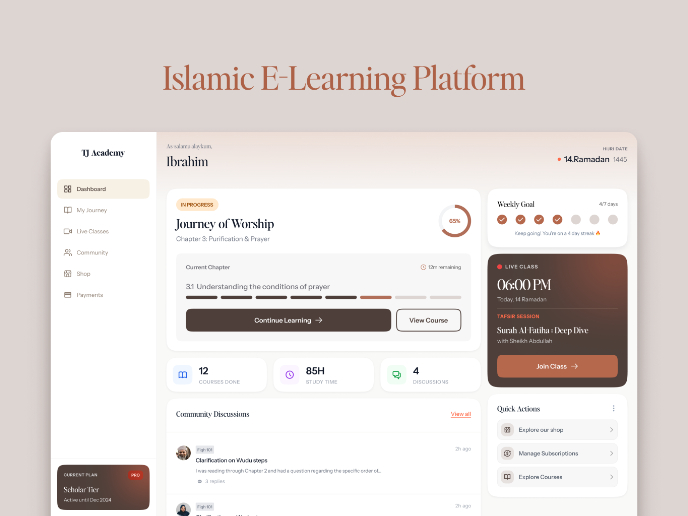
Islamic E-Learning Platfrom Dashboard

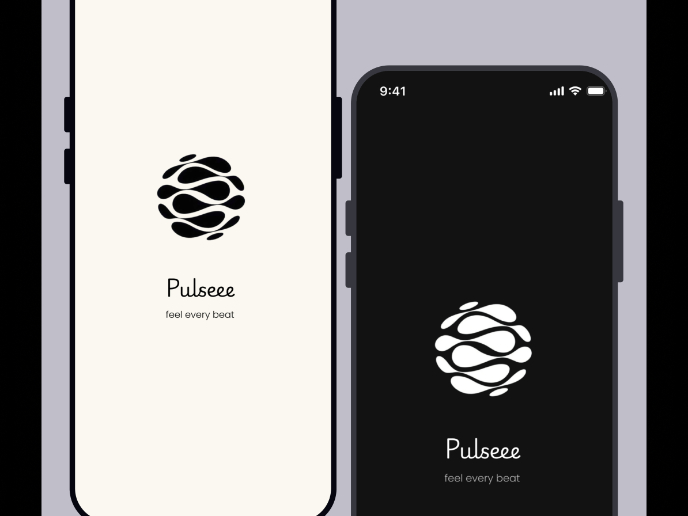
Pulse — Music Streaming App with Accessible Light & Dark Mode

SiteScope - Progress Tracking App

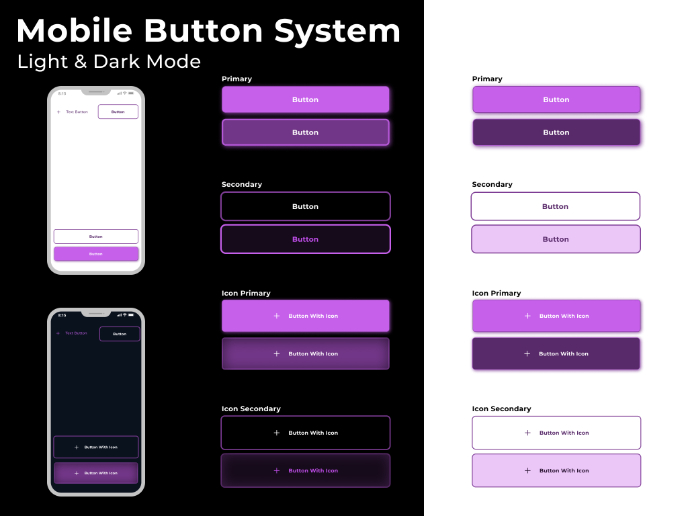
Mobile Button System

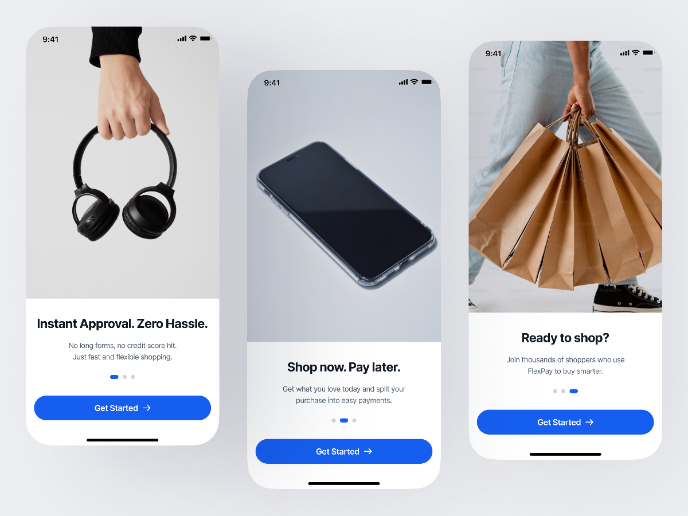
FlexPay

May.Da.Ma Candles & more

Design Leadership Courses

UX Design Foundations


Introduction to Figma

Introduction to Design Systems