Make chart annotations easy to read
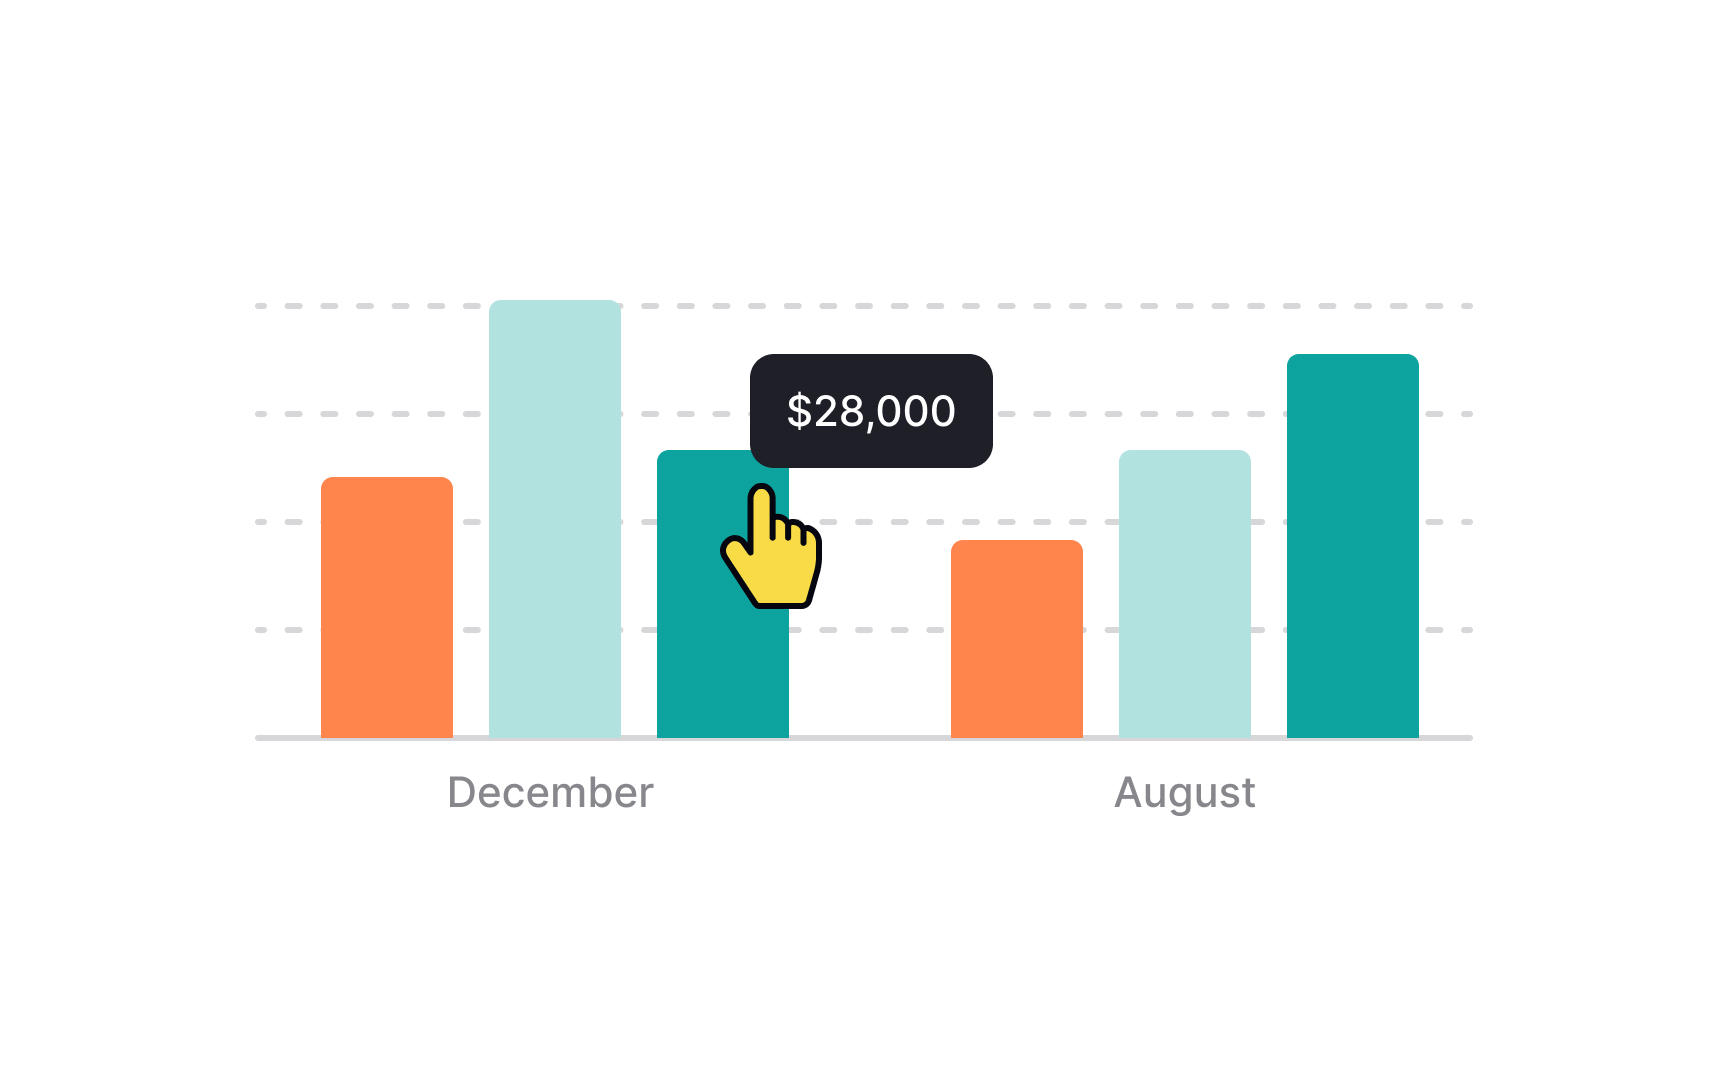
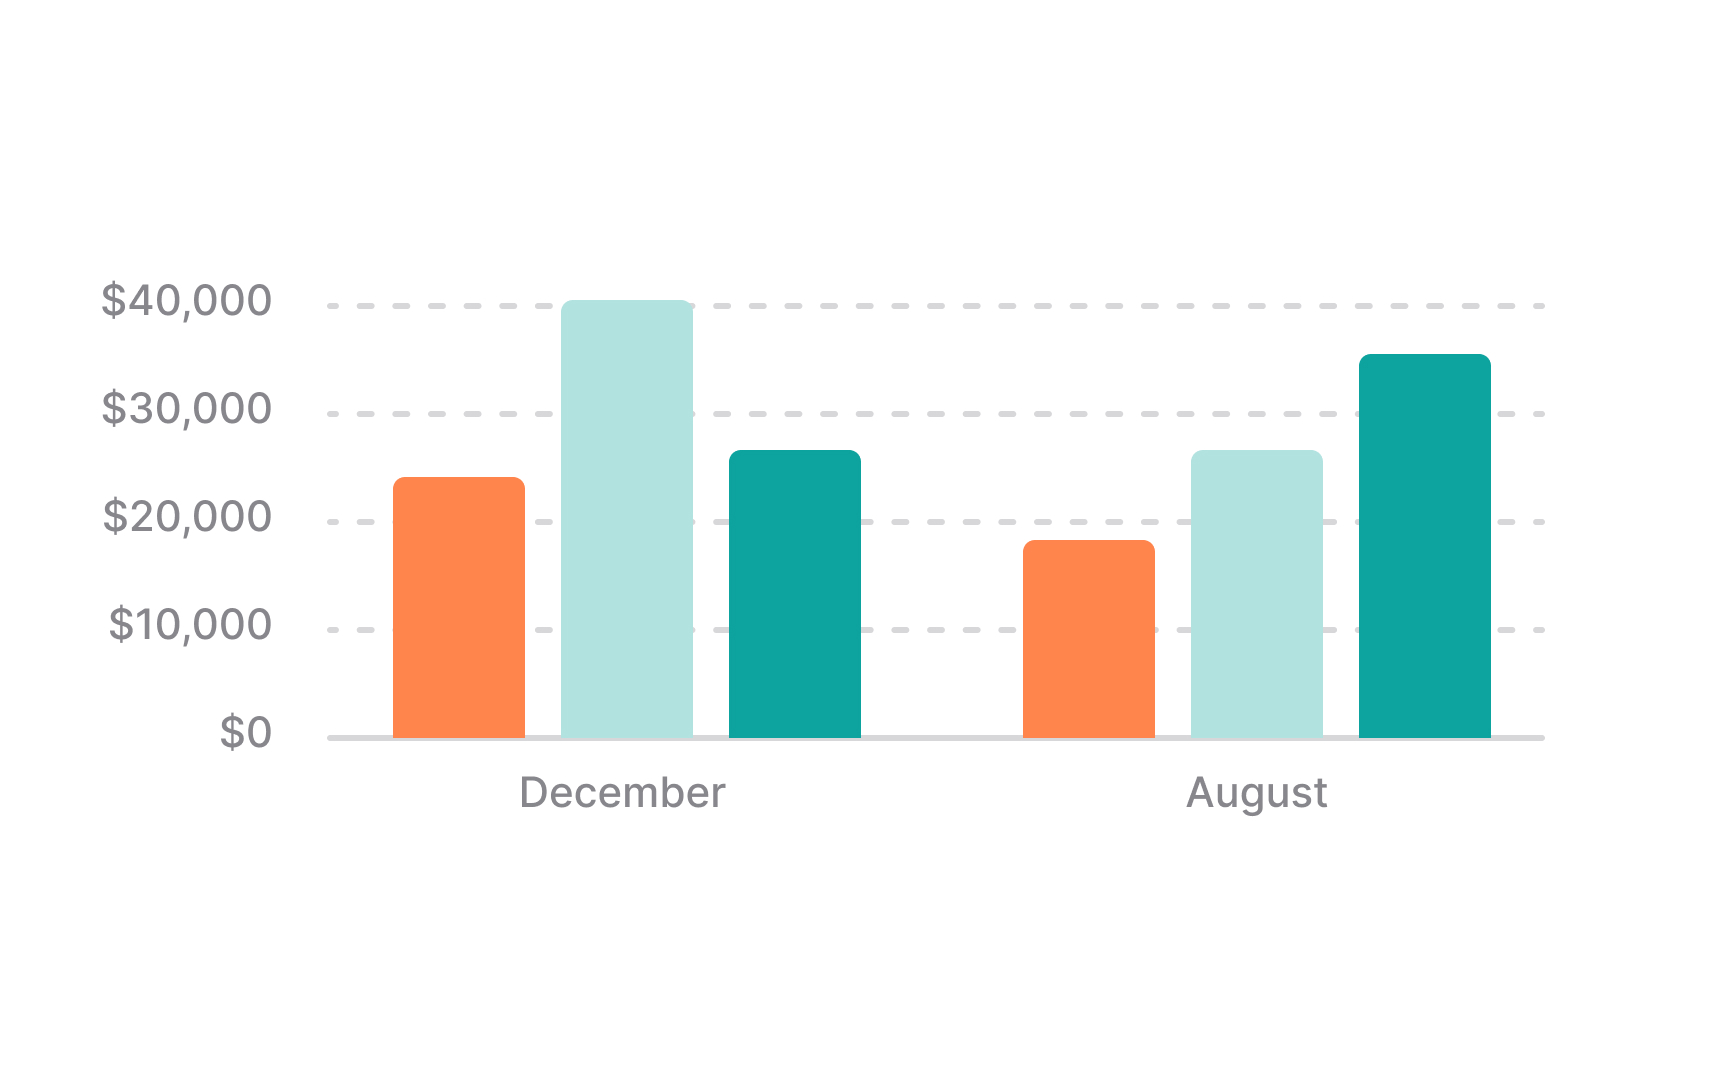
Chart annotations are essential enhancements that add explanatory or supplementary information to a chart, helping to clarify data and emphasize key points.
These include:
- Data labels that provide precise values for data points
- Callouts with arrows or lines that highlight and explain significant data
- Reference lines marking important thresholds or averages
- Text annotations offering additional context
- Legend annotations explaining the meaning of symbols, colors, or patterns.
To ensure these annotations remain readable and effective in your UI, position annotations so they don't overlap with data points or each other, maintaining a clean and organized appearance. Also, keep the language concise to avoid overwhelming users.
