Selecting Effective Product Metrics
Choose the right metrics to connect product success with user value and business goals.
Metrics give product specifications their backbone. Without measurable indicators, even the most detailed requirements can drift away from real impact. Metrics show whether the product is solving user problems, driving engagement, and delivering business value. Yet, tracking everything leads to noise.
Selecting metrics requires focus on what truly matters — the link between outcomes and value. The right metrics help teams understand progress toward goals, justify trade-offs, and decide when to adjust scope. They also create accountability, turning vague expectations into quantifiable results.
This lesson explains how to distinguish actionable metrics from vanity numbers, connect them to the product’s north star, and ensure each metric reflects user and business outcomes. From defining success criteria in specs to structuring measurable goals, it shows how well-chosen metrics make every product requirement purposeful and trackable.

A good product specification defines what success looks like. Translating objectives into measurable results brings clarity to both the problem and the expected outcome. Instead of describing a goal like “improve onboarding”, a measurable specification would set a concrete target such as “increase onboarding completion rate by 15% within 3 months.”
This shift makes the objective actionable. It helps every team see how their work contributes to the result and gives a clear reference for evaluation. To make objectives measurable, identify the user behavior that represents success, define how it can be tracked, and choose a realistic timeframe. A well-phrased metric bridges qualitative intent and quantitative proof. When goals are measurable, specifications become decision tools rather than wish lists, guiding teams toward accountable and testable outcomes.[1]
Different metrics reveal different truths about a product. In product specifications, they serve as measurable checkpoints that connect user experience with business outcomes. To select the right ones, it helps to understand the main categories most teams rely on:
- Acquisition metrics show how new users find and start using the product. They include indicators like sign-up rate or cost per acquisition.
- Engagement metrics reflect how actively users interact with features, such as session frequency, time spent, or completed actions.
- Retention metrics measure loyalty by tracking how many users return and how often.
- Revenue metrics reveal financial performance through values like lifetime value (LTV), average revenue per user (ARPU), or recurring revenue.
- Satisfaction metrics capture user sentiment using signals such as Net Promoter Score (NPS) or customer effort score.
Each type serves a specific purpose in specifications. A new feature might rely on engagement and retention metrics, while an
Not all numbers reveal real progress. Vanity metrics look impressive but fail to inform meaningful decisions. They often track activity instead of impact: downloads instead of
To avoid them, focus on metrics that show a clear
Pro Tip: When choosing metrics, replace ‘how many?’ with “how well?’. Measure value, not volume.
Every product needs a single guiding metric that reflects its core value. The north star captures the moment users experience real benefit and shows whether the product is moving in the right direction. A good north star metric is measurable, time-bound, influenced by multiple teams, and directly tied to the value proposition.
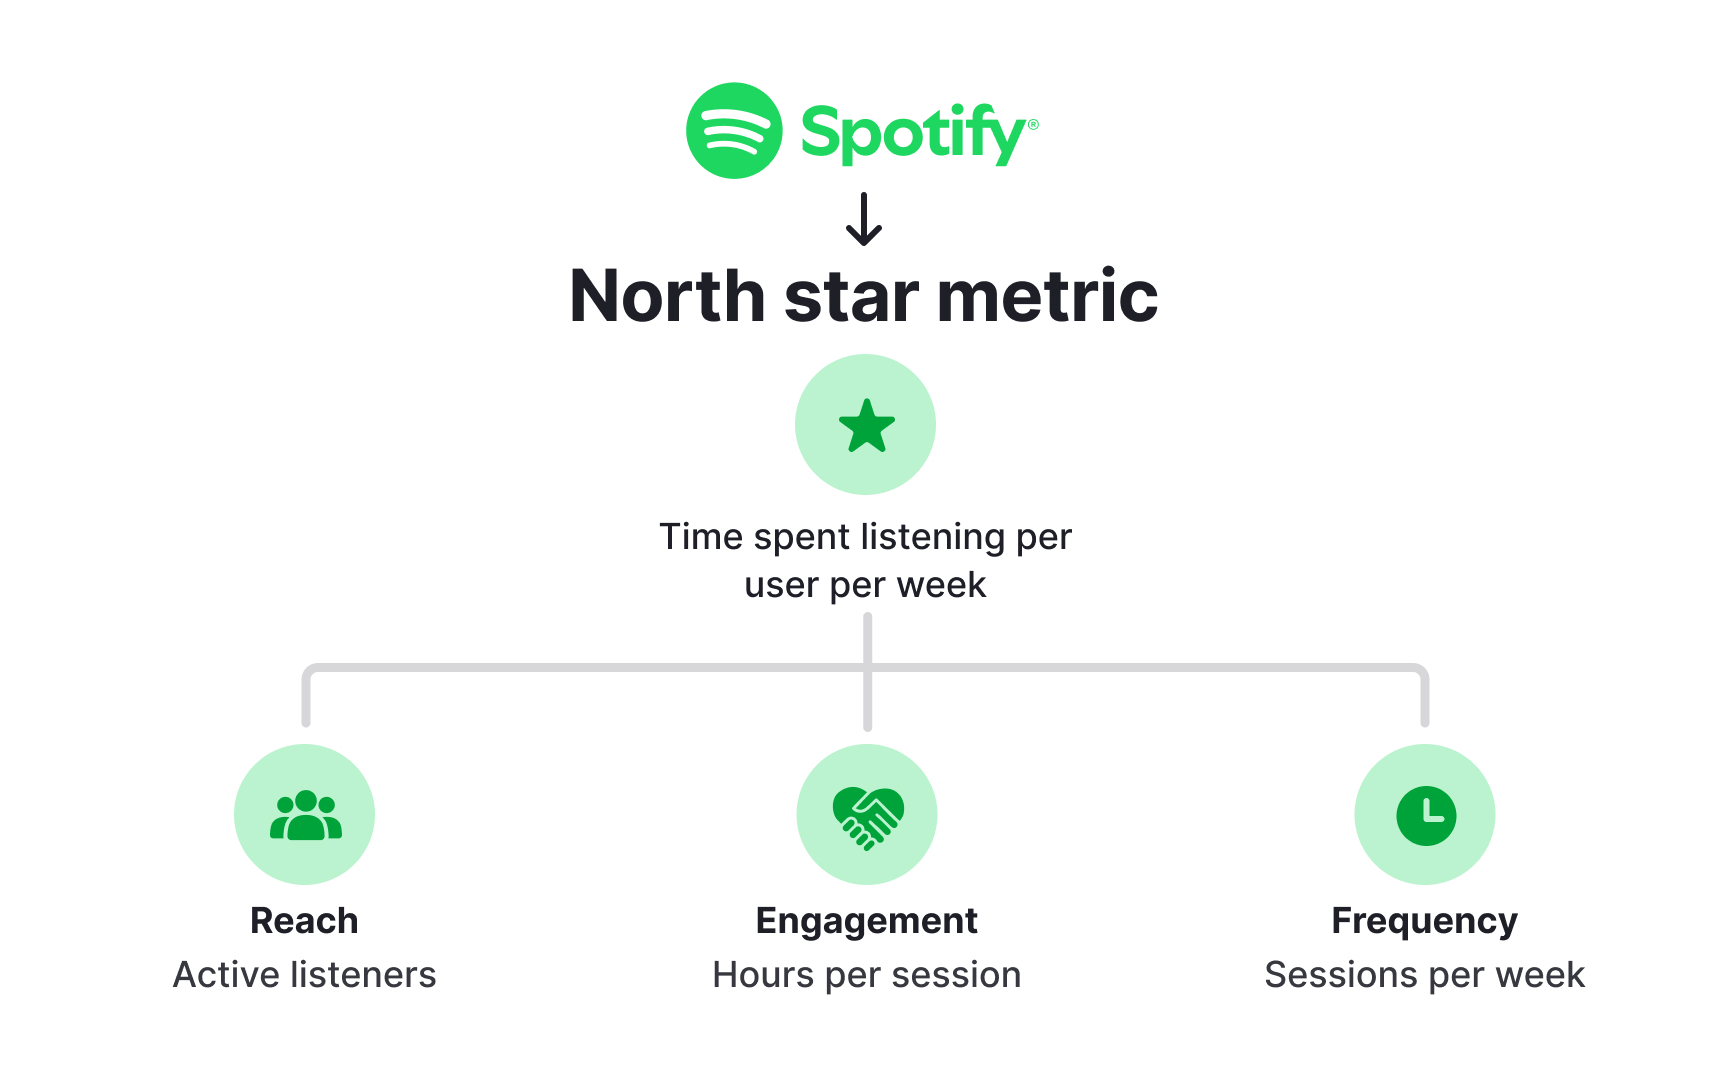
For example, Uber Eats could measure the number of successfully delivered and positively rated orders per week, not just total orders placed. This metric connects user satisfaction with company growth. Spotify might track time spent listening per user per week, which reflects both engagement and content relevance.
When writing specifications, defining or referencing the north star metric keeps priorities focused. It prevents teams from optimizing isolated tasks and ensures every feature and improvement contributes to a shared definition of success.[2]
Pro Tip: Choose one north star metric that every team can influence. It should unite product efforts rather than separate them.
While the north star metric captures the product’s overall value, it cannot work in isolation. Supporting metrics make it actionable by showing what drives or slows progress toward that main goal. These usually fall into two levels:
- Primary metrics (L1) directly influence the north star and help teams understand which levers matter most. For example, if Spotify’s north star is time spent listening per user per week, an L1 metric could be hours per session because it reflects how engaged listeners are during each visit.
- Supporting metrics (L2) track earlier signals and help spot issues before they escalate. In Spotify’s case, L2 metrics might include playlist saves or session starts per week, since both hint at future engagement.
When these smaller metrics move, they eventually affect the north star. Mapping this connection helps teams see how their daily work contributes to shared outcomes and keeps specifications tied to measurable progress.
Choosing the right metrics depends on the stage of the product, the company’s priorities, and the specific goal each specification addresses. Early-stage products might focus on activation and engagement, while mature products may prioritize
- What outcome defines success for this feature or initiative?
- Which user behavior best represents that outcome?
- How can it be measured consistently over time?
For example, an
Pro Tip: When in doubt, trace each metric back to a business goal. If the link feels weak, replace it with one that reflects real progress.
Once metrics are tracked, interpreting them correctly is just as important as selecting them. A single number rarely tells the full story. Segmenting data helps reveal hidden patterns that explain why a metric changes. For example, a drop in engagement might only affect new users, or high
When writing

Selecting the right analytics tools is essential for turning data into insight. Product teams rely on tracking platforms to collect usage data, visualize patterns, and monitor progress against goals defined in specifications. The best tools are those that align with the metrics you plan to track and can integrate with your existing workflow.
Platforms like Mixpanel, Amplitude, and Google Analytics specialize in tracking user flows and event data. Tools such as FullStory and Heap help visualize the user journey through session recordings and heatmaps.
Pendo and Gainsight offer strong capabilities for in-app surveys,
When choosing one, consider such criteria as:
- Features
- Integration options
- Pricing
- Ease of use
- Scalability
The goal is not to collect endless data but to focus on what helps teams act faster and validate assumptions. Linking analytics dashboards to metrics listed in


Similar lessons

Introduction to Churn Metrics and Analysis

Common Causes of Customer Churn
