Influence Through Data
Simplify organizational decision-making by leveraging metrics that tell compelling stories and drive alignment
Behind every metric lies an opportunity to influence, align, and inspire action. When teams embrace data-driven approaches, they move beyond the limitations of opinion-based decisions and tap into insights that everyone can see and understand. Think of metrics as a universal language that bridges gaps between departments and hierarchies. They create those "aha!" moments where priorities suddenly become crystal clear.
Well-crafted metrics cut through the noise of subjective debates, building trust even among the most skeptical stakeholders. By connecting data points to organizational priorities, you don't just track performance; you shape the conversation, secure buy-in for your initiatives, and steer the direction of entire teams. Knowing how to leverage metrics for influence is an essential skill in a world overflowing with information.
Data-driven decisions consistently outperform those based solely on intuition or experience. When teams rely on carefully collected metrics, they escape the trap of confirmation bias, our natural tendency to favor information that supports existing beliefs. Objective measurements create a level playing field where the strength of evidence matters more than the loudest voice in the room. This is particularly valuable when addressing complex problems with multiple variables or when stakeholders hold opposing viewpoints.
Organizations that embrace data-driven cultures typically see 3x better decison-making improvements than their competitors.[1] However, keep in mind that the key lies not in collecting more data, but in identifying the right metrics that directly connect to business outcomes and using them consistently in decision-making processes.
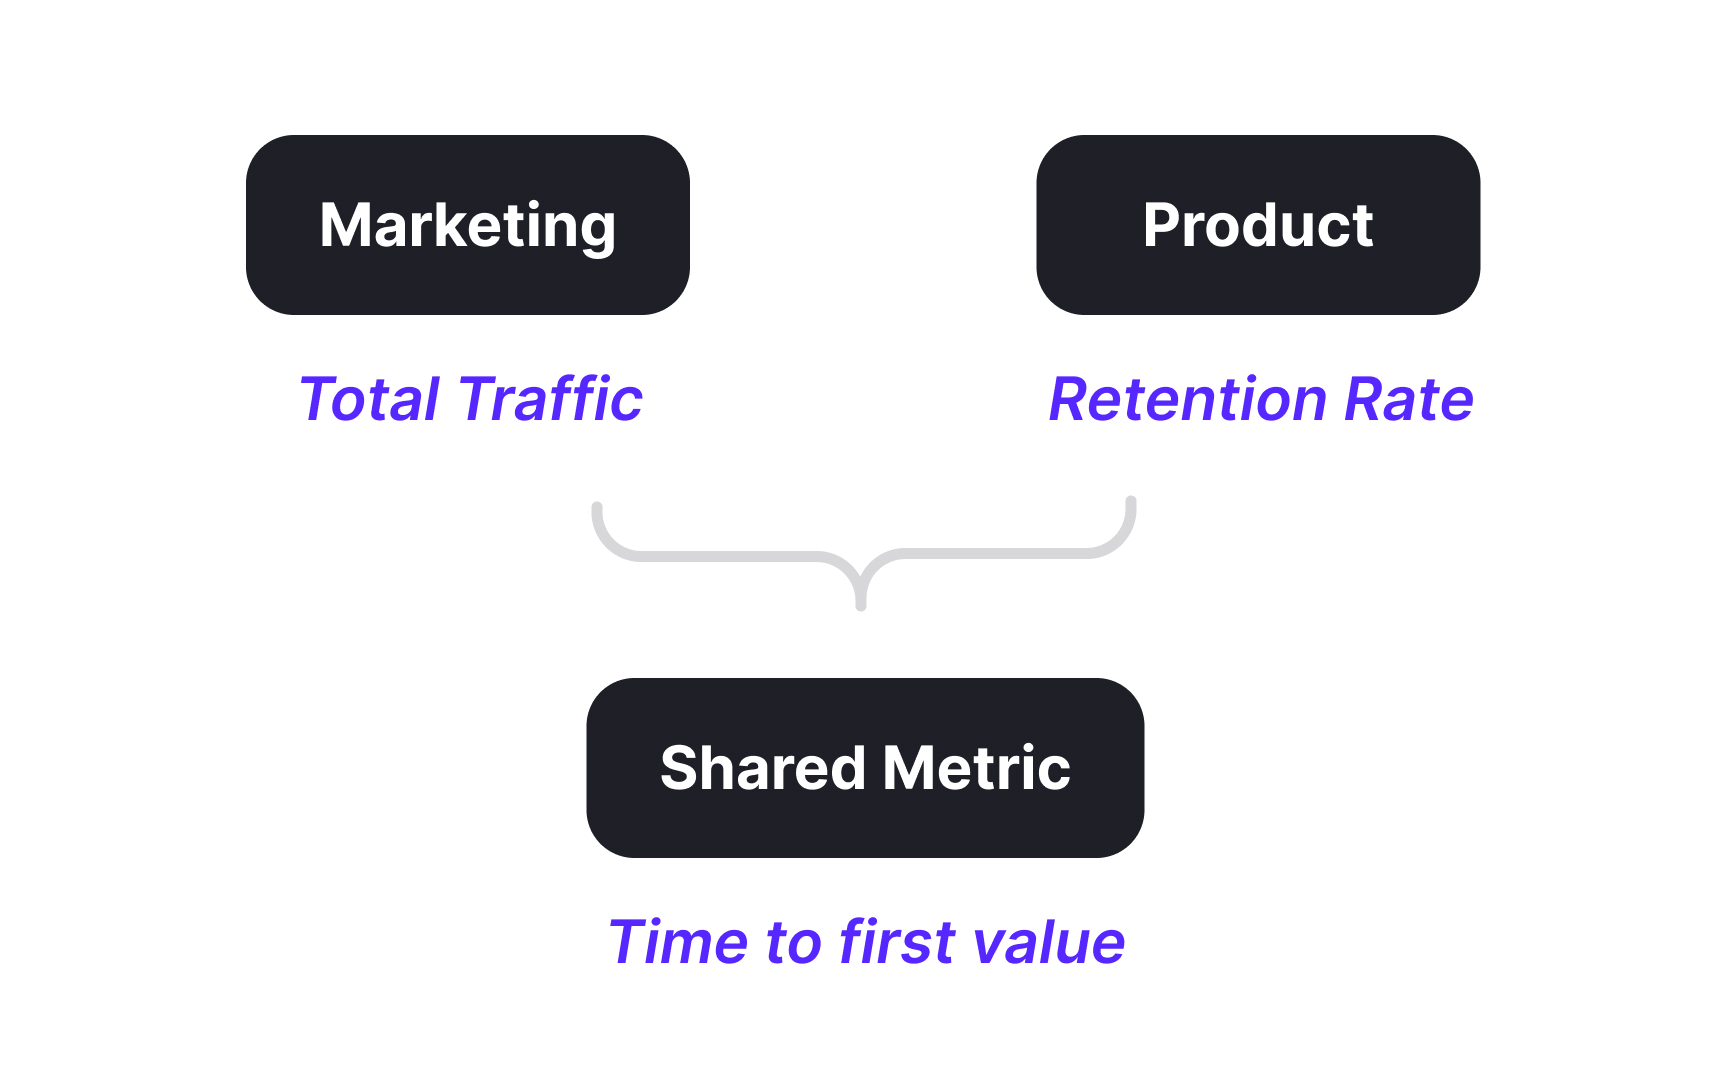
When teams operate with different definitions of success, misalignment is inevitable. For instance, a marketing team might celebrate increased traffic while the product team worries about declining engagement metrics, creating unnecessary tension and competing priorities.
Shared metrics bridge these gaps by establishing a common reference point.[2] In the example above, the company above may unify its departments by focusing everyone on "time to first value," how quickly new users achieved their first meaningful outcome. This metric can help marketing attract qualified leads, guided product design decisions, and informed customer support training.
The power of common metrics lies in their ability to translate abstract goals into concrete targets that everyone understands. They transform discussions from subjective preferences ("I think users want this feature") to objective evaluations ("This feature reduced time to first value by 22%"), making collaboration more productive and less emotionally charged.
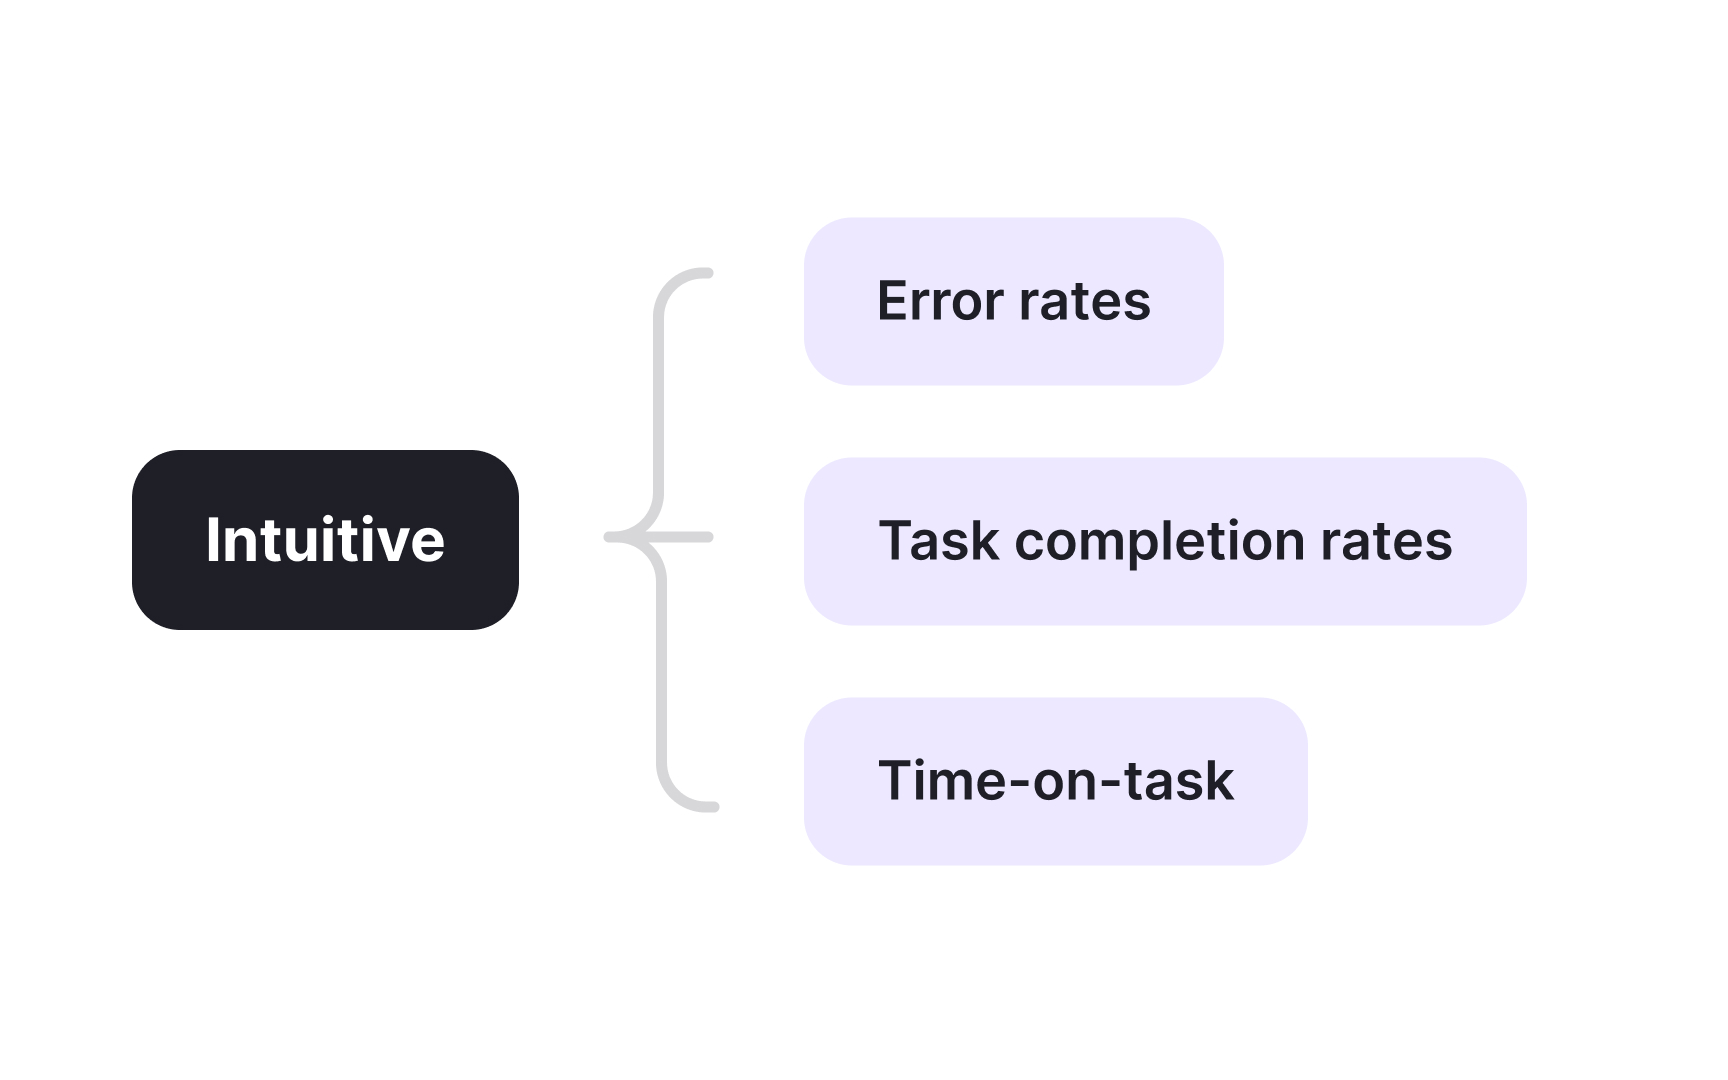
Subjective discussions often circle endlessly without resolution. For example, a team might debate whether a new interface is "intuitive" or "confusing" based solely on individual impressions, with little progress toward consensus. Transforming subjective qualities into measurable metrics breaks this cycle.
Instead of arguing about interface intuitiveness, teams can measure task completion rates, time-on-task, or error rates. When someone makes a subjective claim, respond with "How might we measure that?" to gently guide the conversation toward observable evidence. This shift to objective criteria doesn't eliminate judgment; it simply grounds it in observable reality.
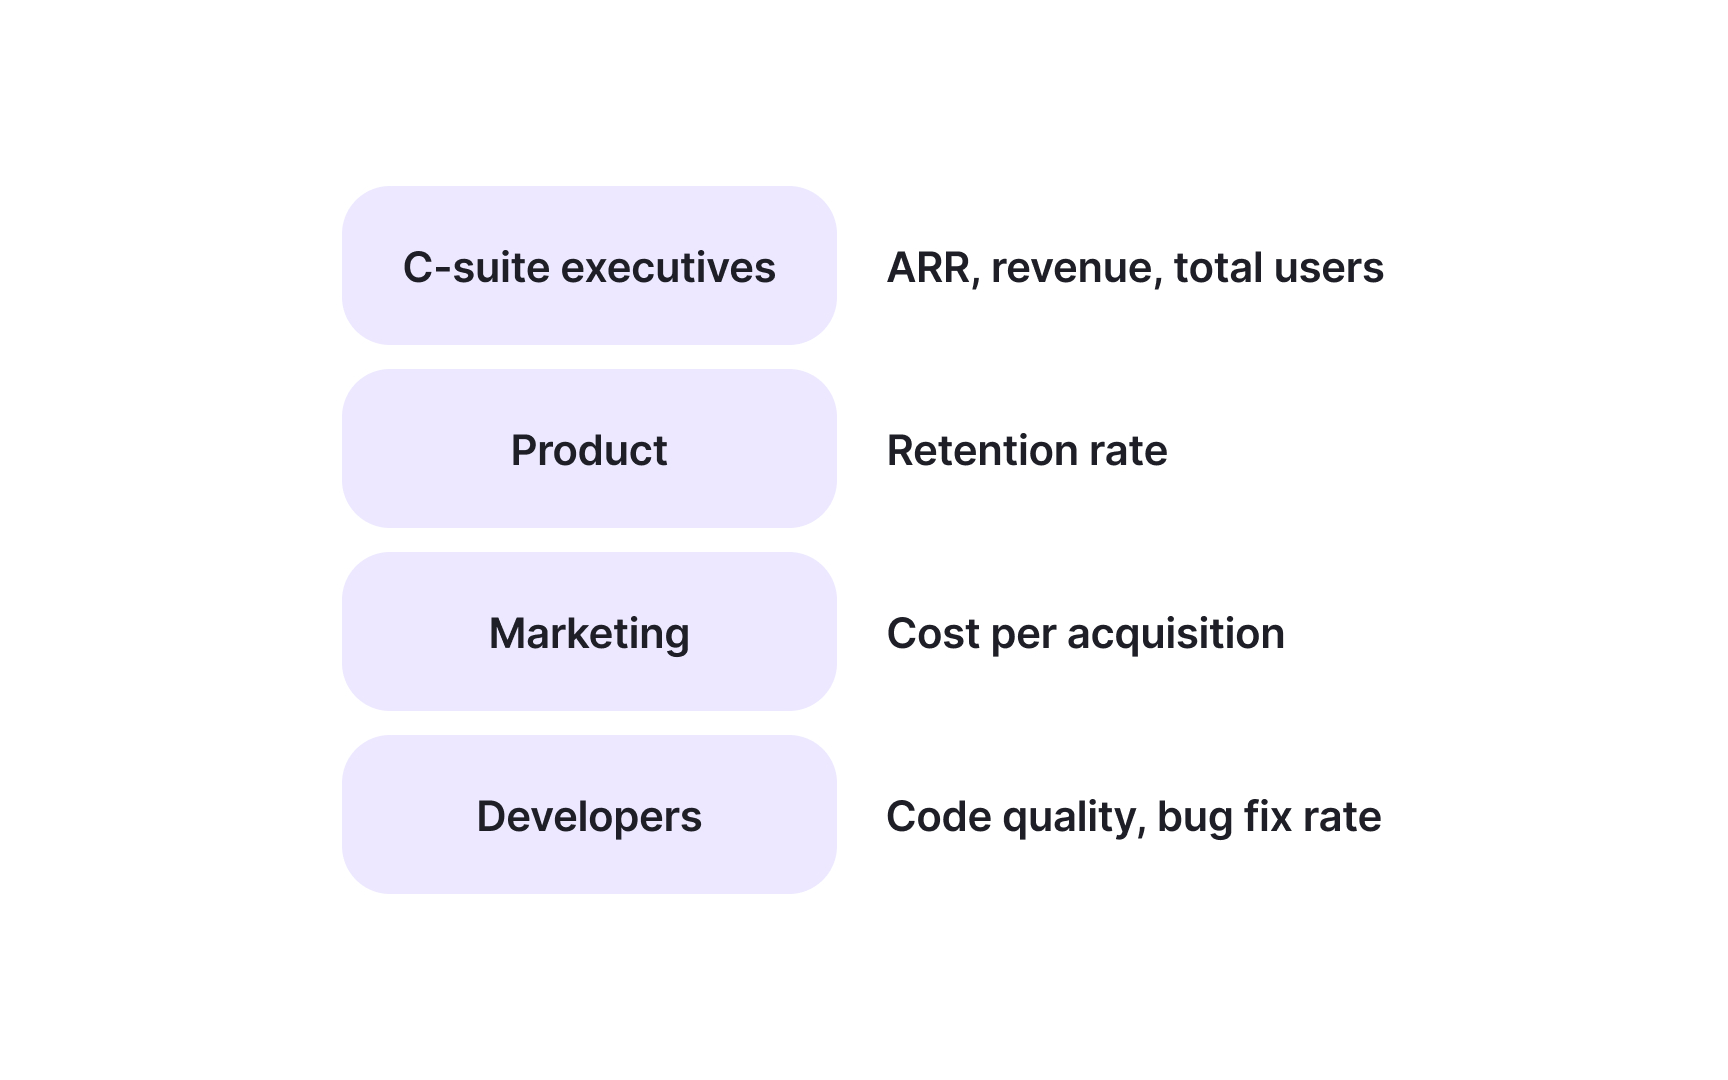
Not all metrics carry equal persuasive weight with different stakeholders. Technical teams might focus on performance metrics while executives respond to business outcomes and designers prioritize user experience indicators.
Effective persuasion requires matching metrics to your audience's priorities and values. Before presenting data, ask: "What does this person or team care about most?" The most persuasive metrics create clear connections between actions and outcomes. They demonstrate not just what happened but why it matters to the specific stakeholder. This is far more effective than overwhelming audiences with comprehensive dashboards or focusing solely on metrics that you personally find compelling.
Pro Tip: Create stakeholder profiles that list the top metrics each key decision-maker cares about most, and customize your data presentations accordingly.
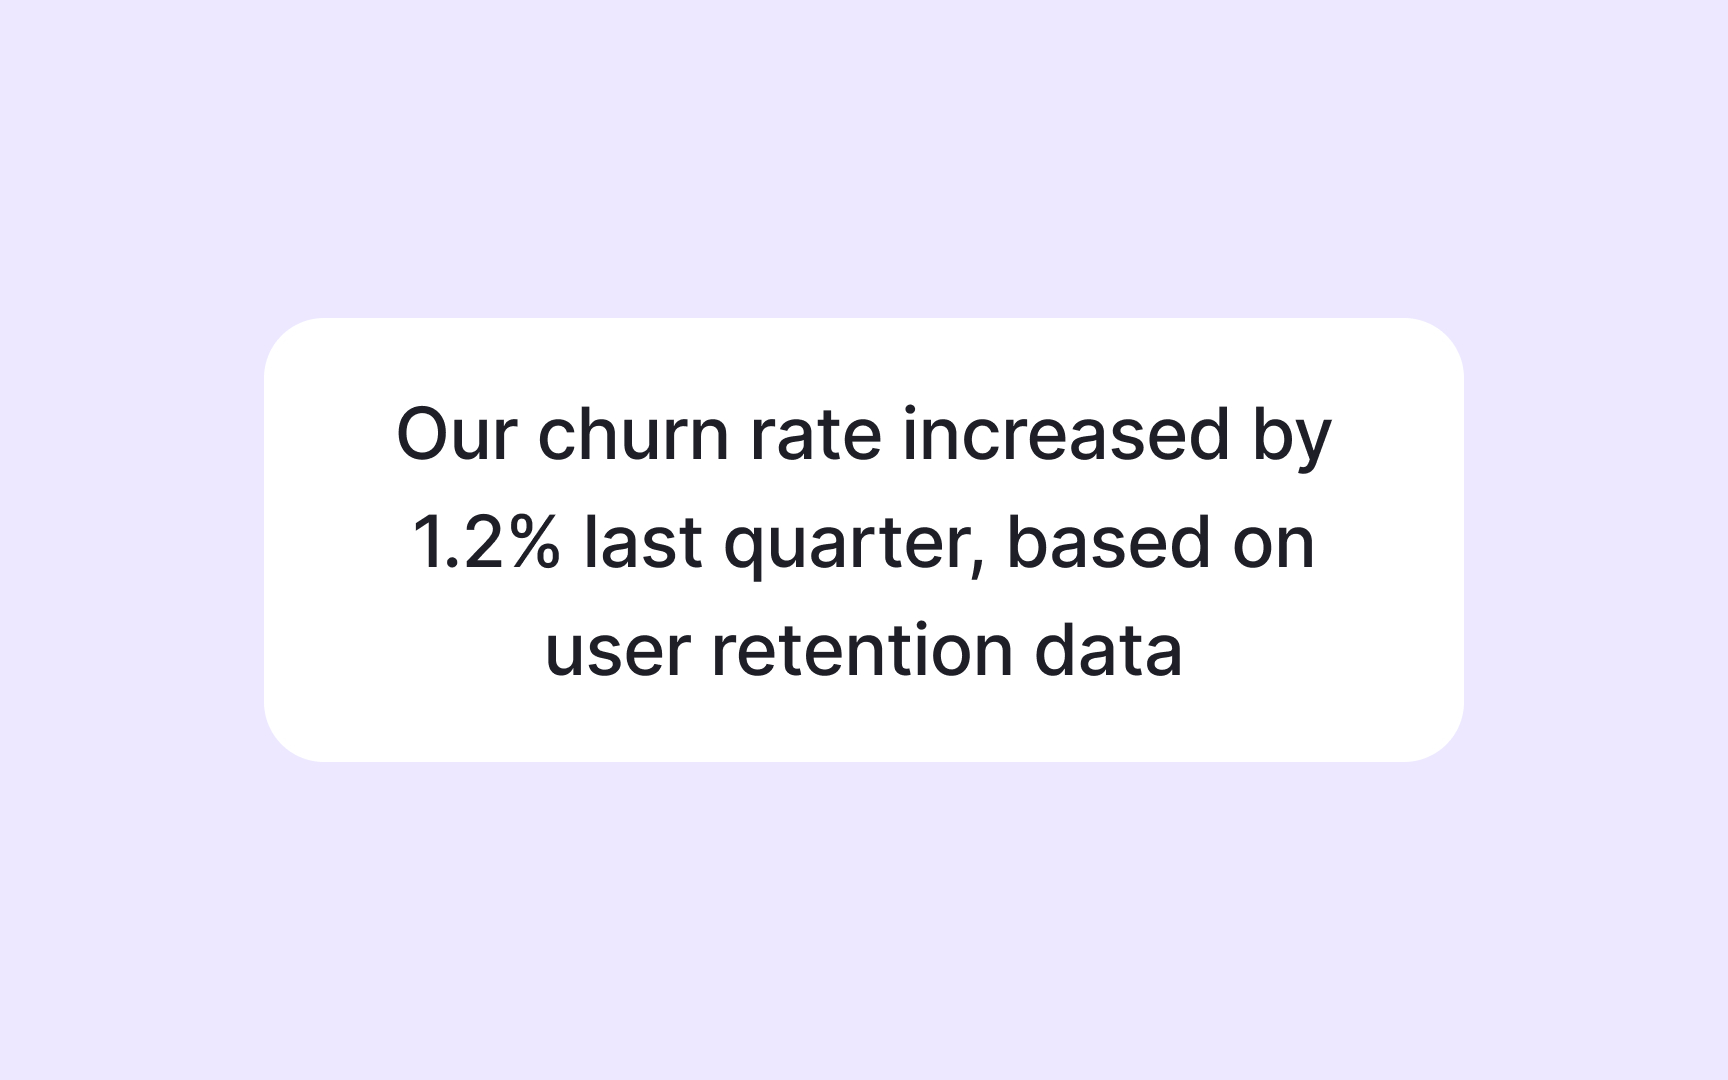
Raw numbers rarely inspire action on their own. A conversion rate drop from 5.2% to 4.8% might not motivate change, but framing it as "We're losing 2,000 customers and $180,000 monthly" creates urgency.
Effective data storytelling requires 3 elements:
- Context establishes the baseline ("Our conversion rate has been stable at 5.2% for six months").
- Cause identifies potential reasons for changes ("The drop coincided with our checkout page redesign").
- Consequence makes the impact tangible ("At current rates, this represents 24,000 lost customers and over $2 million in reduced annual revenue").
The most compelling data stories connect metrics to human experiences and business outcomes. They help stakeholders visualize the implications behind the numbers, transforming abstract statistics into concrete scenarios that demand attention and inspire action.
Team disagreements often stem from different assumptions about what users want or how features will perform. These debates can become circular and emotionally charged when based solely on opinions.
Metrics provide a neutral arbitration mechanism by creating testable hypotheses. Imagine a product team arguing about the main driver of cart abandonment on their e-commerce platform. One group believes it's the multi-step
This transforms disagreements from interpersonal conflicts into collaborative learning opportunities. The key is agreeing on success metrics before testing, ensuring all parties commit to following the evidence regardless of which position it supports.
Pro Tip: For contentious decisions, have each side predict the expected impact on key metrics before testing. This makes the process more objective and educational.
While tracking metrics shows what happened, influential metrics drive what should happen next. They shift from passive monitoring to active catalysts for organizational change.
Proactive metric usage involves strategically introducing new measurements that spotlight overlooked opportunities. Imagine a
The distinction between tracking and influence lies in intentionality. Tracking metrics passively record outcomes of decisions already made, while influential metrics actively shape future decisions by illuminating blind spots and uncovering hidden value. This helps expand organizational focus beyond established priorities to emerging opportunities.
Many critical business factors seem inherently qualitative and resistant to measurement: user satisfaction, design quality, team collaboration effectiveness, or brand perception. Converting "unmeasurable" concepts into measurable indicators requires creative proxy identification. Imagine a product team wanting to measure the abstract concept of "user trust." Rather than declaring it unmeasurable, they could track multiple proxies: willingness to share personal information, permission opt-in rates, feature adoption speed, and support ticket sentiment. While no single metric perfectly captures trust, the combination creates a meaningful trust index that responds to product changes.
The most sophisticated organizations build measurement frameworks for seemingly intangible concepts by combining direct indicators (surveys, ratings) with behavioral signals (completing profile information, enabling security features, recommending to friends, etc.). While perfect measurement may be impossible, actionable approximation is almost always achievable.
References
- The Advantages of Data-Driven Decision-Making | HBS Online | Business Insights Blog
Topics
From Course

Share


Similar lessons

Introduction to Churn Metrics and Analysis

Common Causes of Customer Churn
