How to Ask Good Data Questions
Learn how to ask the right questions to unlock the true story hiding in your raw data
Good data questions are the secret weapon that turns confusing numbers into clear insights. Starting simple is actually more powerful than diving into complex analysis right away. When you develop the habit of questioning data thoughtfully, you'll spot patterns others miss and avoid getting trapped by your own assumptions. Think about it, how often have teams jumped to solutions before really understanding the problem? Or created metrics that look impressive but don't actually matter? Learning to ask "Why are we measuring this?" and "What's the story behind these numbers?" transforms how you approach data analysis. This skill helps you cut through the noise, challenge faulty thinking, and get to what really matters. Great questioning doesn't just improve your data literacy. It fundamentally changes how your organization makes decisions, ensuring you're solving real problems rather than just tracking what's convenient to measure.
Data without context is like reading a book starting from the middle. Before diving into charts or spreadsheets, understanding the broader business landscape provides essential framing for any analysis. Context reveals which questions are worth asking and helps interpret what the numbers actually mean.[1]
Some useful questions to ask to bring out the context include:
- What was the original hypothesis here?
- What was the insight that led us to choose this data?
- Why did we do this analysis, what were we hoping to achieve?
- What is the one key insight you see here?
- What other insights have we seen before on this topic?
For example, consider a retail company seeing a 20% drop in website traffic. Without context, this might trigger immediate panic and solutions like redesigning the website. However, context might reveal this decrease coincides with a strategic pivot to focus on higher-value customers or seasonal patterns that make this decrease expected and even healthy.
Establishing context first prevents the common mistake of finding patterns in data and retrofitting explanations afterward. It ensures your analysis connects to real business problems and keeps everyone on the same page.
Hypothesis-driven questions transform vague curiosity into focused inquiry with testable assumptions. Instead of open-ended questions like "What's happening with user engagement?", hypothesis questions make specific predictions: "Will reducing our sign-up form from 8 fields to 3 increase completion rates by 30%?"
Strong hypothesis questions include 4 key elements:
- The variable being tested
- The expected outcome
- The magnitude of change
- The reasoning behind your prediction
For example: "If we move the CTA button above the fold (variable), conversion rates will increase (outcome) by at least 15% (magnitude) because users will see it without scrolling (reasoning)." When forming a hypothesis, also explicitly state both what you expect to see and what would disprove your theory, as this helps reduce confirmation bias.
Simple questions often yield more valuable insights than complex ones. Starting with fundamental inquiries establishes clarity before advancing to sophisticated analysis. These basic questions help everyone align on what matters most in the data.
Here are some simple but powerful questions to ask at different stages:
- When investigating anomalies: "Is this a real change or a measurement error?" or "When exactly did this pattern begin?"
- When exploring opportunities: "What is the single most important metric here?" or "Where are users experiencing the most friction?"
- Before running a test: "What specific hypothesis are we testing?" or "What would make us completely reject our hypothesis?"
- After completing a test: "What surprised you about this data?" or "Does the impact differ across user segments?"
Many organizations jump too quickly into statistical complexity, missing fundamental insights visible through simpler inquiry. By starting with basic questions, you create a shared understanding that makes complex analysis more relevant and actionable when you eventually get there.
A questioning framework provides structure to your data inquiry process, ensuring comprehensive analysis and preventing oversight of critical factors. Without a framework, teams often ask inconsistent questions that miss important perspectives.
Effective questioning frameworks include:
- Context questions: "What business goal does this data relate to?"
- Data validation questions: "How was this data collected and what might be missing?"
- Pattern identification questions: "What trends or anomalies do we see?"
- Causation questions: "What factors might explain these patterns?"
- Implication questions: "What does this mean for our decisions?"
Create a personal checklist of 5-7 standard questions you ask in every data discussion, then customize it with project-specific questions.
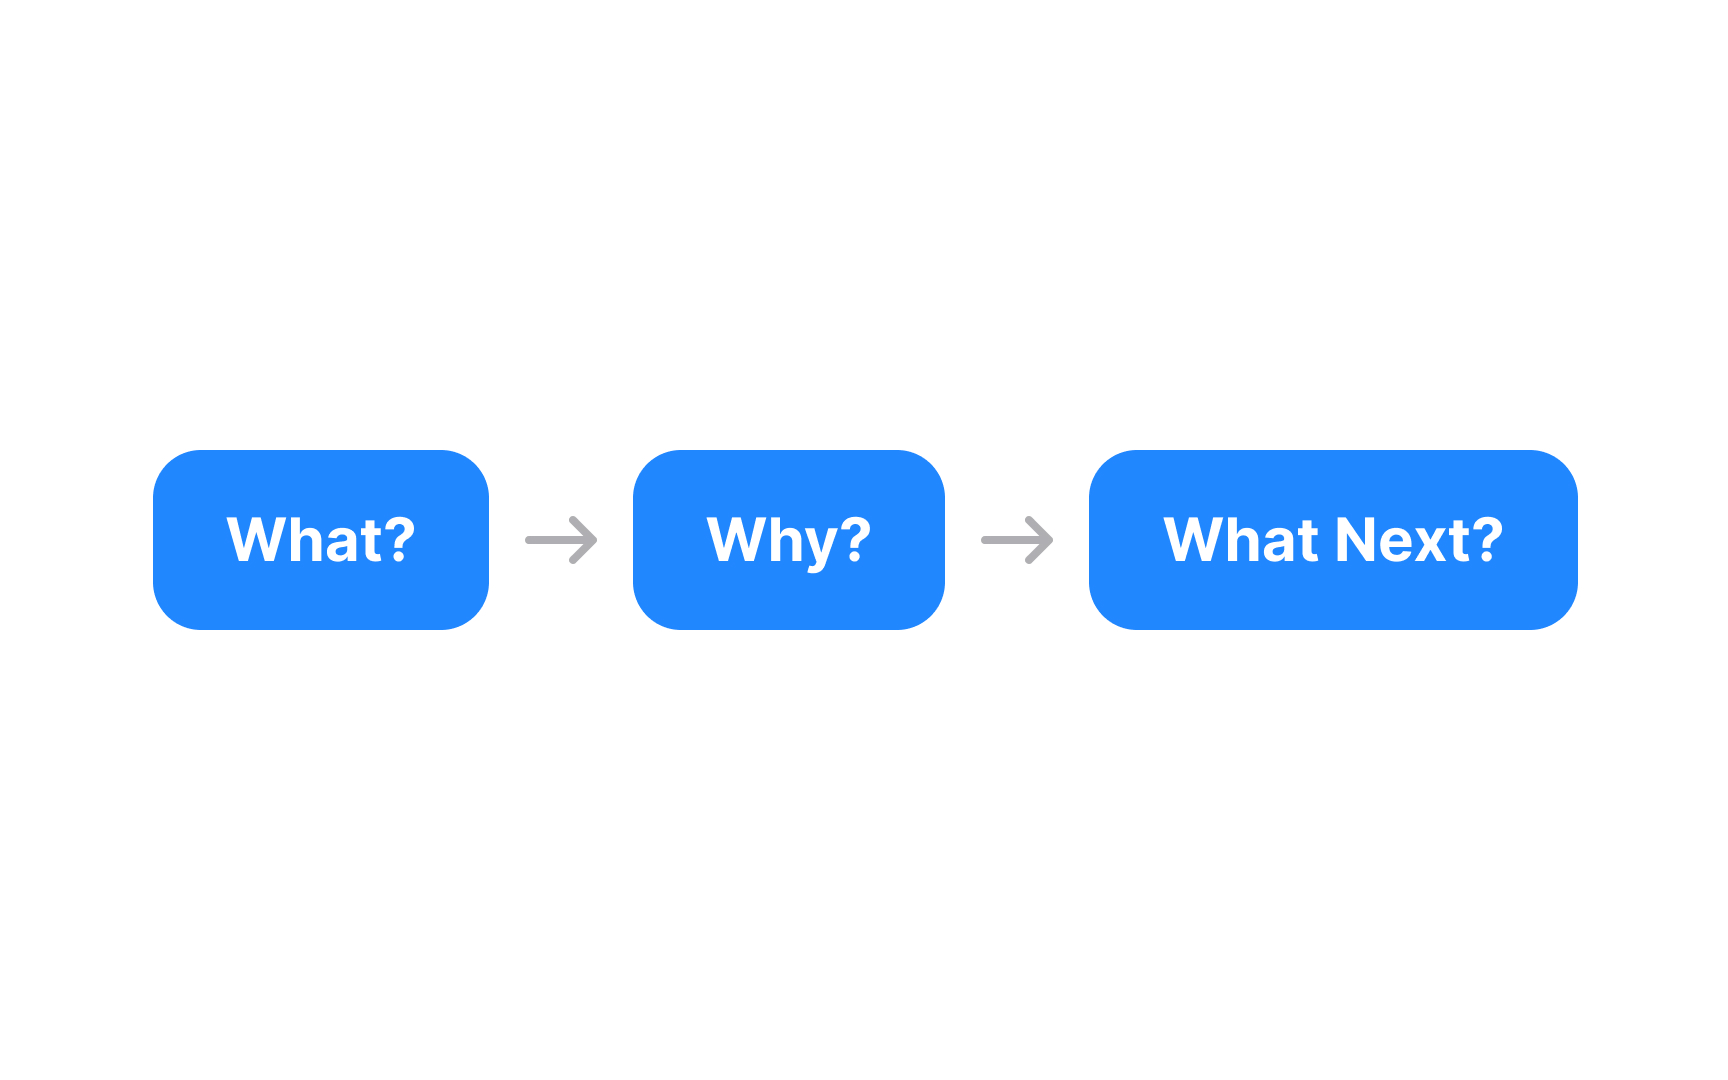
Within your questioning frameworks, ensure this sequence:
- What questions identify patterns: "What metrics are trending up or down?"
- Why questions explore causation: "Why did our
conversion rate drop after the latest update?" - What next questions drive action: "What should we do differently based on these insights?"
Moving through this sequence prevents the common mistake of jumping straight to solutions before understanding root causes. For example, when seeing declining user engagement, resist immediately asking "Should we redesign the interface?" Instead, first understand what's happening and why before determining appropriate responses.
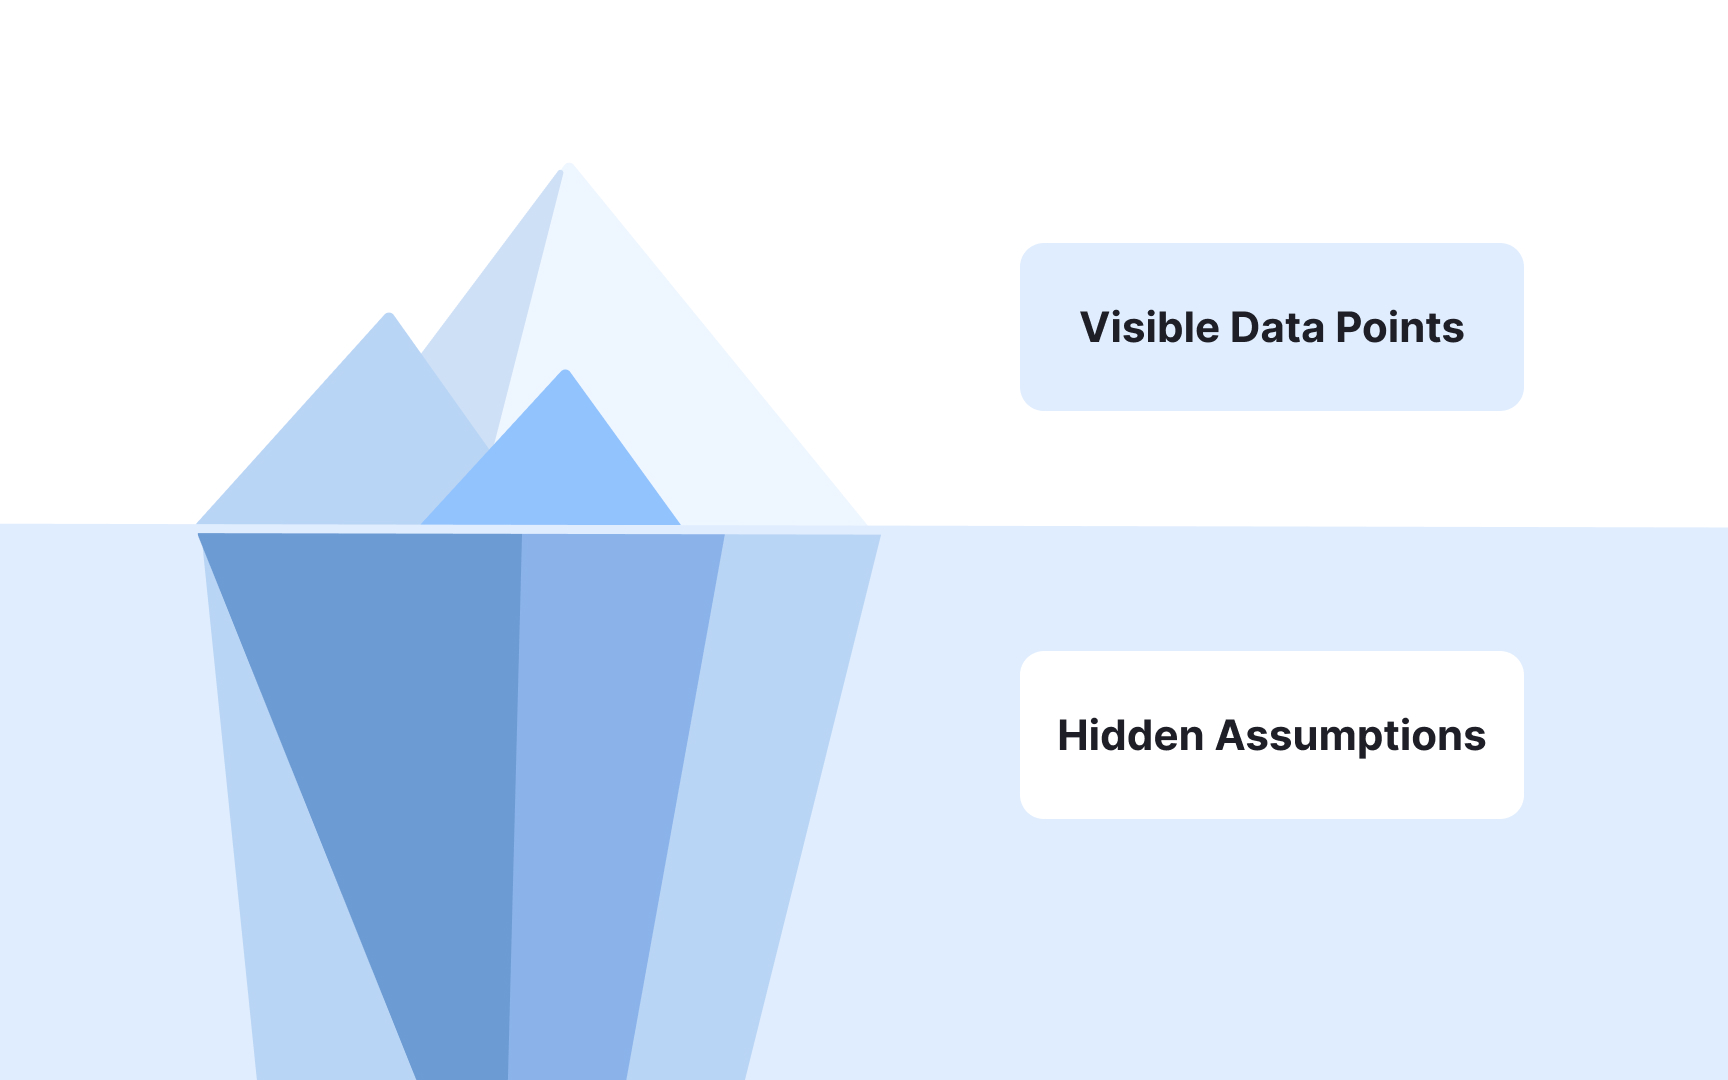
Most data interpretations are built on unstated assumptions that can significantly skew conclusions. The best analysts deliberately question these assumptions to validate their findings and prevent misleading conclusions.
Key assumptions to challenge in any data analysis include:
- Correlation implies causation (it rarely does)
- The metrics actually measure what we think they measure
- The sample represents the entire population accurately
- Historical patterns will continue in the future
- All relevant variables have been considered
For example, a rising
Certain patterns in data discussions consistently indicate analytical issues that may compromise decision quality. Learning to recognize these indicators helps teams identify when analysis needs additional scrutiny before conclusions are drawn.
Observable indicators that warrant closer examination include:
- Absence of confidence intervals or statistical significance
- Selective presentation of metrics that support a single narrative
- Conclusions drawn from very small sample sizes
- Metrics disconnected from defined business objectives
- Data presented without contextual information about collection methods
When a presenter fails to address data limitations, fundamental analytical principles are being overlooked. Similarly, presentations showing only supportive data points without addressing contradictory indicators suggest incomplete analysis rather than comprehensive understanding. To tackle this, create a standardized set of methodological questions to ask in every data discussion, regardless of who's presenting or what conclusion is suggested.
Helping colleagues improve their data questioning skills requires tactful guidance rather than direct correction. By modeling effective questioning and gently redirecting discussions, you can elevate the analytical capabilities of your entire team.
Effective techniques for guiding better data questions include:
- Using the Socratic method of asking questions to encourage thinking: "That's interesting. What might be influencing this trend?"
- Reframing vague questions: "When you ask about 'user engagement,' which specific behaviors are most important to understand?"
- Suggesting structure: "Let's first establish what we know about the context before diving into the numbers"
- Introducing alternative hypotheses: "Could there be other explanations for what we're seeing here?"
The most valuable data insights often emerge through iterative questioning rather than one-time analysis. Learning loops create a cycle where answers to initial questions inform more targeted follow-up questions, progressively deepening understanding.
Effective learning loops follow this pattern:
- Begin with broad exploratory questions to establish baseline understanding
- Use answers to identify specific areas requiring deeper investigation
- Formulate more precise questions targeting those areas
- Analyze patterns across multiple question-answer cycles to identify themes
For example, initial analysis might reveal that


