Bubble chart
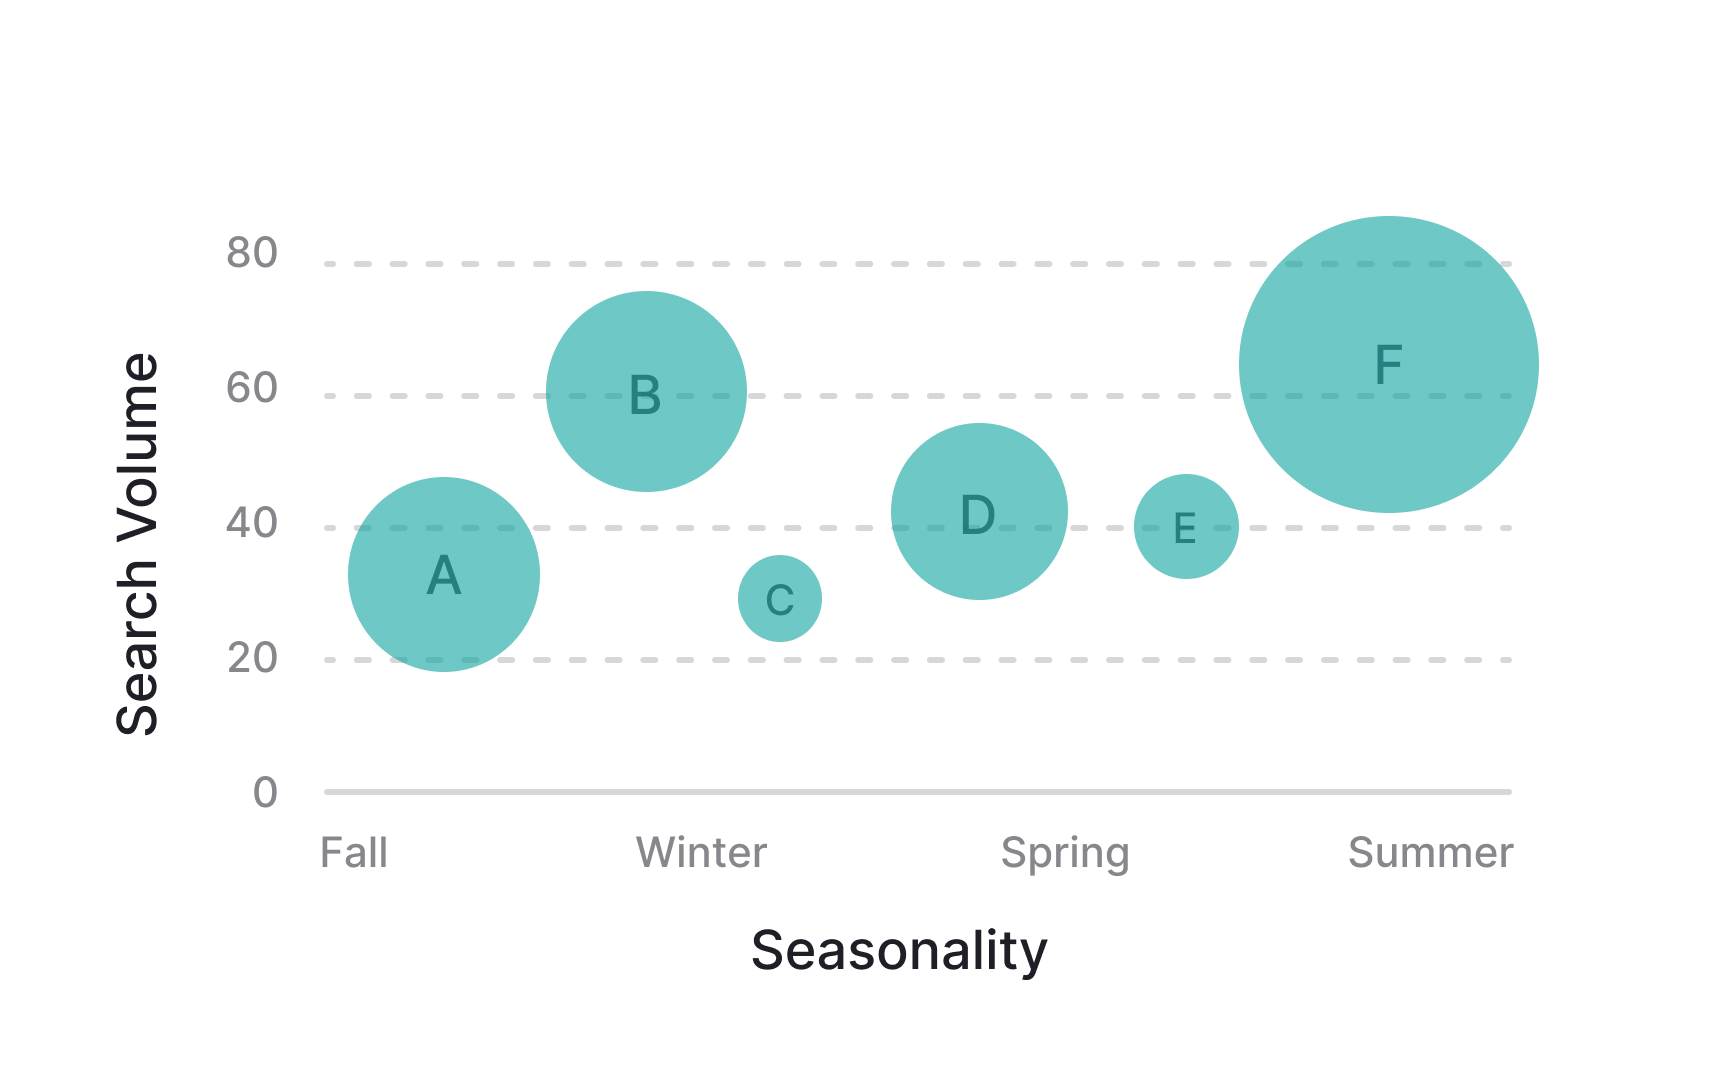
Bubble charts are a unique type of data visualization that look like clusters of bubbles. Each bubble represents a data point with 3 dimensions: its position on the X and Y axes shows two dimensions, and its size represents the third. Sometimes, color or animation adds more dimensions.
These charts are great for visualizing complex relationships between numerical variables. For example, you might use a bubble chart to compare movies by showing their worldwide grosses through bubble size, with the year of release on the X-axis and production budget on the Y-axis.
However, bubble charts can become cluttered and confusing when there is too much data or when the data doesn't fit well into 3 dimensions.
Pro Tip: Always mention in the legend what different bubble sizes mean.
