Chart axes
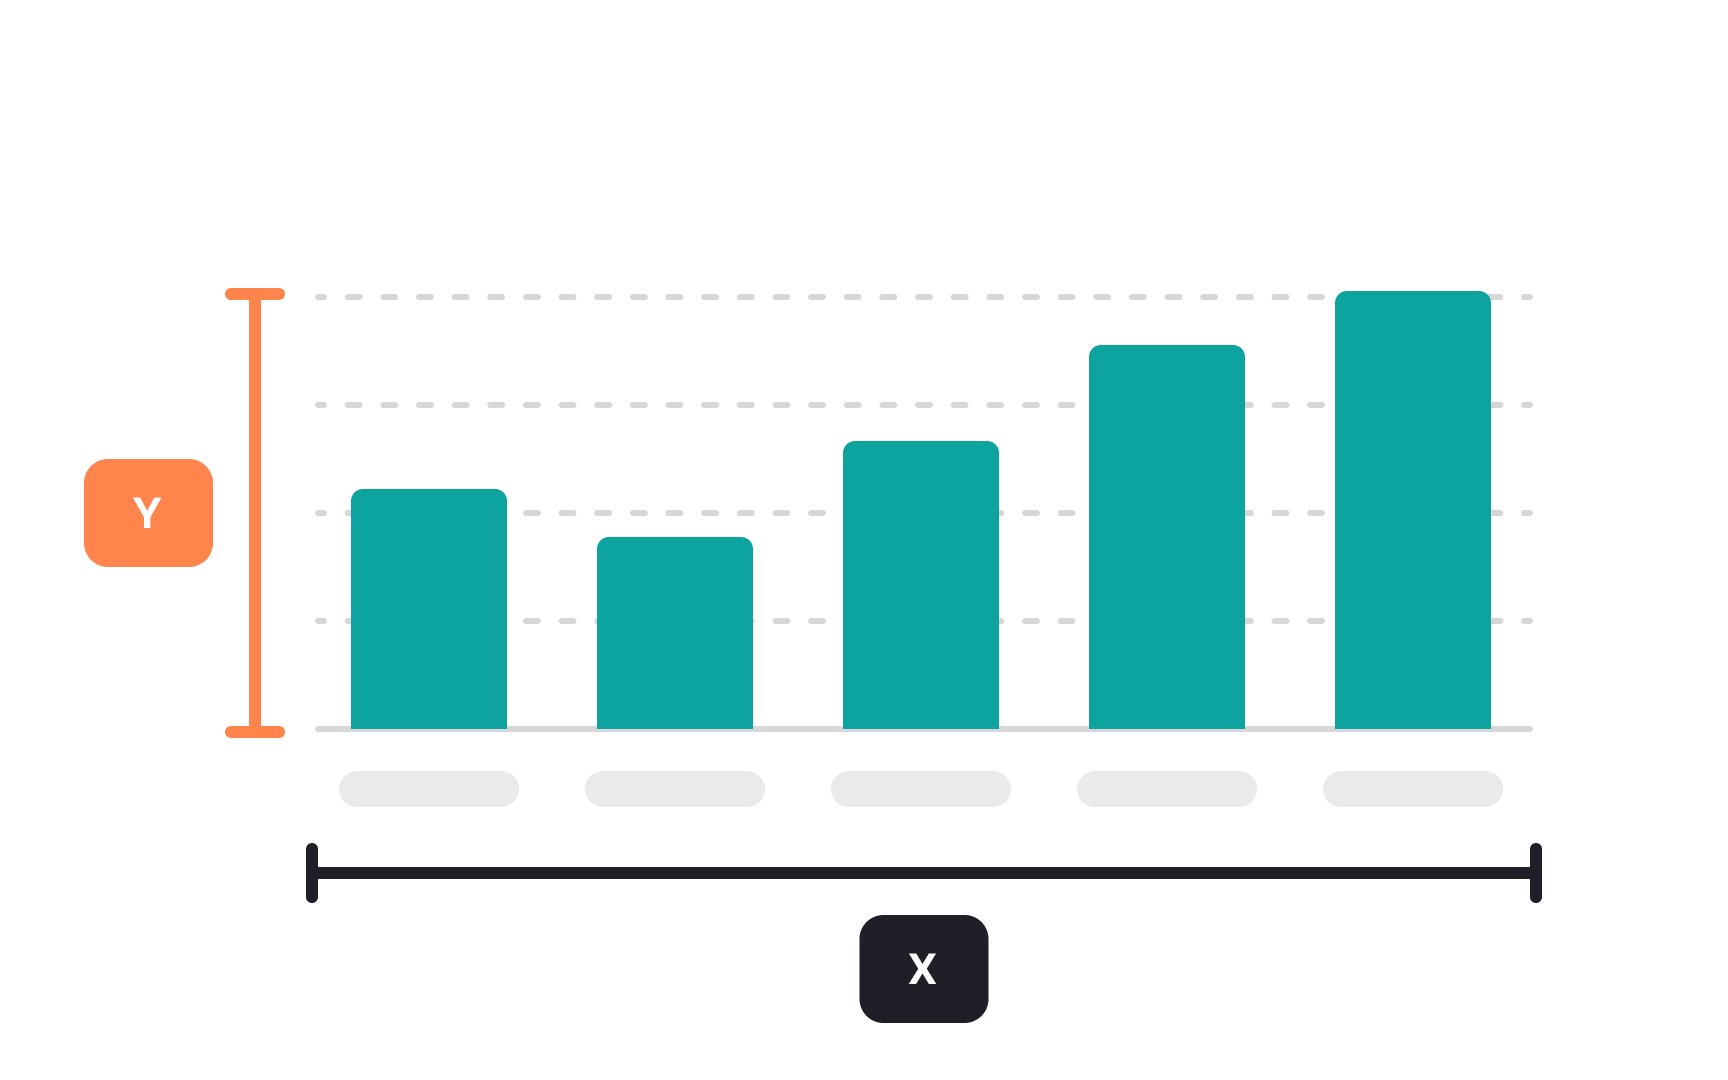
The X and Y axes are the two reference lines on a graph or chart. The X-axis runs horizontally (left to right) and usually represents time or categories, showing the progression of data points. The Y-axis runs vertically (up and down) and typically measures the value or frequency of what's being studied, showing how much, how high, or how fast.
Together, these axes form a grid where data points can be plotted, allowing us to see patterns, trends, or relationships within the data. They are fundamental in understanding how one variable may affect another and in making comparisons clear and easy to analyze.
Pro Tip: Use the y-axis to represent quantities.
Top contributors