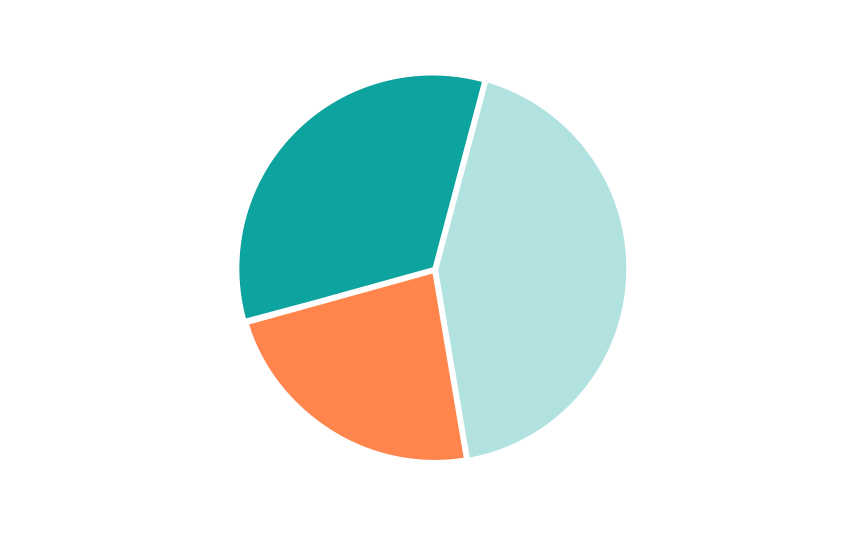
Pie chart
A pie chart is a circular graphic divided into slices to show numerical proportions. Each slice represents a different category, with the entire circle representing the total data set. The size of each slice is proportional to its quantity.
Pie charts are especially useful for showing the relative sizes of parts to the whole. They are ideal for displaying the distribution or composition of a data set in a simple and clear manner. For example, a pie chart makes sense when illustrating the percentage of market share held by different companies in an industry.
Pro Tip: Consider using other types than a pie chart if you want to compare categories to each other rather than each category to a whole.

