Combine qualitative and quantitative insights
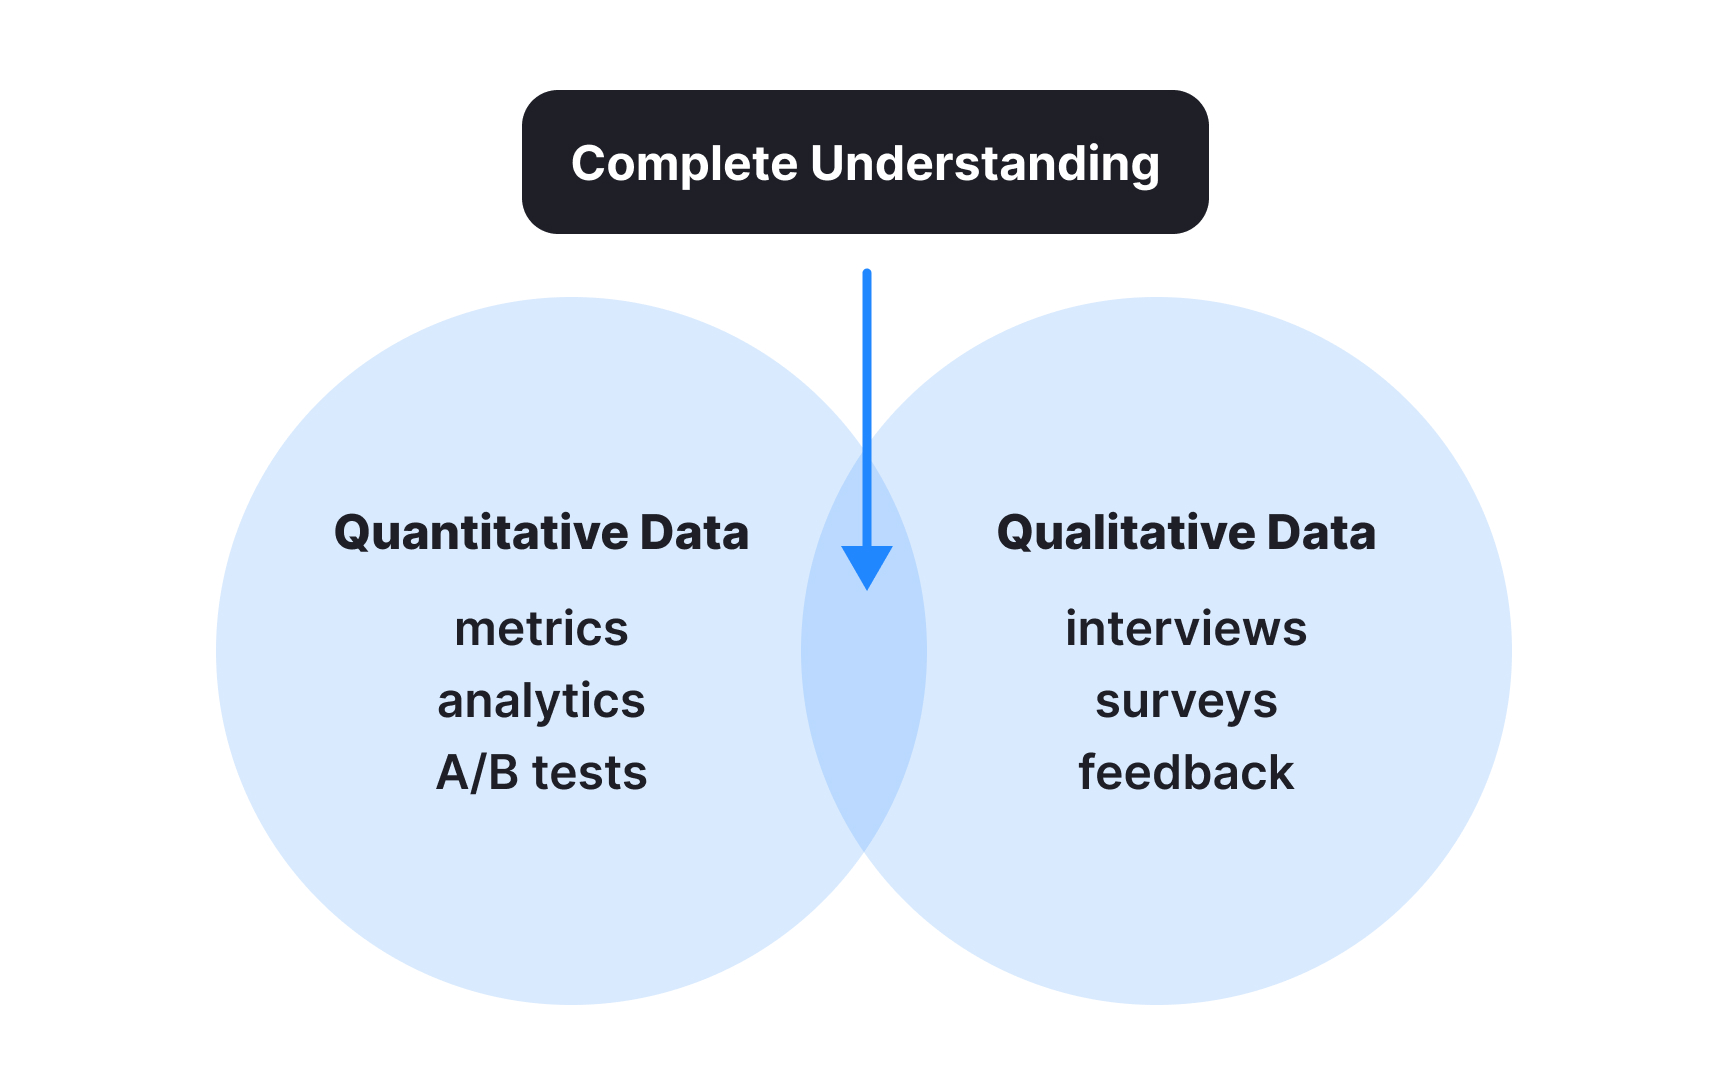
Qualitative and quantitative data each tell only half the story of product performance. Quantitative metrics reveal what users do through numbers, patterns, and trends: clicks, conversions, time spent, and other measurable behaviors. Qualitative insights explain why users behave as they do through interviews, surveys, and feedback revealing their motivations, frustrations, and emotional responses.
Integrating these data types creates a complete understanding that neither can provide alone. When analytics show users abandoning a workflow, interview data might reveal specific confusion points. Conversely, positive user sentiment expressed in interviews can be verified by retention metrics showing actual behavior matches reported satisfaction.
Effective integration follows a cyclical process: use quantitative data to identify patterns requiring explanation, gather qualitative insights to understand those patterns, then validate interpretations with further quantitative testing. This prevents both missing the human context behind metrics and relying too heavily on small sample feedback.
Pro Tip: For every key metric in your dashboard, pair it with a qualitative data source that helps explain changes in that number, creating linked "what + why" measurement pairs.
