Bottleneck Metrics
Find and fix what's really holding your product back with strategic metric prioritization
Product growth often stalls not from lack of effort, but from hidden constraints along the user journey. Bottleneck metrics reveal these exact pain points using the AARRR framework (Acquisition, Activation, Retention, Referral, Revenue) as your growth roadmap. Rather than trying to improve everything simultaneously, identifying the critical bottlenecks at every stage creates clear priorities. When you pinpoint exactly where users drop off, you build solutions that address genuine problems instead of features that miss the mark. Smart teams know that growth accelerates when systematically eliminating the right bottlenecks at the right time.
Moreover, each product stage requires its own measurement approach: early products need validation signals while established ones optimize for efficiency. The real power comes when product, design, and growth teams align around these metrics to focus resources strategically.
The
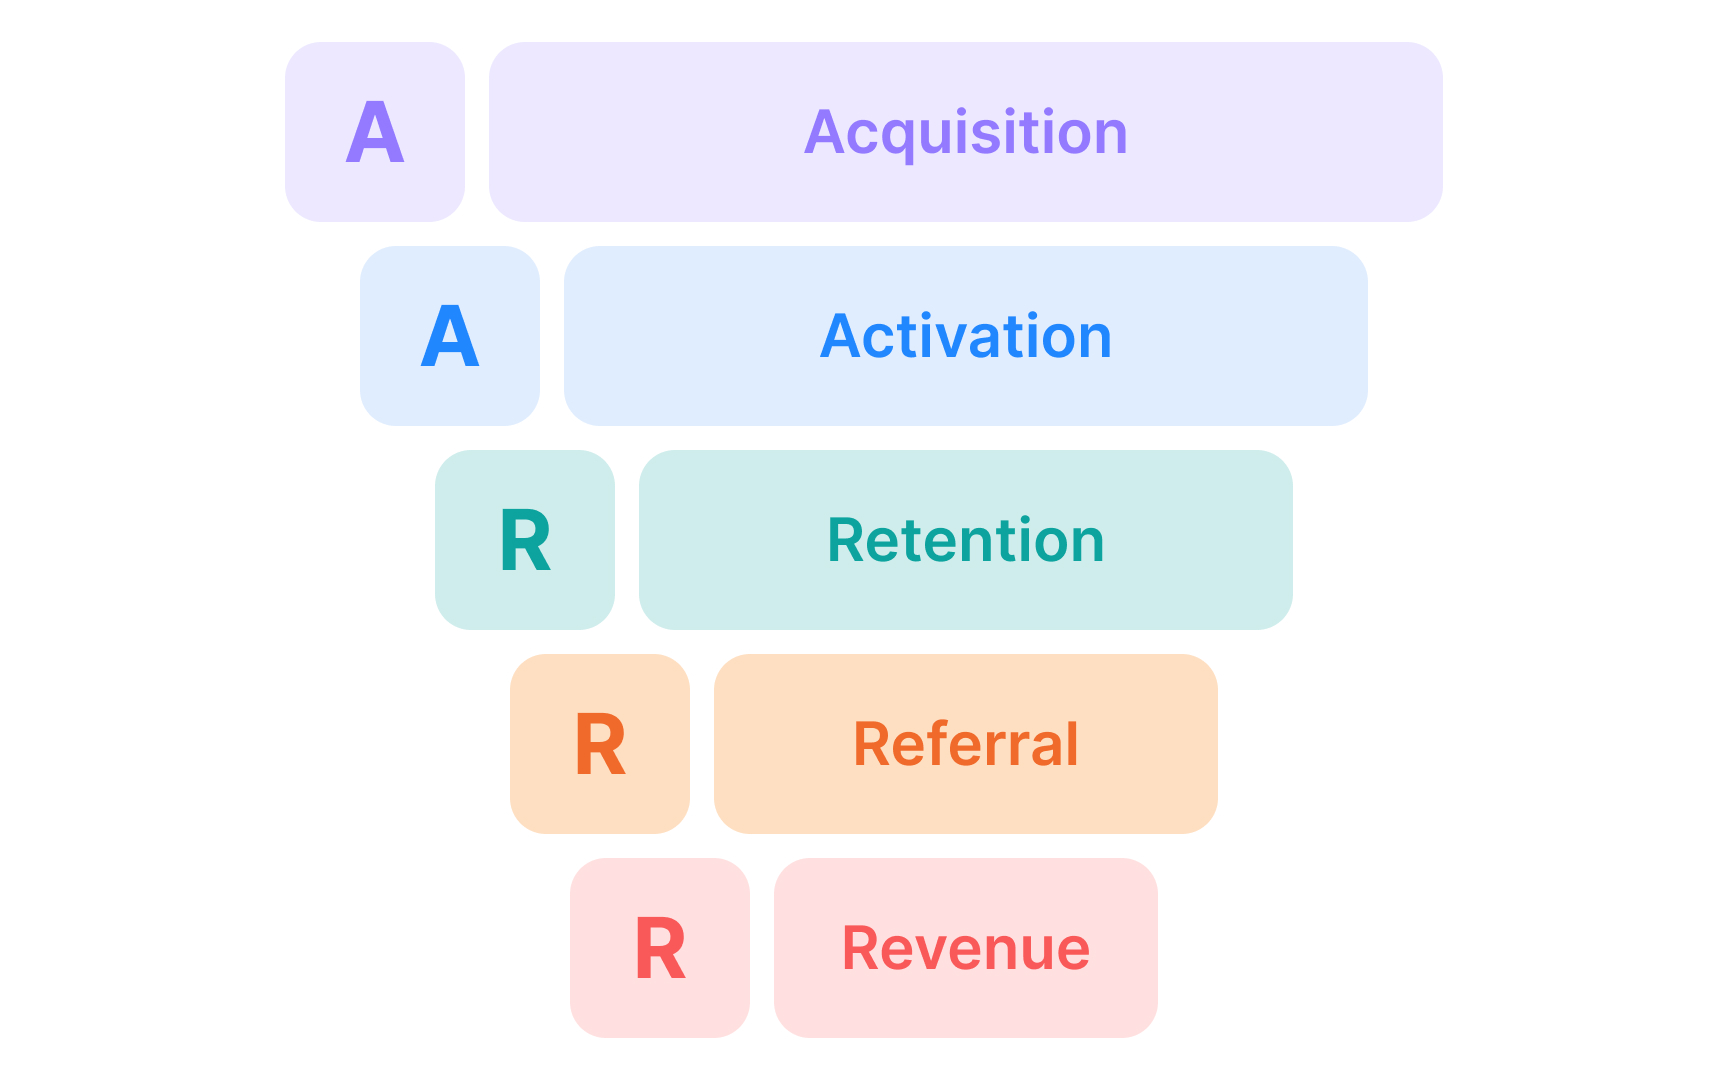
Each stage represents a crucial transition in users' relationship with your product:
- Acquisition tracks how users discover you
- Activation measures meaningful first experiences
- Retention shows ongoing engagement
- Referral captures word-of-mouth growth
- Revenue tracks monetization success
By organizing metrics within this framework, teams can identify which stage needs the most attention rather than trying to improve everything simultaneously. This helps prioritize resources and create targeted improvements where they'll have the greatest impact on overall growth.
How do people find your product? Acquisition metrics illuminate this journey, measuring both the pathways users take to discover you and the effectiveness of your various marketing channels. Key metrics to track include source attribution, channel-specific conversion rates, acquisition costs (CPA), and the time needed to recoup these investments (CAC payback). Remember that quantity doesn't always equal quality. Channels driving high traffic volumes might not deliver users who stick around.
For product teams, the critical question isn't just where users come from, but where your best users originate. Analyzing which channels produce users with higher lifetime value, activation rates, or
However, keep in mind that this entire landscape is complicated by evolving privacy regulations. Changes to cookies, app store policies, and tracking capabilities increasingly fragment attribution data between marketing touchpoints and product interactions. Teams must adapt their measurement approaches accordingly, accepting that perfect attribution is becoming less attainable.
Activation metrics measure whether users successfully experience your product's core value during their first
Key activation metrics include completion rates of onboarding steps, time to first value, and the percentage of new users who complete a meaningful action specific to your product. These metrics help identify friction points that prevent users from experiencing your product's benefits quickly. There are typically multiple activation moments, for example: registration, tool connections, core actions, each deepening the user's investment in your ecosystem.
Remember that disappointing
Standard retention metrics include:
- Early user retention (such as day 3 or day 7 retention)
- Medium term retention (such as day 30 or day 60)
- Long term retention (6 month to 12 month plus)
- Retention cohorts (showing return rates after specific time periods)
- Churn rate (the percentage of users who stop using your product)
Align your retention measurement intervals with your product's natural usage cycle. For example, measure daily retention for apps used daily (like social media), weekly for weekly-use products (like meal planning apps), or monthly for less frequently used services (like travel booking platforms).
As retention is one of the biggest lagging indicators of product success, many teams use short-term measures (like day 7 retention) as proxies until sufficient data exists for longer-term patterns. Poor retention creates a "leaky bucket" where new acquisitions simply replace departing users rather than contributing to net growth, exhausting
Pro Tip: Analyze retention patterns by user segments to identify which types of users stick around longest, then focus acquisition efforts on finding more users with similar characteristics.
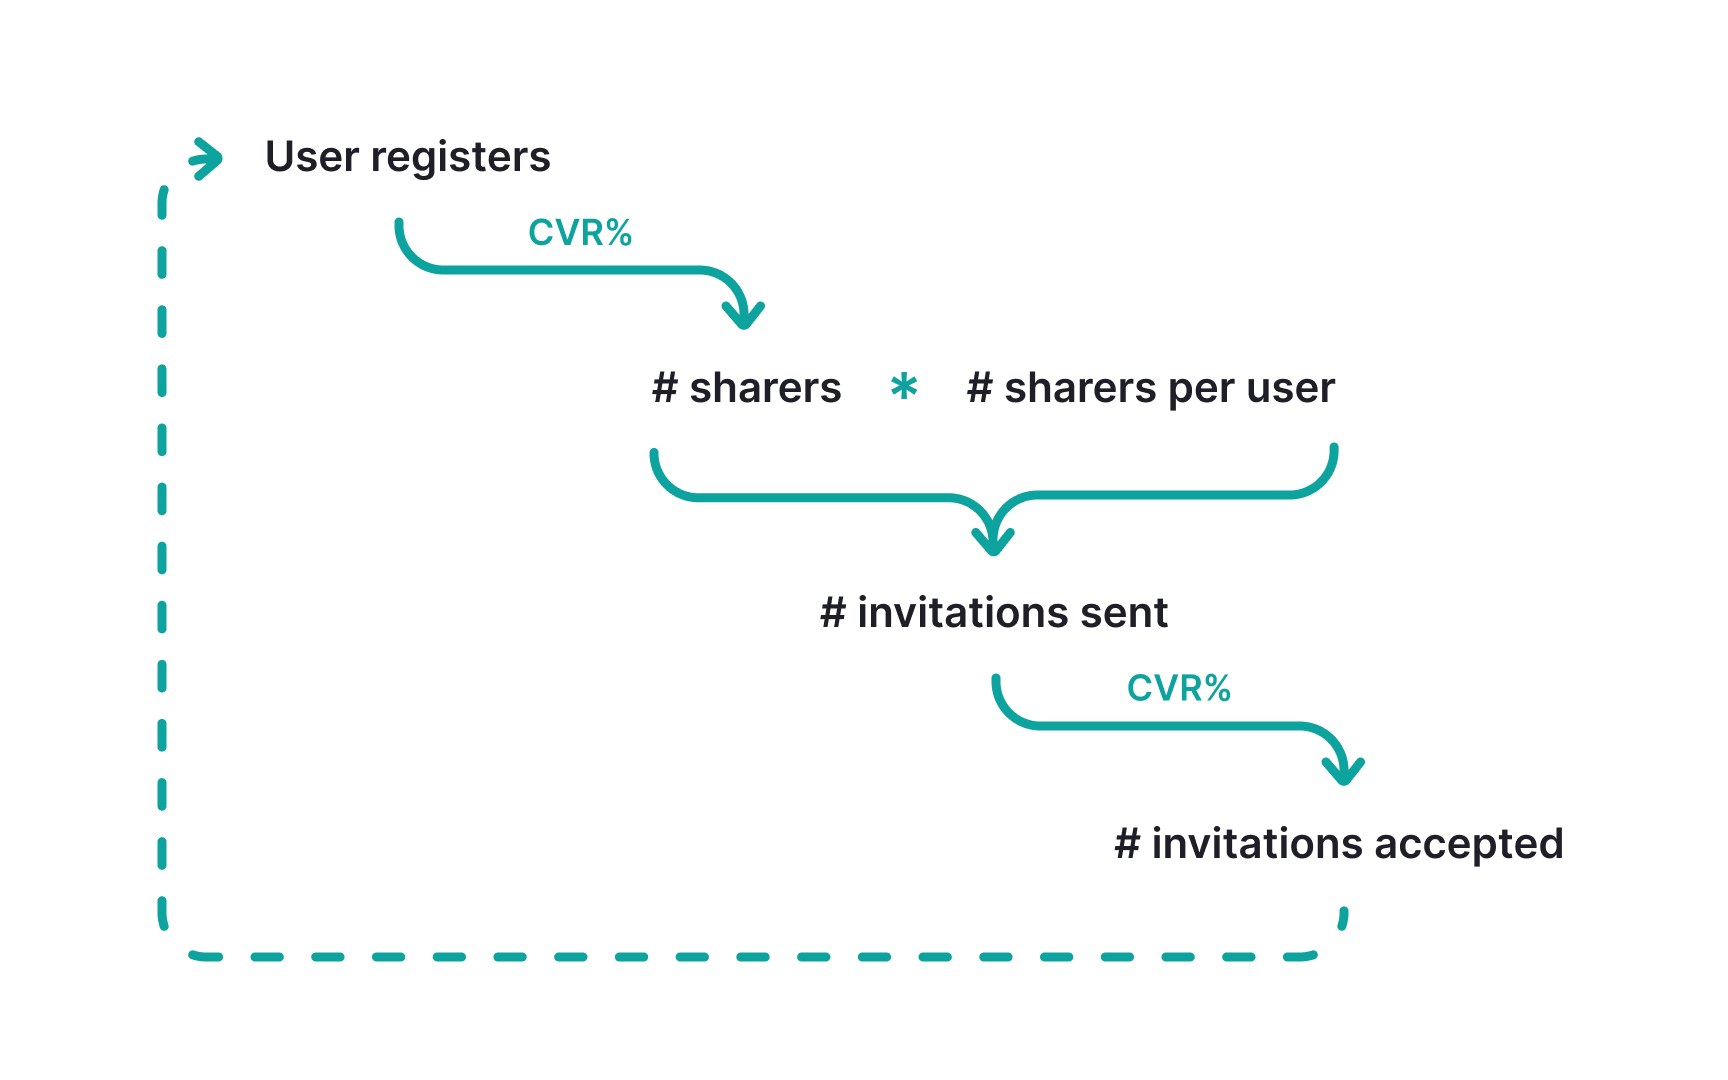
Referral metrics measure how effectively your existing users bring in new users through word-of-mouth, invites, or sharing features. These metrics capture the viral component of your growth strategy.
Key referral metrics include referral rate (percentage of users who refer others), the average number of referrals per user, invite acceptance rate, and the viral coefficient (how many new users each existing user brings in on average). A viral coefficient above 1.0 indicates that each user brings in more than one new user, creating self-sustaining growth.
Referral programs work best when they deliver value to both parties and when the act of sharing feels natural rather than forced. The most effective referrals happen when users genuinely love your product and want to share it with others who would benefit, rather than simply seeking rewards.
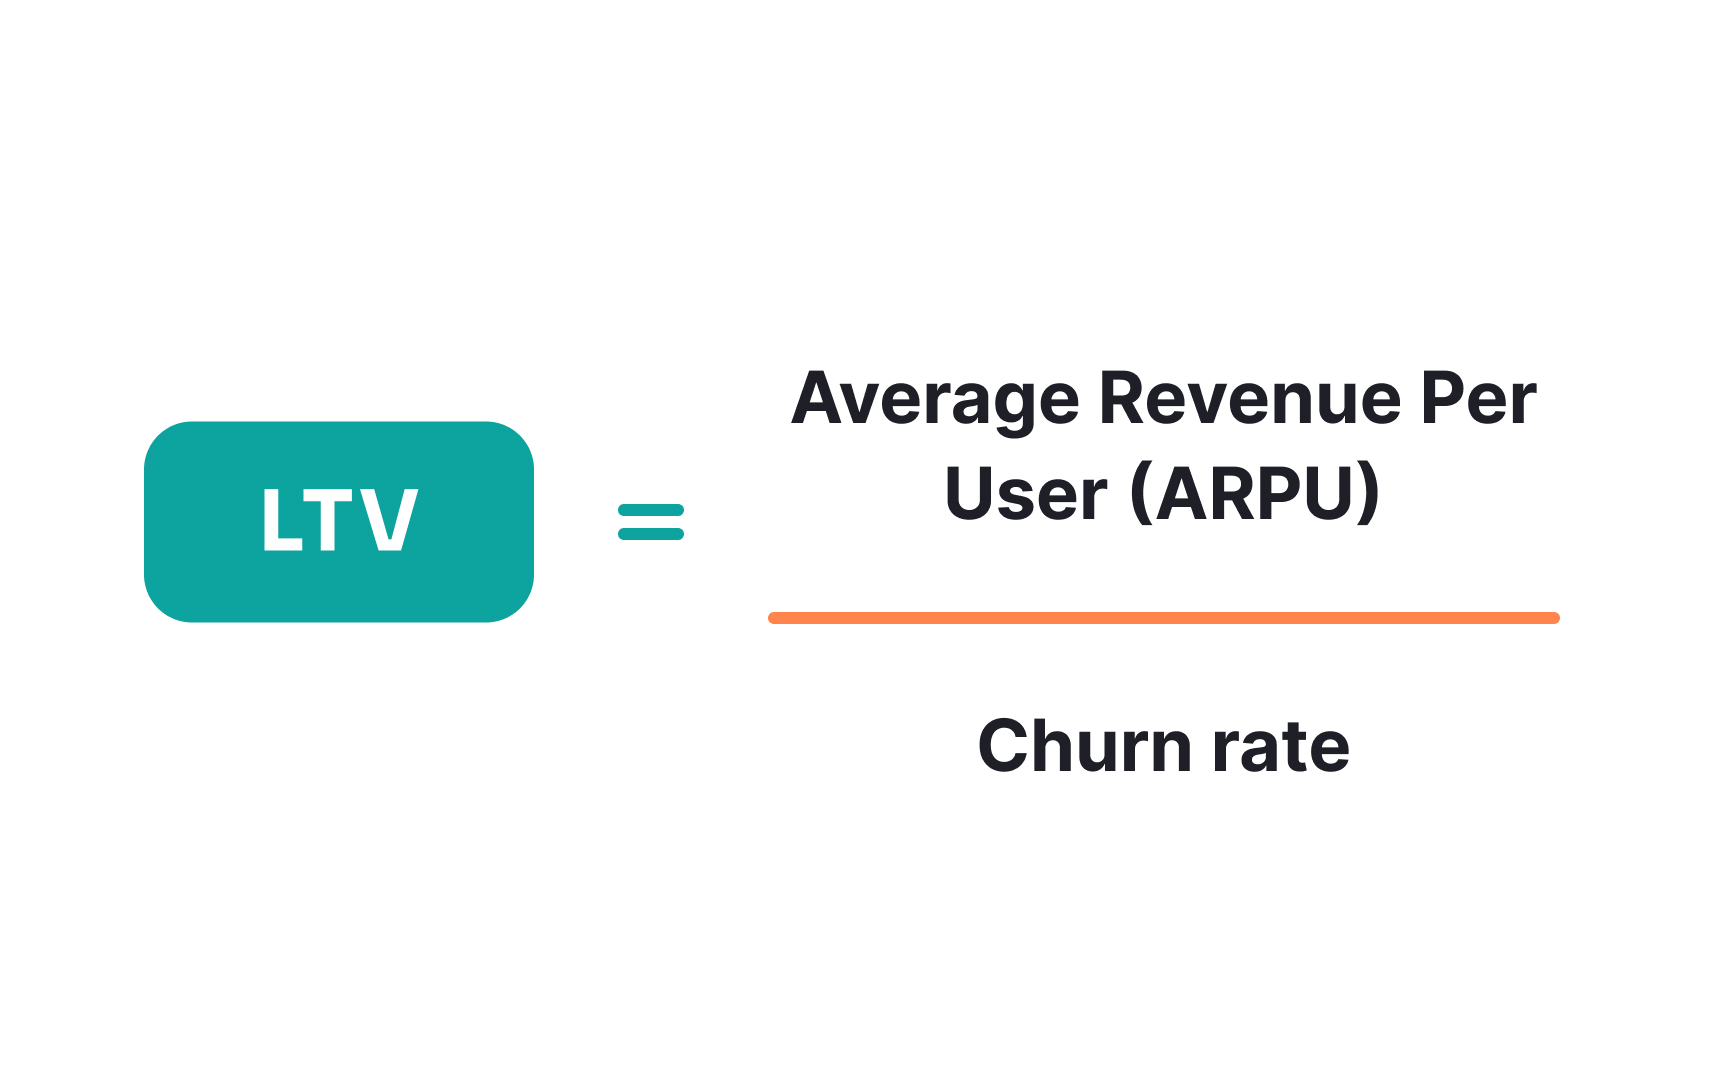
Customer lifetime value (LTV) stands as the most important revenue metric, representing the total revenue a customer generates before churning. Calculated as average revenue per user (ARPU) divided by
Keep in mind that different business models require different revenue metrics. For example, eCommerce focuses on average order value and purchase frequency, while B2B SaaS companies track annual contract value (ACV), upsell conversion rates, and enterprise account expansion. Regardless of model, revenue metrics should connect back to earlier funnel stages to understand which acquisition channels and user segments generate the most financial value.
Bottleneck metrics identify the specific stage in your growth funnel that most limits overall product growth. These metrics serve as your key drivers or rate-limiting steps, and often become the natural key results for product teams to tackle. Rather than trying to improve all metrics simultaneously, focus on finding and fixing the most constrained part of your funnel.
To identify your bottleneck, calculate
Once identified, concentrate resources on removing this constraint before moving to the next limiting factor. This ensures maximum impact for your improvement efforts rather than spreading resources thinly across multiple initiatives that may not address the core limitation.
Bottleneck metrics provide the perfect foundation for creating focused objectives and key results (OKRs). Identifying your product's primary constraint gives you a clear target for your most important objective.
Start by determining which
Your key results should directly measure improvement in the bottleneck metrics. Following our activation example, key results might include "Increase completion of key onboarding actions from 40% to 60%" or "Reduce time to first value from 3 minutes to 30 seconds." Create OKRs that focus on outcomes (what impact you want to achieve) rather than outputs (what features you'll build) to maintain flexibility in how you solve the bottleneck.
Cross-functional alignment around key funnel stages prevents scattered efforts and ensures everyone works toward removing the same bottlenecks. Different teams naturally focus on different metrics, creating potential misalignment. For example, imagine a product with an activation bottleneck where only 25% of new users complete the
When properly aligned, these same teams would coordinate their efforts: marketing would target more qualified users likely to complete onboarding, product would simplify initial user flows, and design would improve the clarity of onboarding steps. This focused approach removes the bottleneck more effectively than each team optimizing their own metrics in isolation.
References
- AARRR: Come Aboard the Pirate Metrics Framework | Amplitude
Top contributors

Topics
From Course

Share


Similar lessons

Continuous Discovery Mindset

Business Outcomes vs. Product Outcomes
