Web analytics
Analytics data demonstrates how people use your live product — a website or an application. Google Analytics is one of the most popular tools that comes with a free version. If you know how to use it correctly, you can get amazing insights by exploring:
- Standard pageview data: You can see pages where users entered and exited your product, paths they've taken, or the device they've used.
- Behavior flow report: This allows you to analyze users' behavior at a particular flow point or see which steps in your scenario fail most often.
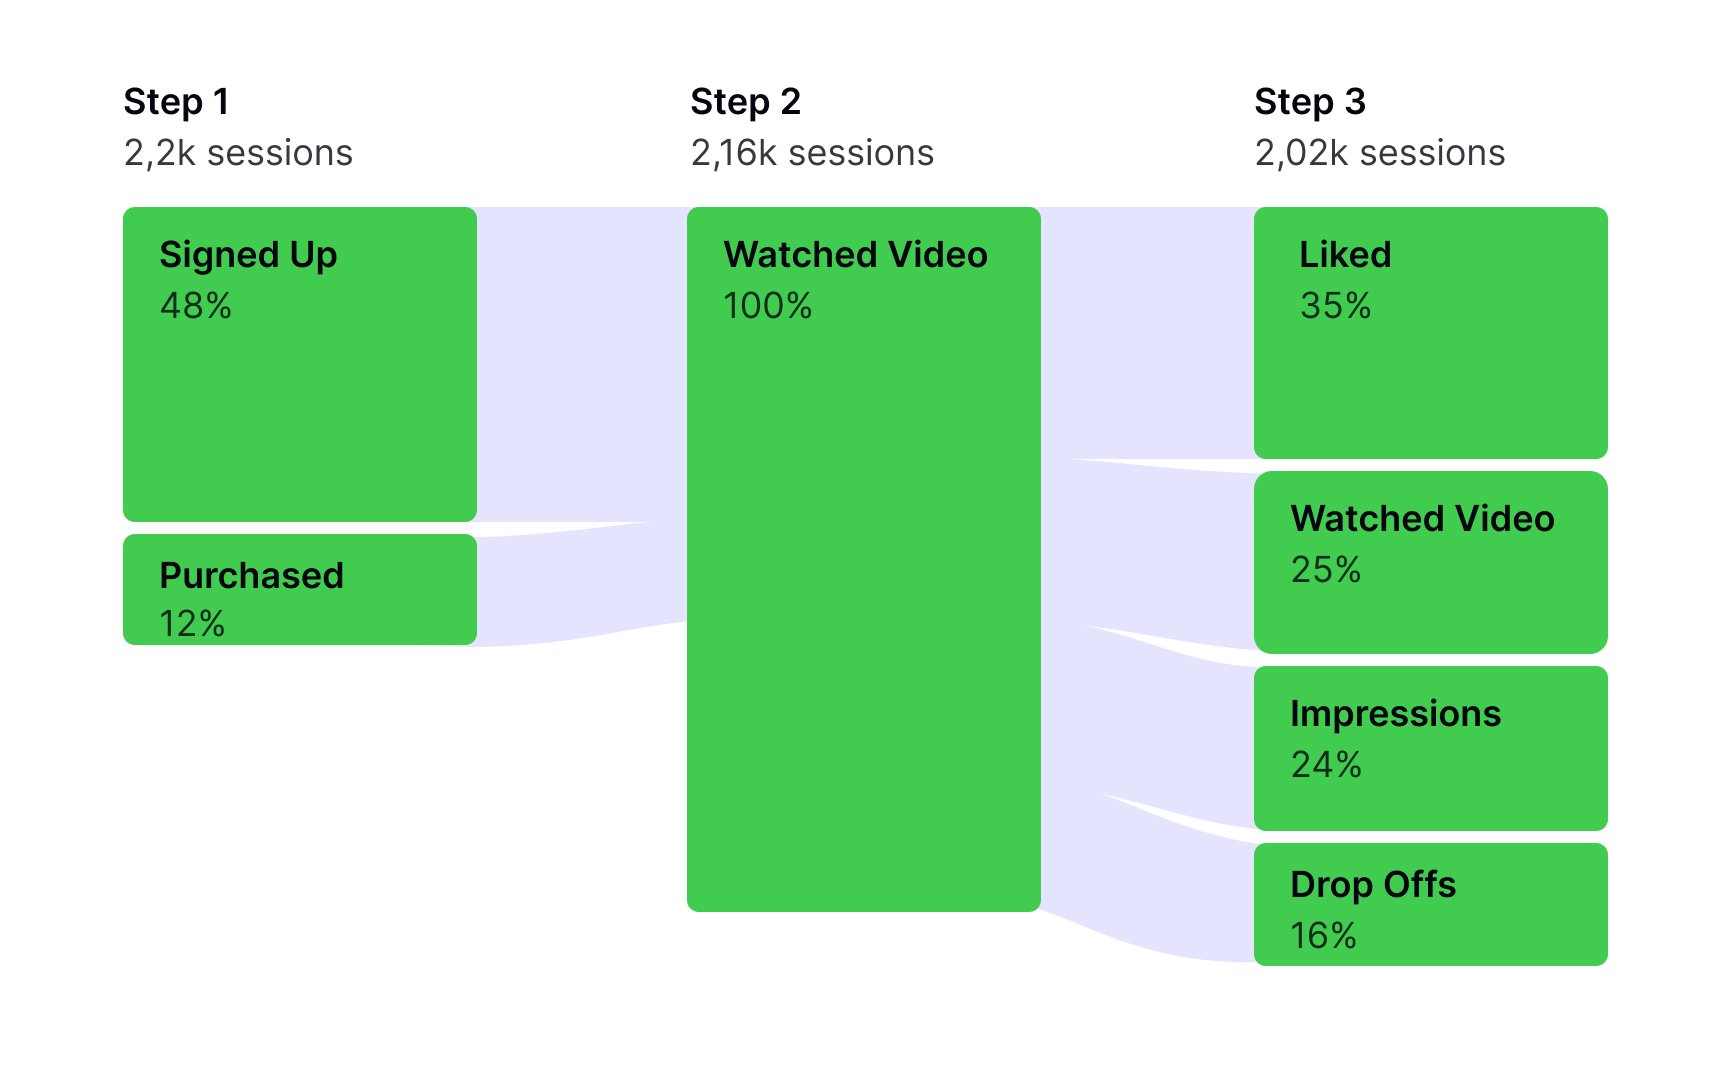
- Goals and funnels: You can set different goals for the same website, like user registration, completing a purchase, or email subscription, and see the steps users take to reach that goal.
- Event tracking: You can evaluate how successfully users interact with any element on a page, like creating a folder, uploading a file, or clicking the Settings icon.
- Time tracking: This method can tell how much time users spend on reaching a goal or which actions take longer to complete or process.
Analytics data provides hard facts about a user's experience and allows you to see what users actually do compared to what they say. Using this quantitative method helps persuade data-oriented stakeholders and gives more information for driving additional user research.
