Basic Journey Mapping and Service Blueprinting
Create comprehensive visualizations of citizen experiences and government service delivery using journey maps and service blueprints
Ever wondered why some government services flow smoothly while others create frustration? The answer often lies in understanding the complete picture, from a citizen's first thought about needing a service to the moment they walk away satisfied. Journey mapping and service blueprinting unlock this understanding by revealing the hidden connections between what citizens experience and how government operations work behind the scenes. These powerful tools capture the real stories of citizen interactions, their emotional highs and lows, and the complex web of people, processes, and systems making it all happen. By breaking down these intricate service interactions, teams gain clear insights into where services excel and where they can be improved. This practical knowledge transforms abstract government processes into tangible, actionable insights that lead to better services for everyone.
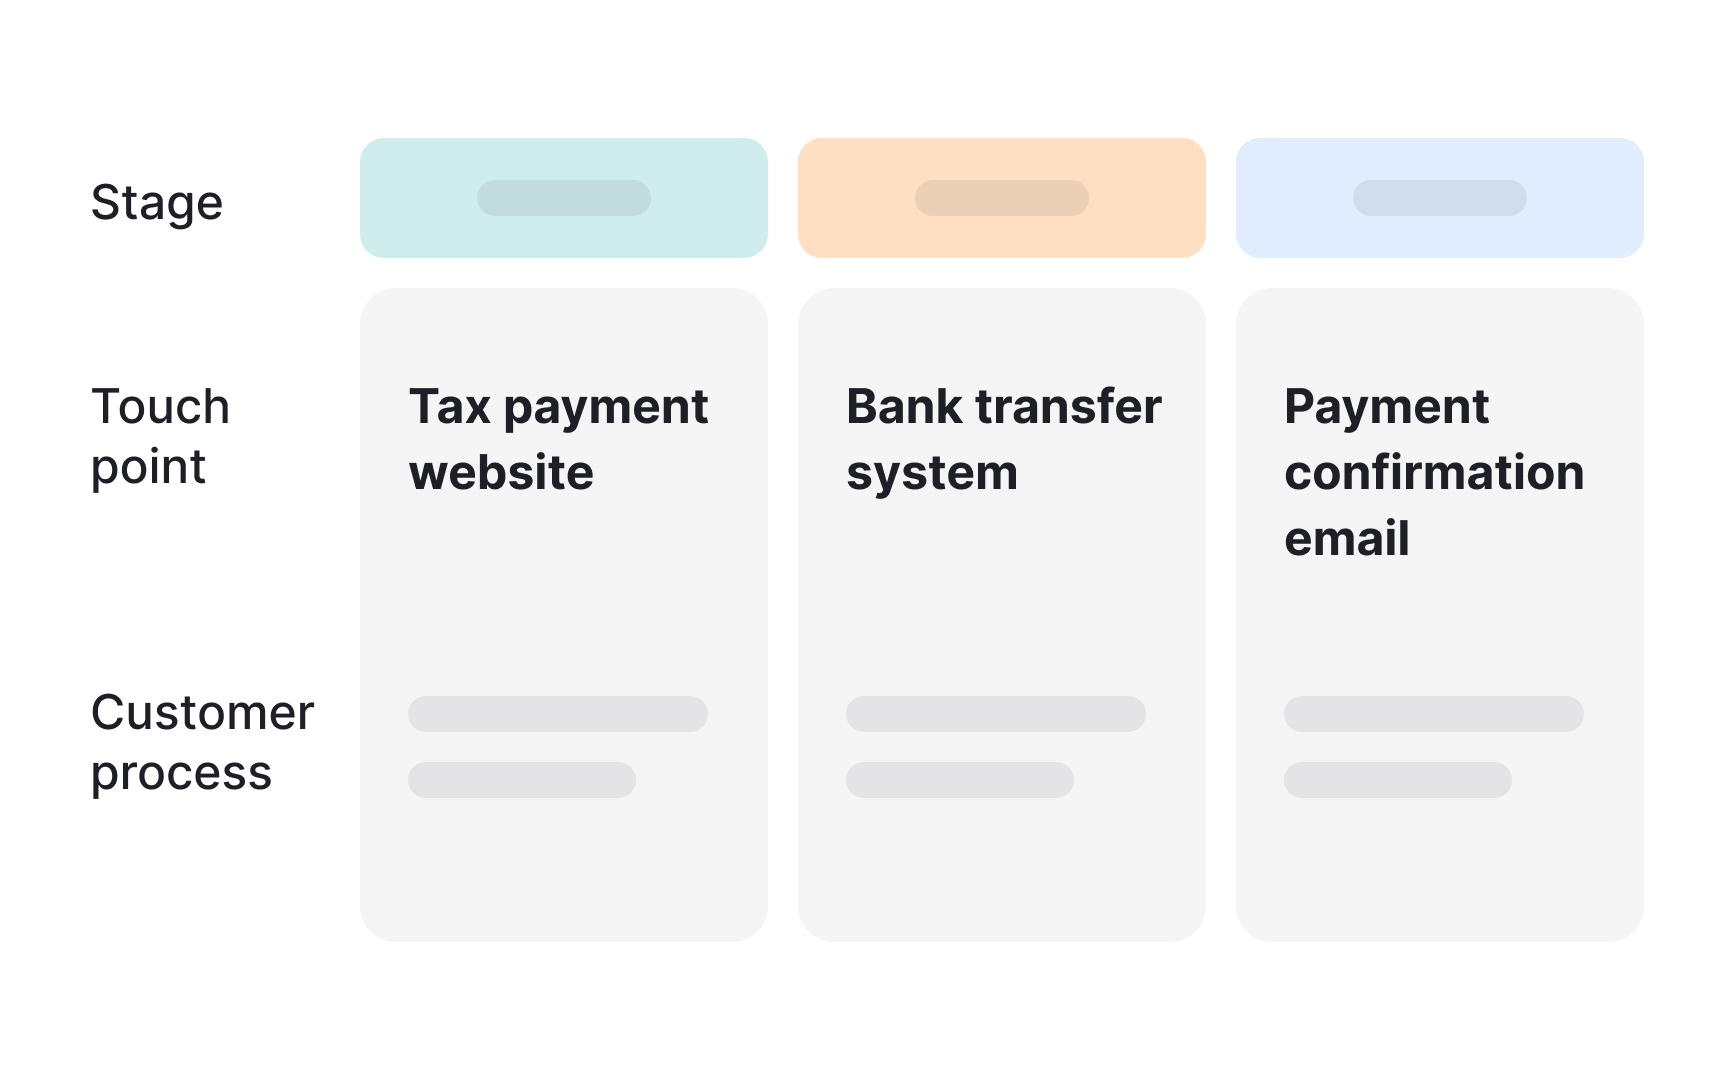
Next, document each touchpoint with specific details: physical locations with addresses and office hours, digital platforms with URLs and features, and contact center numbers with operating hours. Include any service-specific requirements, such as required documents or payment steps at each point.
Collaborate with front-line staff to confirm this information. Their day-to-day experience offers valuable insights into which channels citizens actually use and prefer. Be sure to note any differences between official procedures and real-world behavior, as these gaps often highlight areas where services can improve.
To keep your mapping consistent, use a standard format for recording each touchpoint. Include the channel type, access method or location, available services, and hours of operation. This structured approach makes it easier to compare and align data across different departments.
Pro Tip: Create a simple spreadsheet template for touchpoint documentation to maintain consistency when multiple team members collect information.
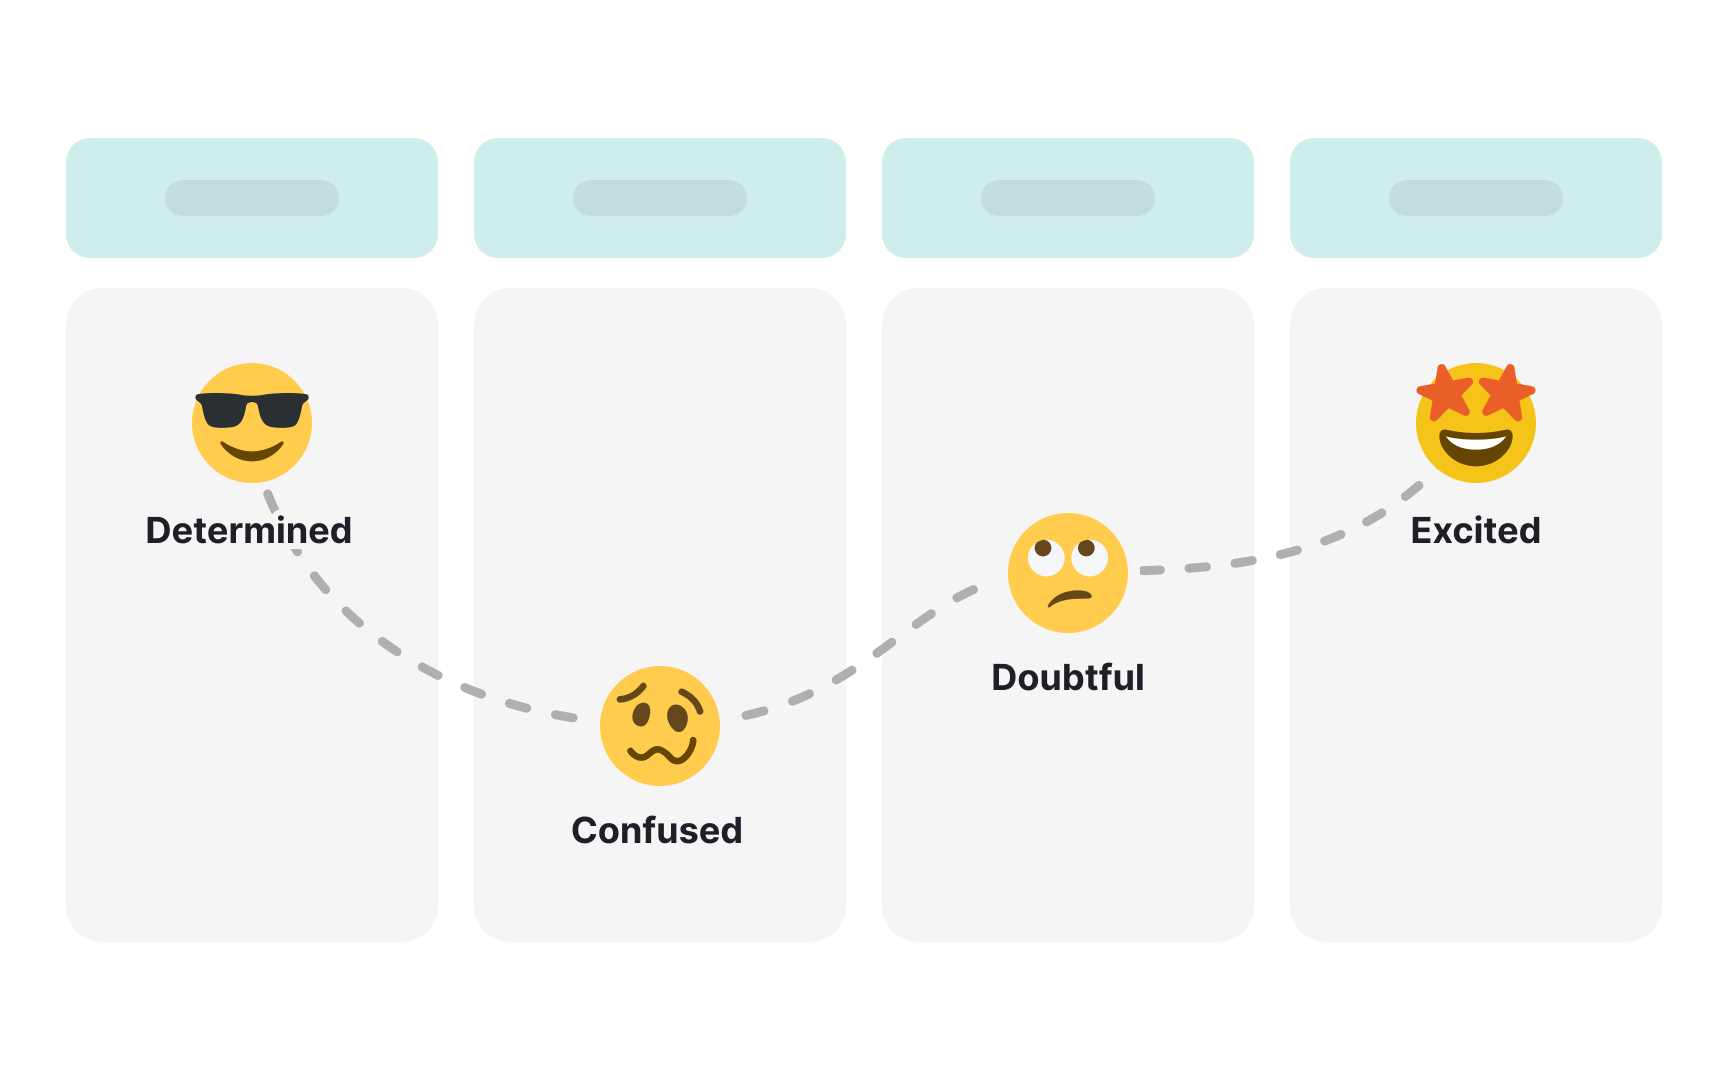
Each time citizens use a government service, they experience different emotions. These feelings tell us how well the service works and where it needs improvement. Simple methods help collect and understand these emotional responses.
Teams can use interviews to hear what citizens say, collect their direct quotes, watch how they interact with services, and use simple surveys for ratings. These methods work together to show how different groups of citizens respond to various service parts. Many things can affect how citizens feel about a service. Long waiting times, unclear instructions, or conversations with staff members all play a part. It's important to notice both what citizens say and how they act to understand their true feelings. Good documentation of emotional patterns needs real, honest feedback. Using the same methods to observe and rate emotions at every service point helps find reliable patterns. These findings help make government services better for everyone.
Pro Tip: Create an emotion scale that's easy for staff to use. Simple terms like "frustrated," "neutral," and "satisfied" often work better than complex ratings.
A clear goal sets the direction for
For government services, preparation often involves gathering documents or understanding requirements, while follow-up might include receiving permits or additional registrations. Map only the actions that relate to defined goals and scope. This focused approach helps teams identify which steps truly matter for service improvement.
Pro Tip: Write down the journey mapping goal and scope on a visible board to help teams stay focused when documenting actions.
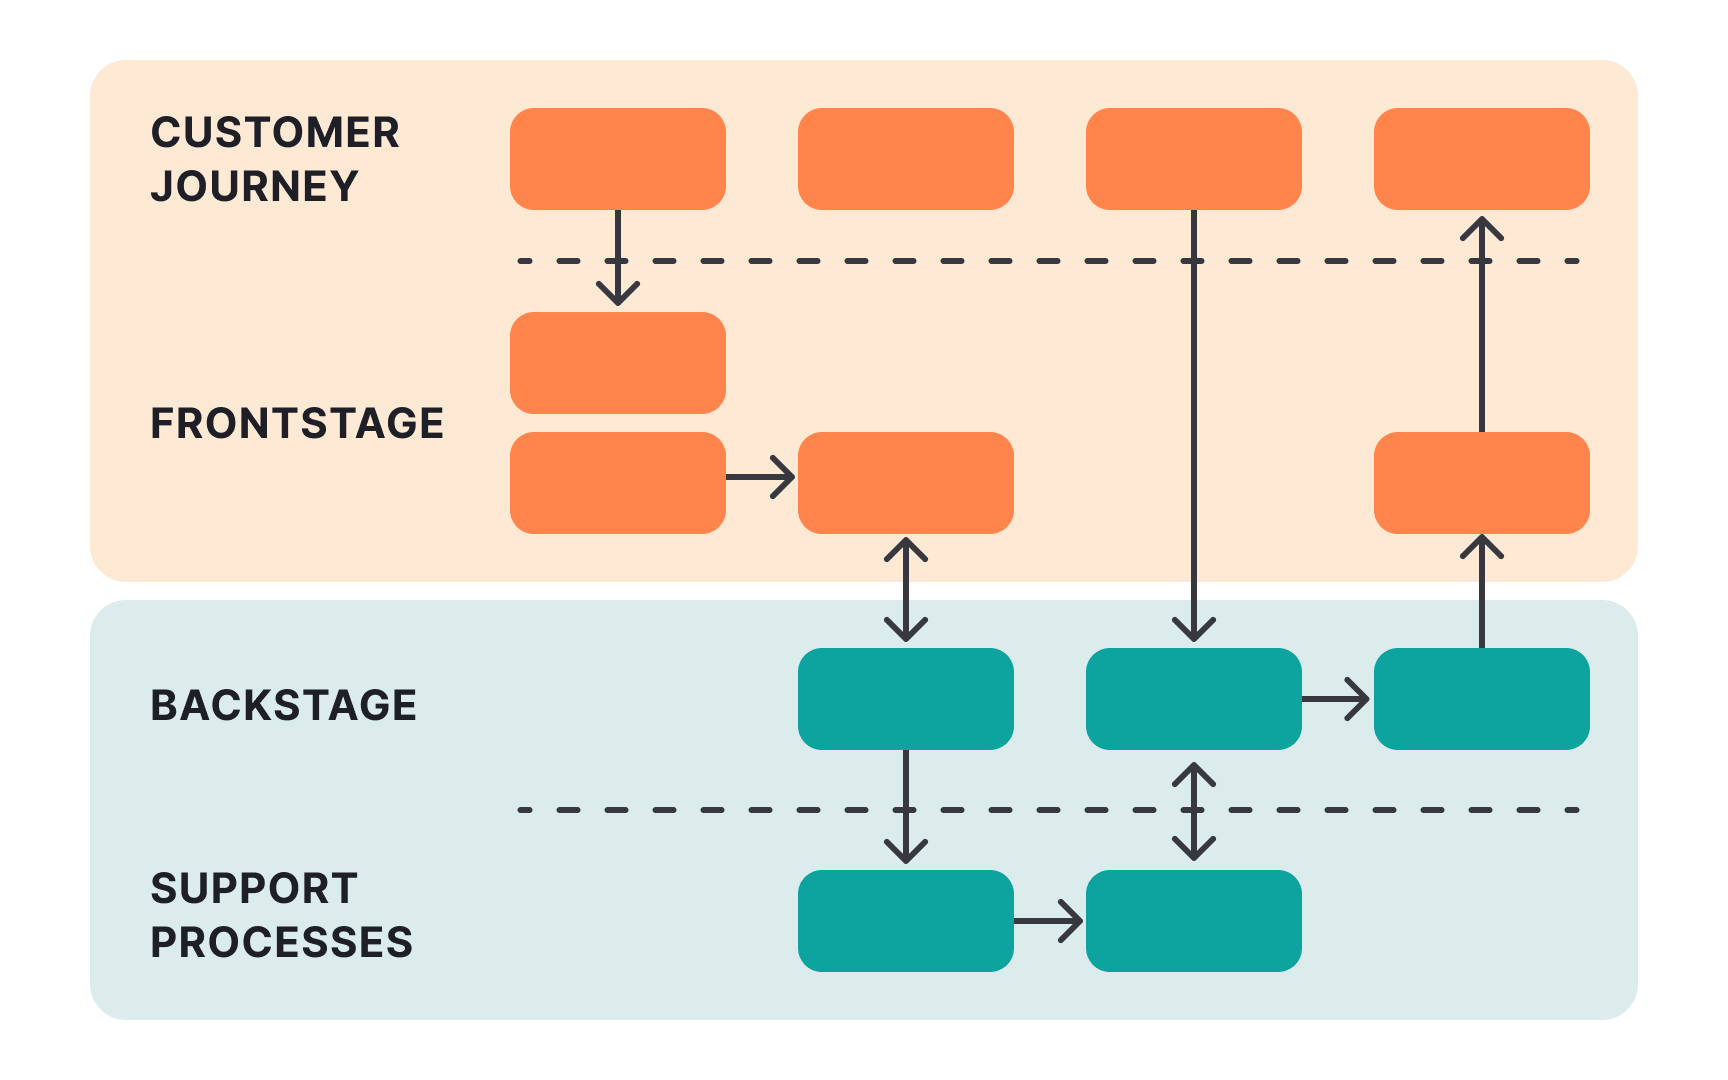
Service blueprints build upon journey maps by adding layers of organizational activities. The first blueprint layer shows how frontline staff supports the journey we've mapped. This connection helps teams see how staff actions directly relate to citizen experiences documented in the
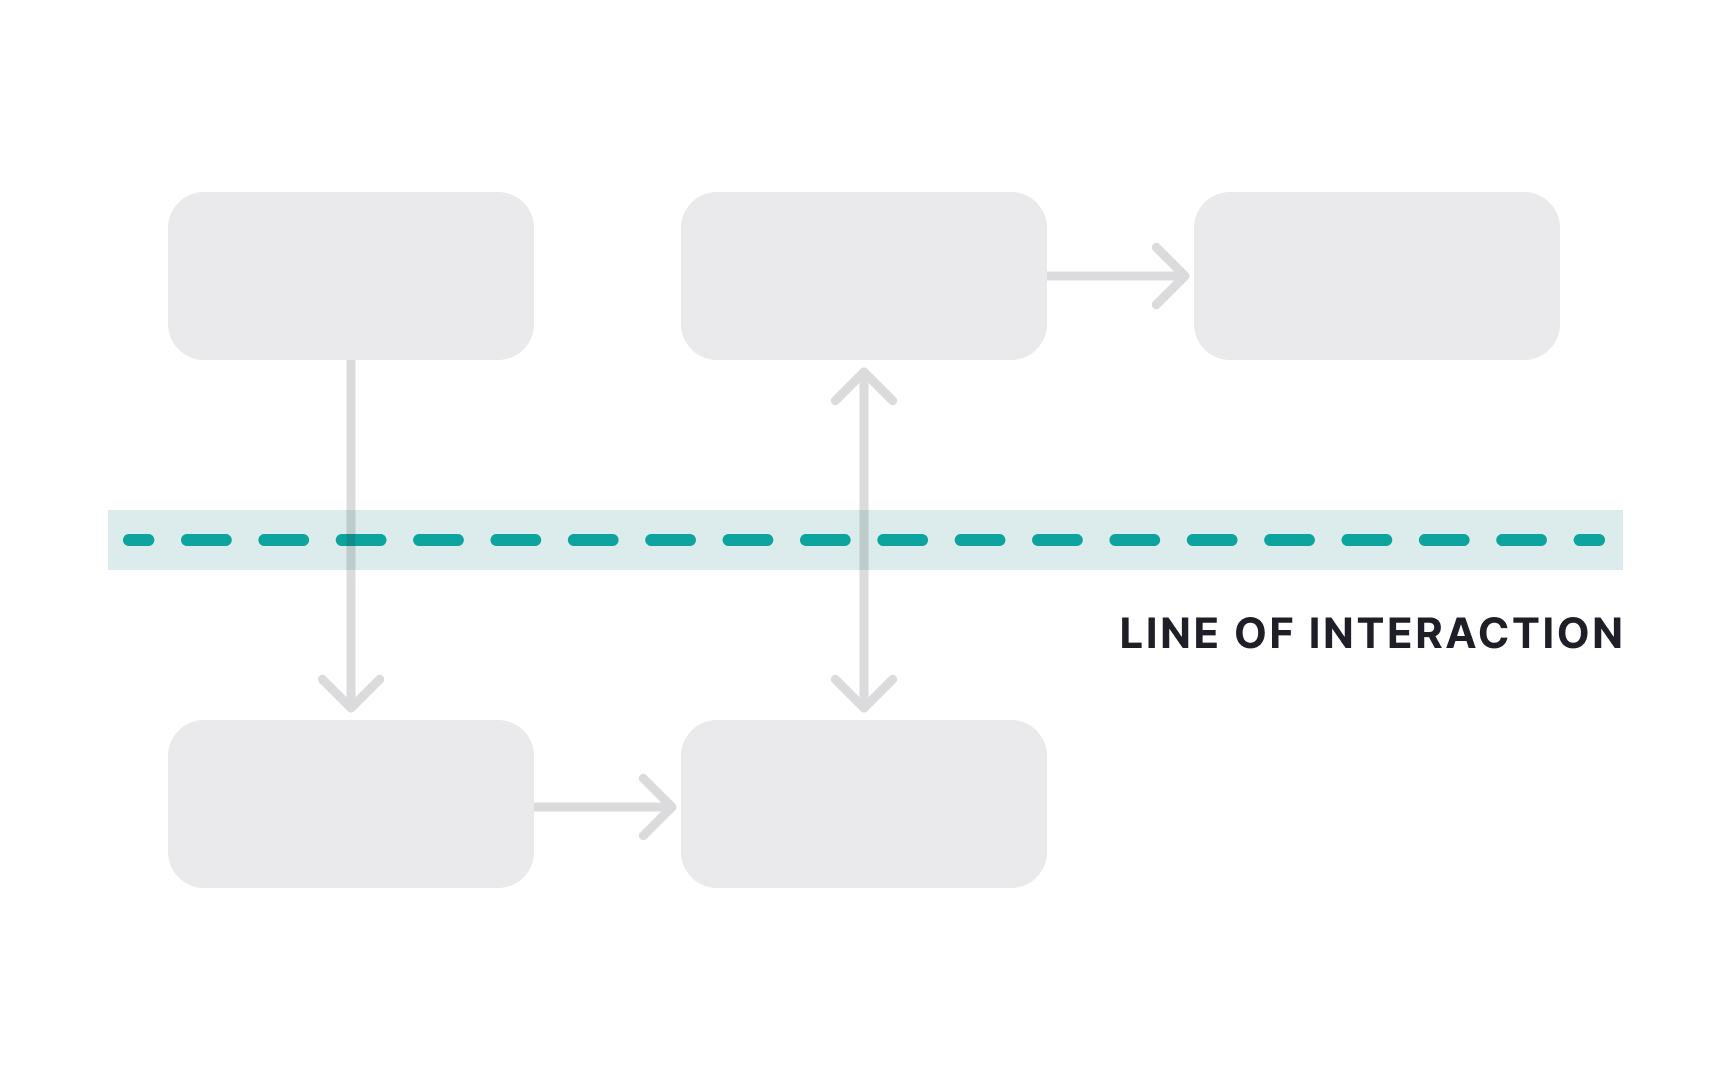
The line between what citizens see (frontstage) and what happens behind the scenes (backstage) is crucial in blueprinting. When a citizen submits documents at a service desk, they see the staff receiving papers but may not see immediate document scanning or data entry. Both visible and invisible staff activities affect service quality. Staff activities often reveal the first signs of internal complexity in service delivery. One simple citizen action might require multiple staff members working together. These connections become visible as we add this first blueprint layer to our journey map.[1]
A service blueprint shows backstage actions that support citizen journeys. These actions happen behind the scenes, after frontline staff
Each backstage action should connect clearly to specific frontline activities and citizen touchpoints we mapped earlier. Some backstage actions happen in sequence, while others occur in parallel. A business registration might need both tax verification and safety checks at the same time. The blueprint should show these timing relationships clearly to help identify potential delays.
Pay special attention to handoffs between different teams. Service delivery often slows down when work moves from one team to another. These transition points affect how quickly citizens receive their services.
Pro Tip: Interview staff from each involved department to understand the complete chain of backstage actions.
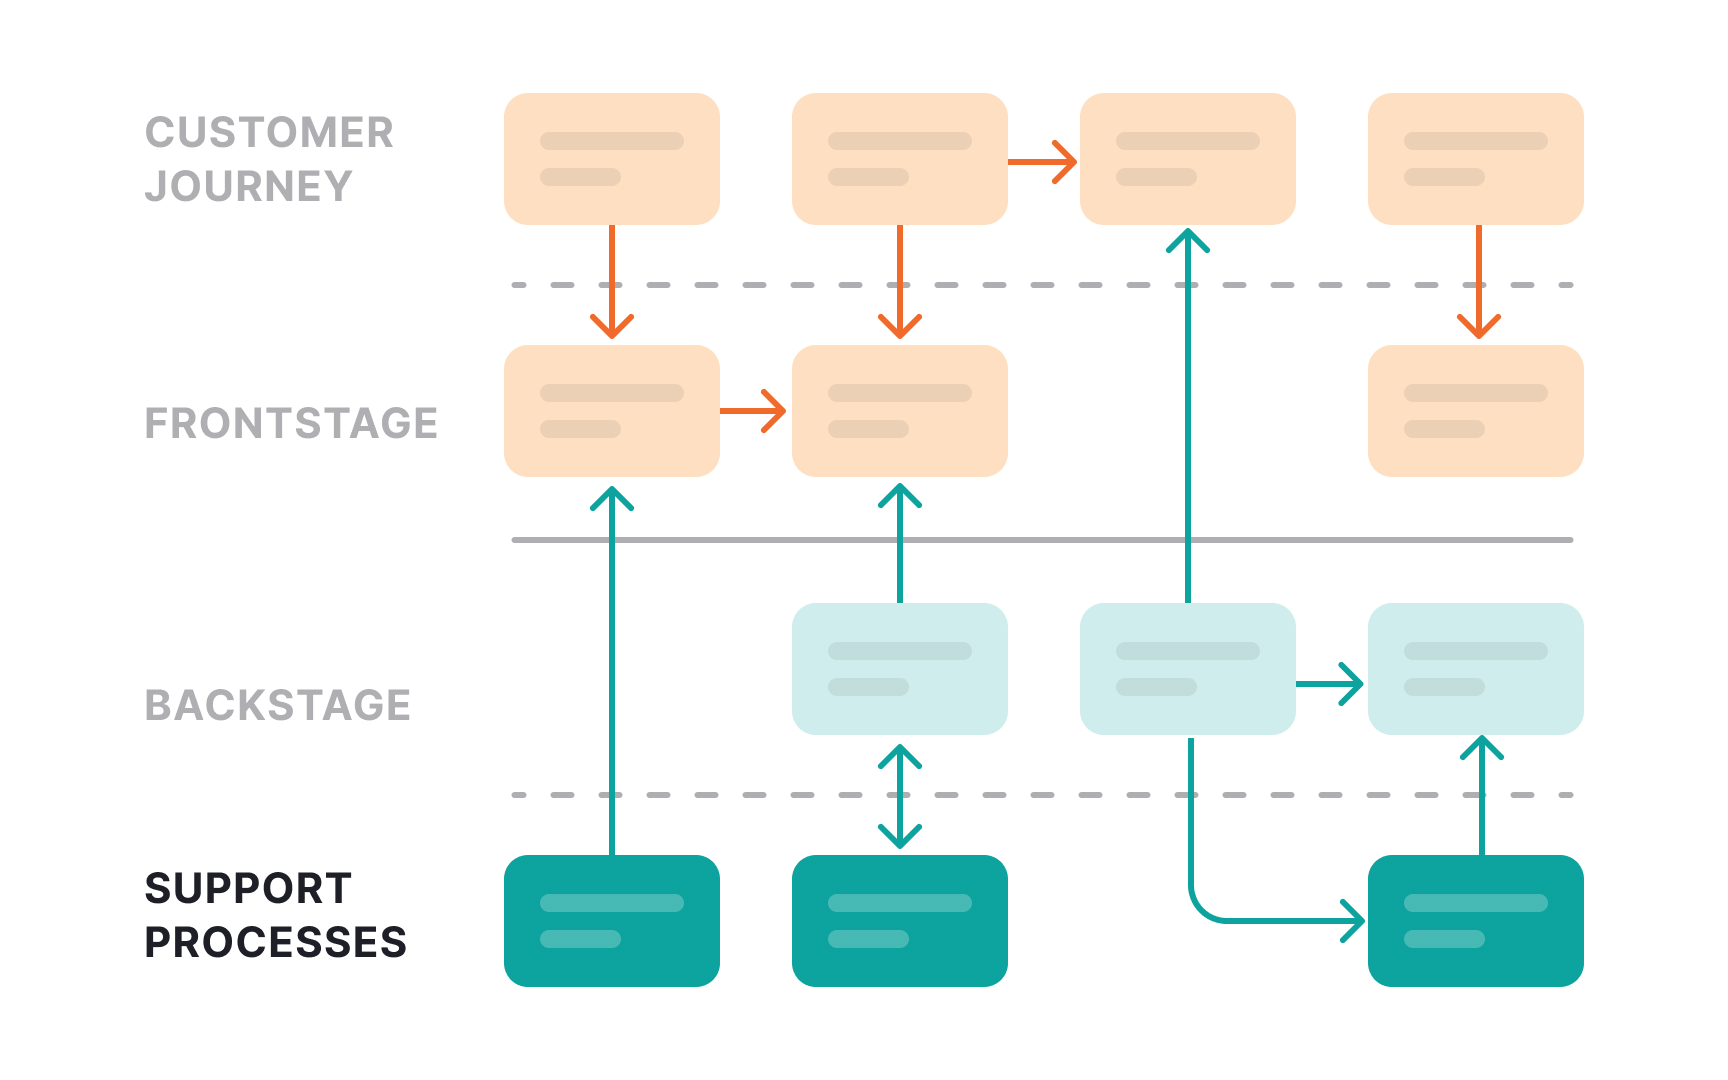
Support processes form another critical layer in service blueprints. These include all systems, databases, and procedures that enable both frontline activities and backstage actions. In government services, they range from data management processes to record-keeping systems. Each support process connects to specific activities in the layers above. When a citizen submits information through an online form, it triggers several processes: identity verification, data storage, and information processing.
Understanding these connections helps identify where support processes enhance or limit service delivery. Support processes often need to work together. Information might move from a public portal to a verification system, then to a departmental database. The blueprint should show these process
Pro Tip: Map both digital and manual support processes. Paper filing systems can be just as important as databases.
Service blueprints use lines of internal
While contact employees help citizens with applications, support employees might process previous requests or prepare required verifications. The blueprint must show these parallel activities clearly. Document the rules for crossing the line of internal interaction. Clear protocols help prevent delays when work moves between departments. For instance, specify what
Service blueprints must reflect government policies that shape service delivery. These policies set rules for how services operate, what citizens must provide, and how departments process requests. Show where specific policies influence different layers of the service blueprint. Policy requirements affect every layer of the blueprint. At the citizen
For example, an identity verification policy links to both citizen document submission and staff verification procedures. This connection helps teams understand why certain steps exist and how they might change if the policies are updated. Look for spots where multiple policies affect the same service point. These overlapping requirements often create complexity for both citizens and staff. Clear
Pro Tip: Include policy reference numbers in the blueprint to help teams quickly check exact requirements when needed.
Service blueprints need to show how long each part of the service takes. These timelines cover everything from citizen waiting periods to internal processing times. Clear time measurements help teams identify where services slow down and why.
Start by marking standard processing times at each layer of the blueprint:
- For citizen
interactions , note both active time (filling forms) and waiting time (queuing) - For backstage actions, record how long each review or approval typically takes
- For support processes, mark processing cycles that affect overall timing
Show where timeline requirements come from. Some processing times are set by policy, like maximum waiting periods for permit decisions. Others come from practical limits, like system processing capacity or staff availability. Understanding these sources helps teams identify where they can and cannot adjust timelines.
Watch for timeline gaps between blueprint layers. Service delays often happen when work moves between frontline activities, backstage actions, and support processes. Marking these transition times helps find opportunities to speed up service delivery.
Pro Tip: Use ranges rather than exact times to account for normal variations in service delivery.
Service blueprints need consistent formats across different government services. Standard
Create clear rules for blueprint documentation:
- Use consistent symbols for different types of actions
- Apply the same format for time measurements
- Keep similar color coding across blueprints
- Maintain standard labels for blueprint layers
Set guidelines for regular blueprint updates. Services change when policies update, systems improve, or new requirements emerge. Regular reviews help keep blueprints accurate and useful. Specify who updates blueprints and when.
Consider how different teams will use the blueprints. Some might focus on citizen experience, others on technical processes. Design standards that help all teams find their relevant information quickly.
References
Top contributors

Topics
From Course

Share


