Step 3: Create a flowchart
With your user journey written, map it visually as a flowchart. This diagram shows how users move through screens and how their actions lead to different outcomes. You'll get a clear picture of how many screens you need to wireframe.
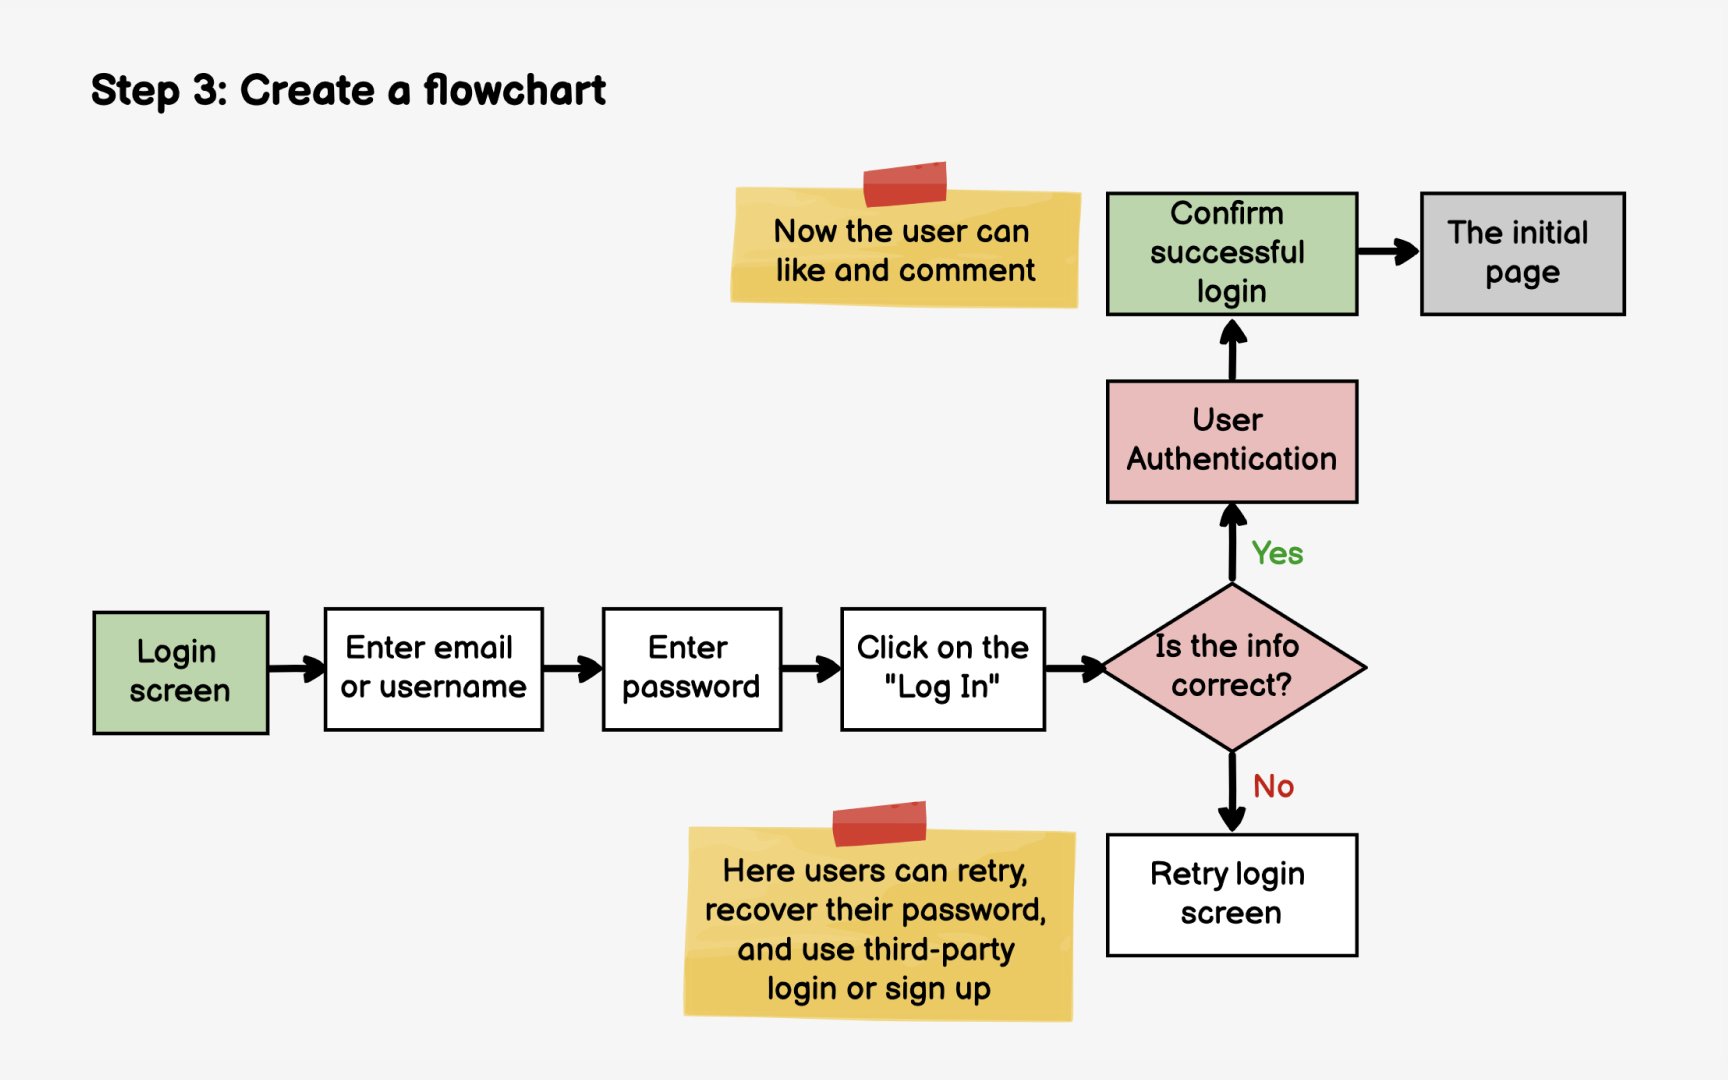
Start with the entry point, the action that triggers this flow. For a reorder feature, that might be tapping the "Reorder" button. Map each subsequent step as a node, with arrows showing the paths between them. Include decision points as diamonds: "Is item in stock?" branches to either the order summary or an out-of-stock message.
The flowchart reveals complexity that prose descriptions can hide. A simple-sounding feature might have multiple error states, edge cases, and conditional paths. Seeing these visually helps the team estimate more accurately during sprint planning.
Tools like FigJam, Miro, or Whimsical make flowcharting collaborative. Share your draft with developers early to catch technical constraints. They might note, for example, that checking inventory requires an API call that affects the flow's responsiveness, which influences your wireframe decisions.
Pro Tip: Color-code your flowchart paths: green for happy path, yellow for edge cases, red for error states.
