RICE prioritization
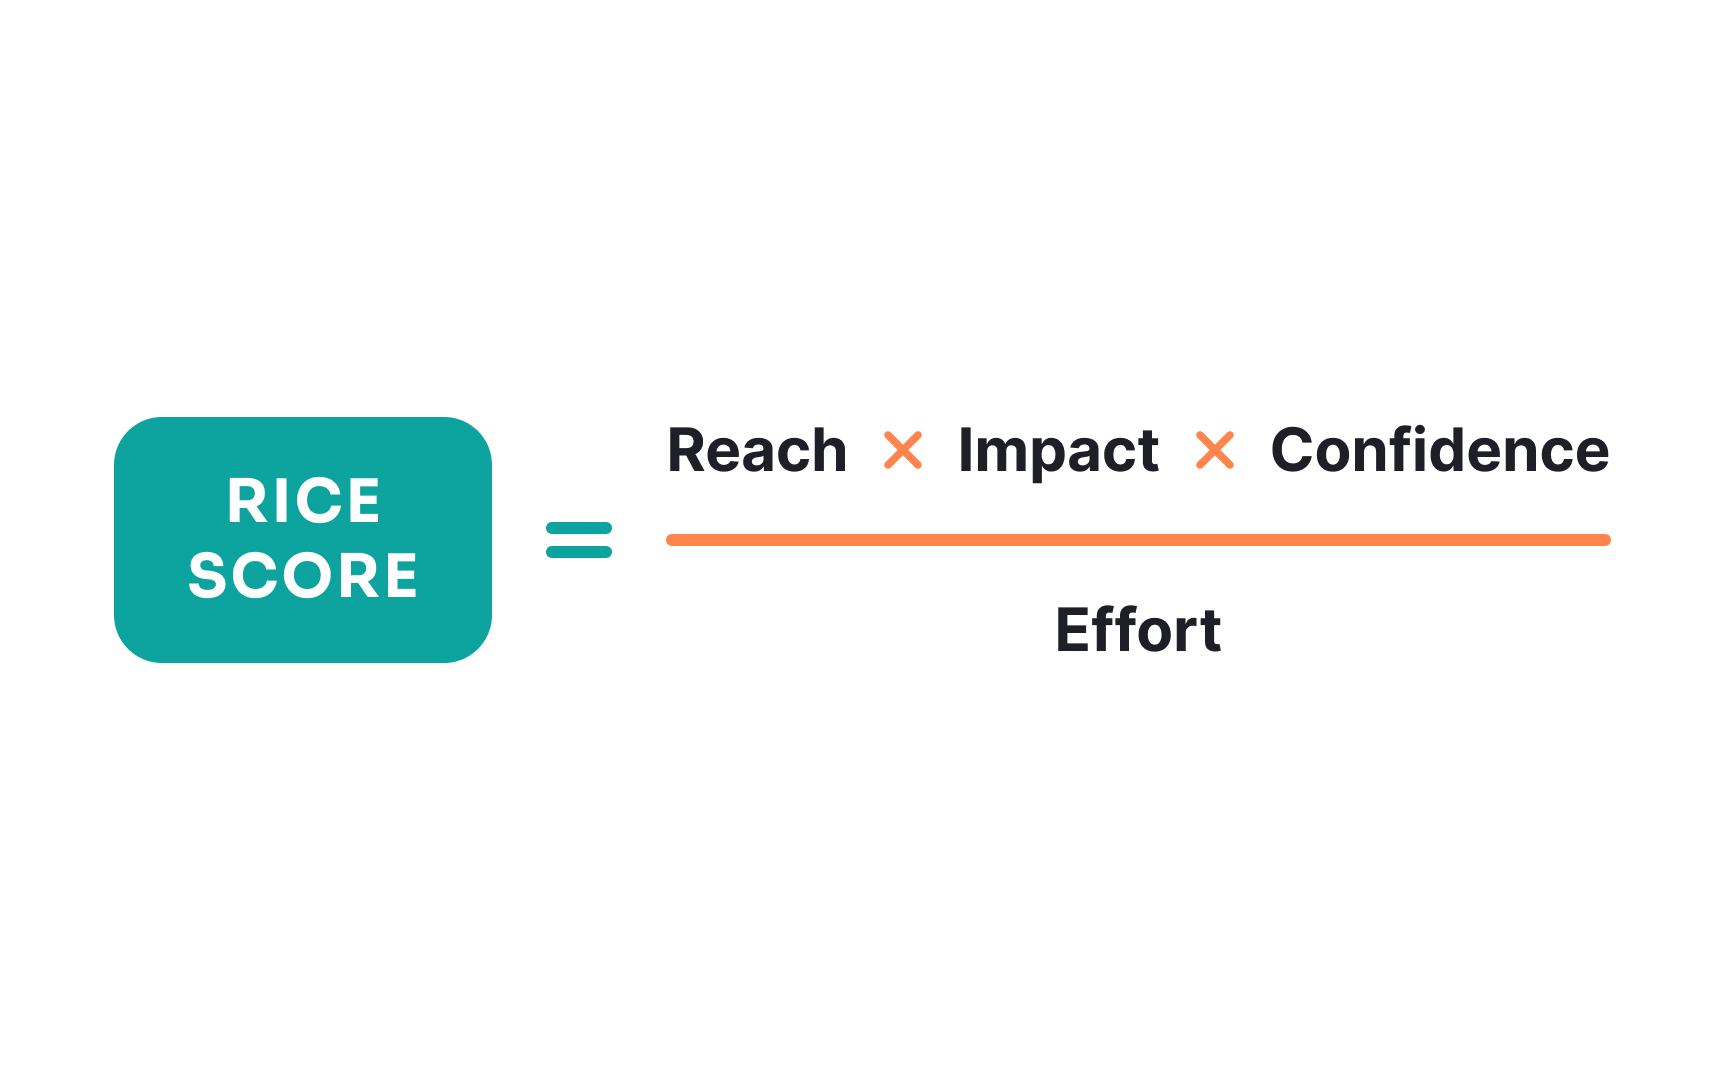
The RICE framework transforms subjective prioritization into a data-driven process using 4 key factors:
- Reach measures the number of users affected by a feature within a specific time period, such as quarterly active users.
- Impact evaluates how effectively the feature contributes to desired outcomes on a scale from minimal (0.25) to massive (3.0).
- Confidence reflects the reliability of estimates, expressed as a percentage based on available data and research quality.
- A high-confidence idea backed by solid user research might score 100%, while assumptions with minimal validation might receive 50%.
- Effort represents the total work required, typically measured in team weeks (e.g., one team member working for 4 weeks = 4 weeks of effort) or standard development story points.[1]
Calculate the RICE score by multiplying reach, impact, and confidence, then dividing by effort: (R × I × C) ÷ E. For example, a feature reaching 5000 users (R), with moderate impact (I=1), 80% confidence (C=0.8), requiring 4 weeks of effort (E) scores: (5000 × 1 × 0.8) ÷ 4 = 1000. Higher scores indicate better investment opportunities, enabling objective comparison between competing ideas.
Pro Tip: When uncertain about reach, use conservative estimates and adjust the confidence score accordingly to reflect this uncertainty in your calculations.
